The S&P 500 edged higher on Thursday, but market action was mixed overall. QQQ and SPY closed slightly higher, while IWM closed slightly lower. Seven of the nine sector SPDRs were up with energy, industrials and technology leading the way. XLI got a nice bounce from GE, which appears to be breaking out. XLE bounced as oil moved higher the last two days. Within the tech sector, the Internet ETF (FDN) and Semiconductor SPDR (XSD) led the way. Note that I will be featuring Google and GE in today's Market Message.
**This chart analysis is for educational purposes only, and should not
be construed as a recommendation to buy, sell or sell-short said securities**
Short-term Overview (Friday, 22-May-2015):
- Short-term breadth indicators are bullish.
- All five equal-weight sectors are in uptrends.
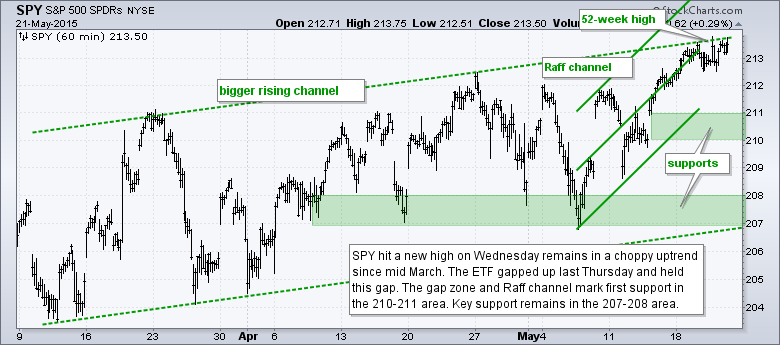
- SPY hit a new high Wednesday and remains in a choppy uptrend.
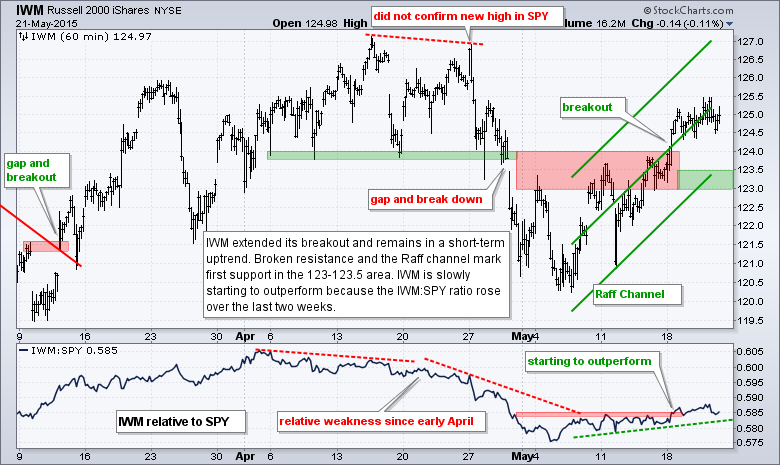
- QQQ and IWM remain in uptrends.
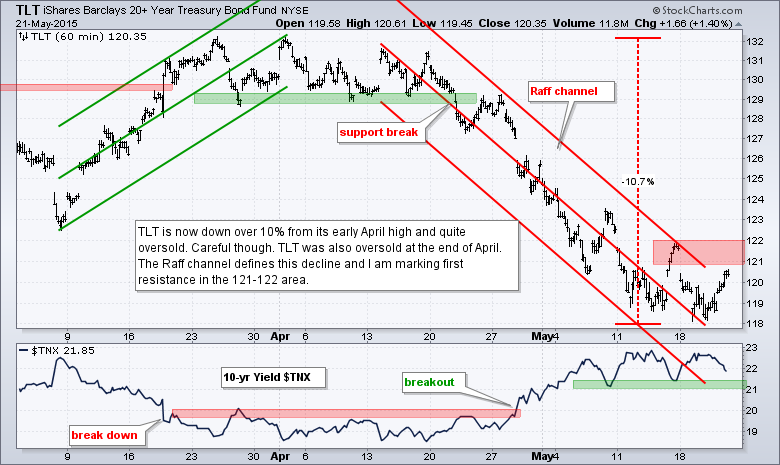
- TLT is getting an oversold bounce, but remains in a short-term downtrend.
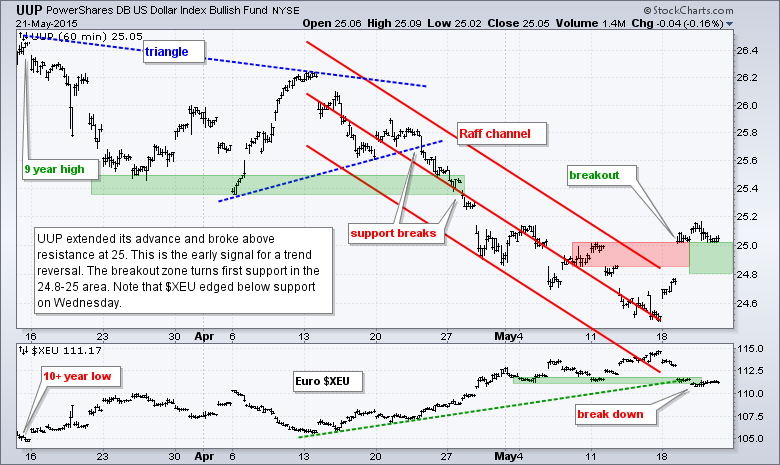
- UUP broke out on Tuesday and this breakout is holding.
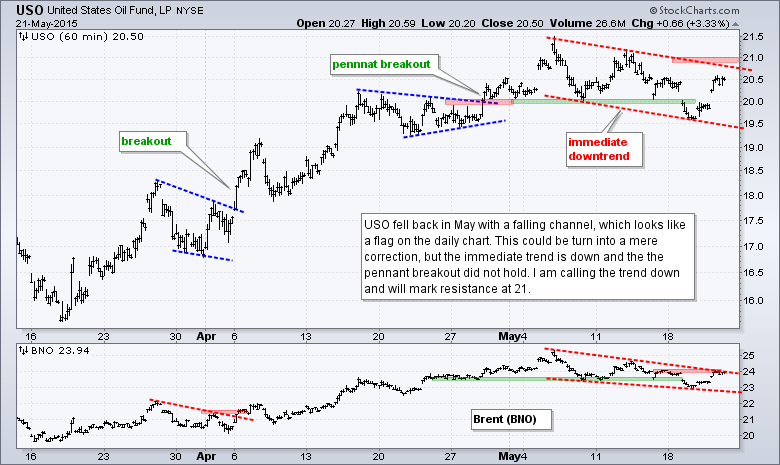
- USO got a bounce the last two days, but remains in a downtrend since early May.
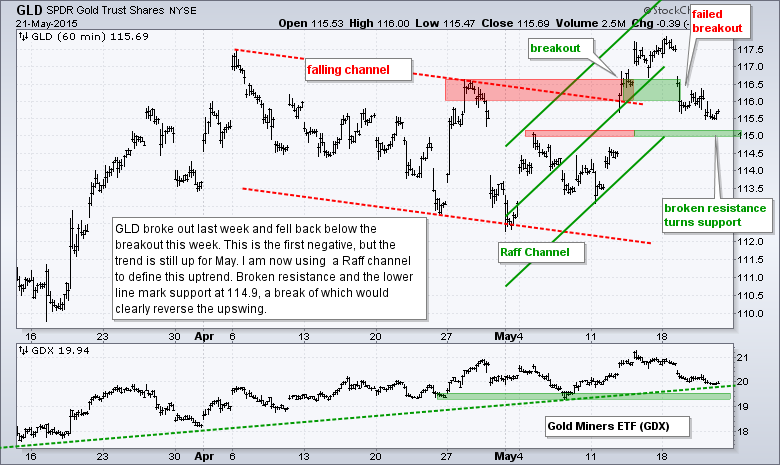
- GLD failed to hold last week's breakout, but the trend in May (three weeks) is up.
The Equal-Weight S&P 500 ETF (RSP) edged higher and there is no change on the chart. The gap on May 8th largely held and the trend line break on May 14th is also holding. The ETF hit a new high this week and remains in an uptrend with support in the 81-81.5 area.
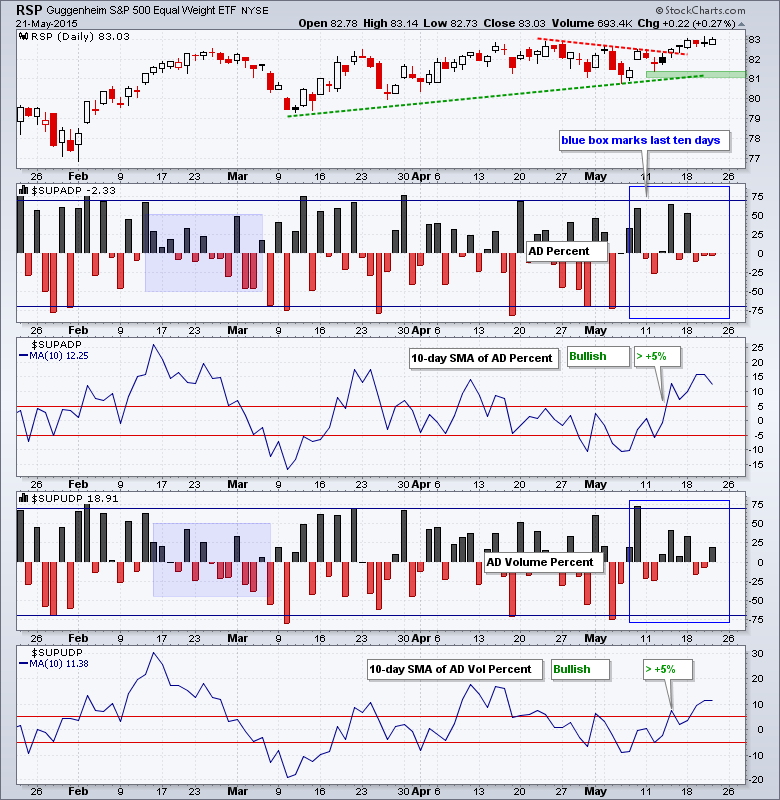
Breadth was mixed on Thursday with AD Percent finishing slightly negative and AD Volume Percent finishing slightly positive. This means large-caps were stronger than small-caps. Overall, the 10-day SMAs average it out and remain in bull mode.
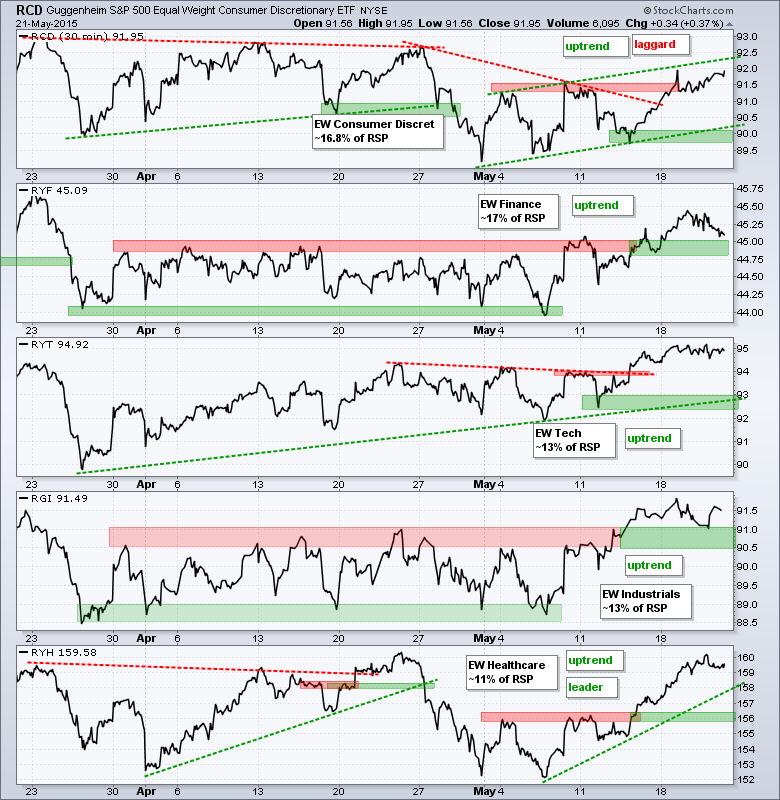
There is no change here as all five equal-weight sector ETFs remain in uptrends. The Equal-Weight Consumer Discretionary ETF (RCD) remains the laggard and well below its April highs. The Equal-weight Healthcare ETF (RYH) is up over 4% from its May low and the leader. The Equal-weight Finance ETF (RYF) broke out last week and fell back towards the breakout zone this week.
**************************************************************
**************************************************************

**************************************************************
**************************************************************
**************************************************************
**************************************************************
**************************************************************
***************************************************************
Key Reports and Events (all times Eastern):
Tue - May 26 - 08:30 - Durable Goods Orders
Tue - May 26 - 09:00 - Case-Shiller 20-city Index
Tue - May 26 - 09:00 - FHFA Housing Price Index
Tue - May 26 - 10:00 - New Home Sales
Tue - May 26 - 10:00 - Consumer Confidence
Wed - May 27 - 07:00 - MBA Mortgage Index
Thu - May 28 - 08:30 - Initial Jobless Claims
Thu - May 28 - 10:00 - Pending Home Sales
Thu - May 28 - 10:30 - Natural Gas Inventories
Thu - May 28 - 11:00 - Crude Oil Inventories
Fri - May 29 - 08:30 - GDP
Fri - May 29 - 09:45 - Chicago PMI
Fri - May 29 - 10:00 - Michigan Sentiment
This commentary is designed to stimulate thinking. This analysis is not a recommendation to buy, sell, hold or sell short any security (stock ETF or otherwise). We all need to think for ourselves when it comes to trading our own accounts. First, it is the only way to really learn. Second, we are the only ones responsible for our decisions. Think of these charts as food for further analysis. Before making a trade, it is important to have a plan. Plan the trade and trade the plan. Among other things, this includes setting a trigger level, a target area and a stop-loss level. It is also important to plan for three possible price movements: advance, decline or sideways. Have a plan for all three scenarios BEFORE making the trade. Consider possible holding times. And finally, look at overall market conditions and sector/industry performance.


