Stocks surged out of the gate and then settled into a trading range the rest of the day. The gains were modest, but they held with QQQ and IWM leading the way. Note that the Nasdaq and Russell 2000 both hit new highs again on Monday. It is hard to argue with new highs in the leading technology index and the leading small-cap index. All sectors were up with finance and energy leading the way. These two were hit on Friday so Monday's gain marks a rebound. Energy stocks are watching oil, which continues to work its way lower within a falling channel. The USO Oil Fund (USO) has yet to break this channel, but I am watching it closely. Elsewhere, airlines took off as the Airline ETF (JETS) gained 2.5%. Biotechs extended their rally as the Biotech SPDR (XBI) and Biotech iShares (IBB) hit new highs yet again.
**This chart analysis is for educational purposes only, and should not
be construed as a recommendation to buy, sell orsell-short said securities**
Short-term Overview (Tuesday, 23-June-2015):
- Short-term Breadth is bullish.
- Four of the five equal-weight sector ETFs are in uptrends.
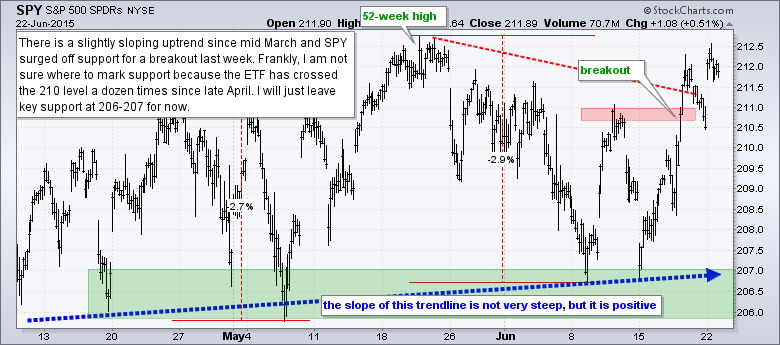
- SPY broke resistance to reverse the short-term downswing last week.
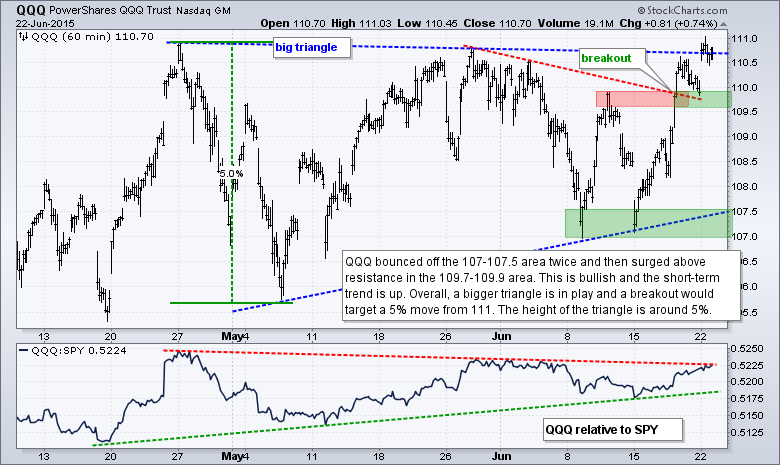
- QQQ bounced off triangle support and broke above resistance last week.
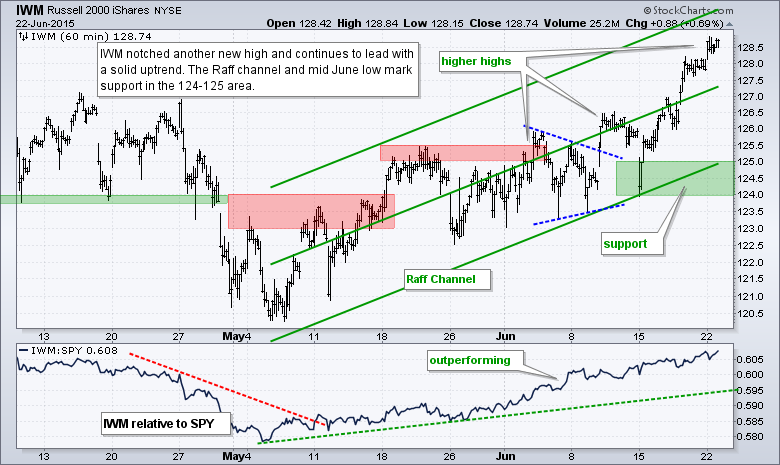
- IWM hit a new high for the move and remains in a short-term uptrend.
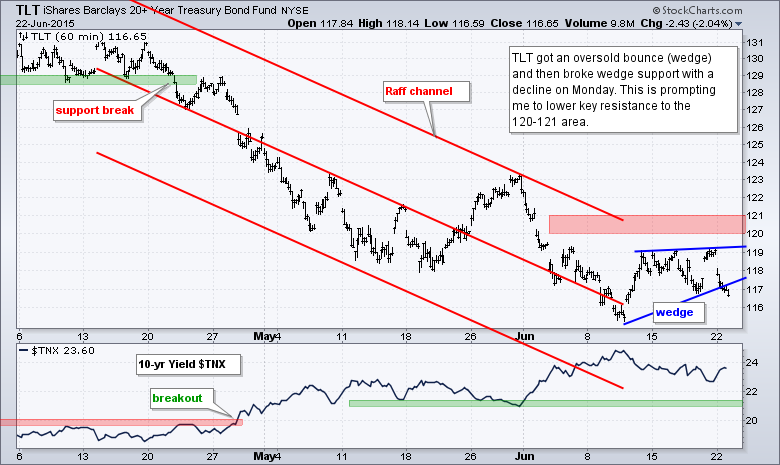
- TLT got an oversold bounce and fell back on Monday so I lowered key resistance.
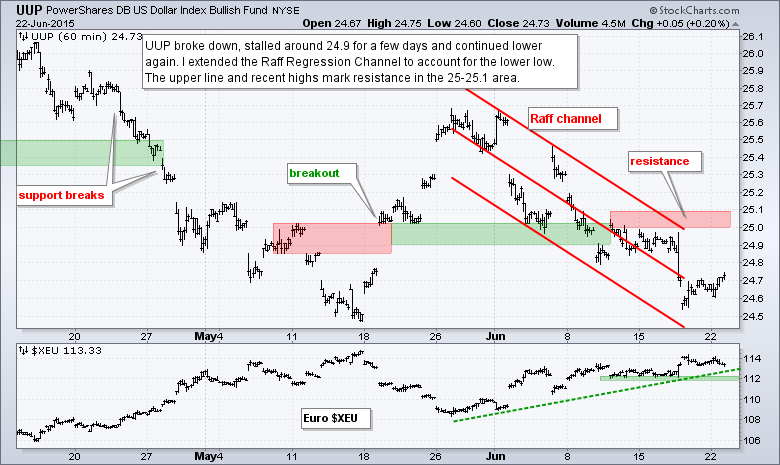
- UUP remains in a short-term downtrend.
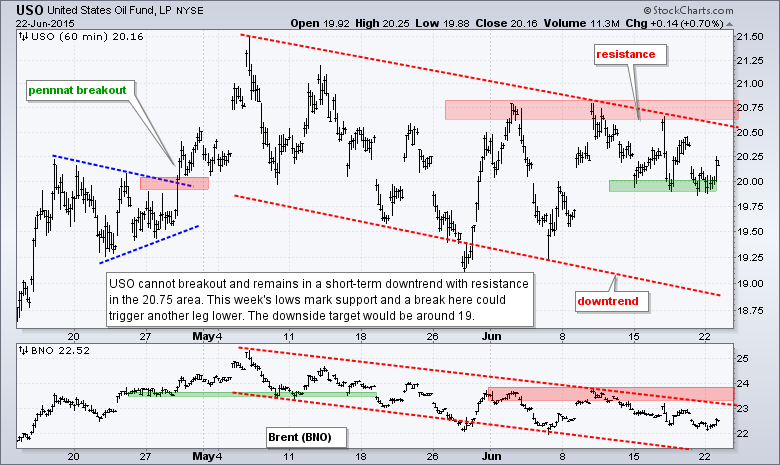
- USO remains in a short-term downtrend.
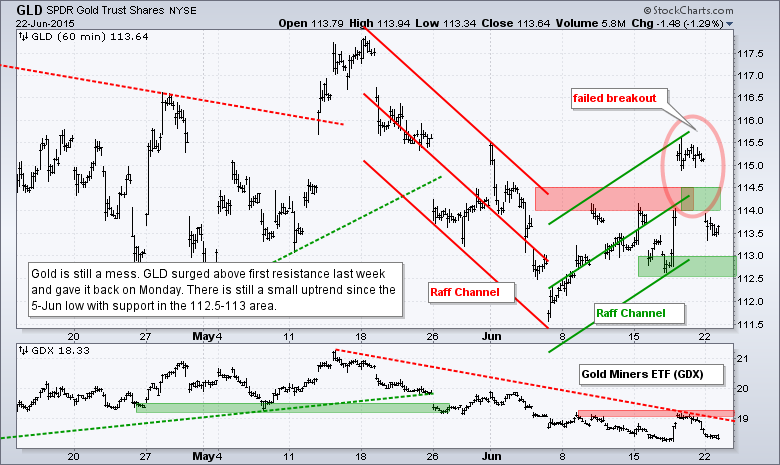
- GLD fell back below its breakout zone, but remains in a two week uptrend.
The Equal-Weight S&P 500 ETF (RSP) opened with a gap and then stalled the rest of the day. On the plus side, the gains held and the breakout is holding. On the negative side, there was no follow through after the gap. Nevertheless, the bigger breakout at 81.5 is holding and this is bullish. 81.5 marks first support to watch.
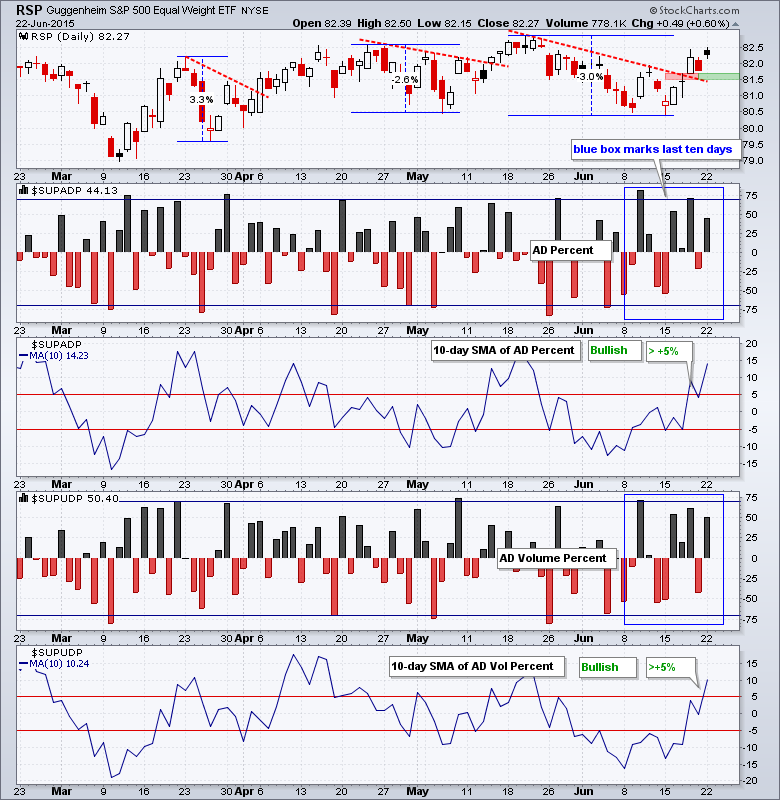
AD Percent finished positive for the sixth time in ten days. AD Volume Percent was also positive for the sixth time and exceeded +50% for the third time in five days. These breadth indicators suggest that short-term buying pressure is outpacing selling pressure. The 10-day SMA for AD Volume Percent moved above +5% to join AD Percent on a bullish signal.
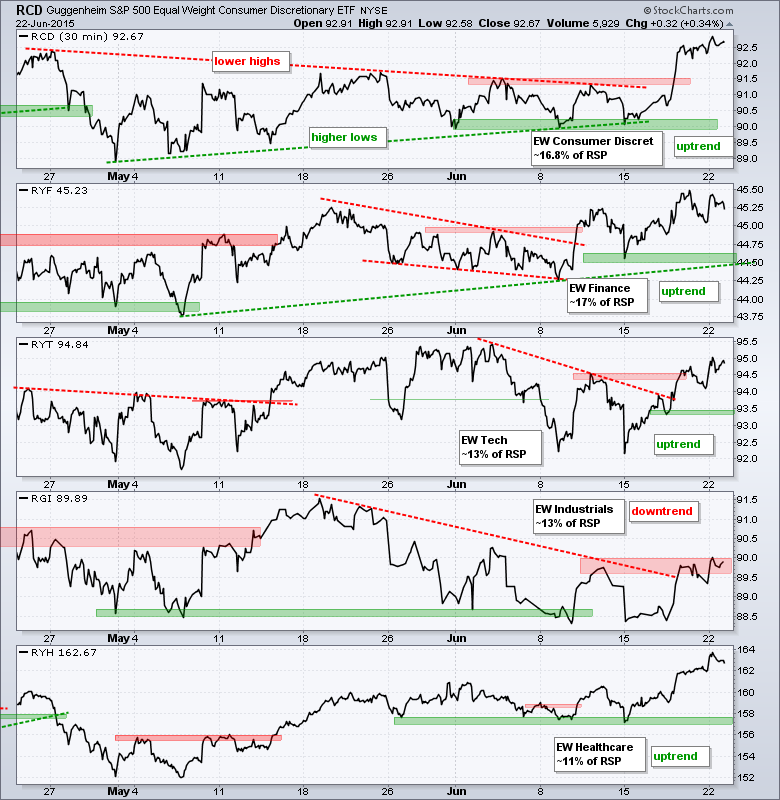
Four of the top five sector ETFs are in uptrends. The Equal-Weight Consumer Discretionary ETF (RCD) and Equal-weight Healthcare ETF (RYH) are the two leaders right now. The Equal-weight Finance ETF (RYF) stalled a bit over the last two days, but remains in a short-term uptrend and sits in third place. The Equal-weight Industrials ETF (RGI) is the laggard as it bumps against resistance. A breakout would be bullish and put all five sectors in short-term uptrends.
**************************************************************
**************************************************************
**************************************************************
**************************************************************
**************************************************************
**************************************************************
**************************************************************
***************************************************************
Key Reports and Events (all times Eastern):
Tue - Jun 23 - 08:30 - Durable Goods Orders
Tue - Jun 23 - 09:00 - FHFA Housing Price Index
Tue - Jun 23 - 10:00 - New Home Sales
Wed - Jun 24 - 08:00 - EU Summit
Wed - Jun 24 - 07:00 - MBA Mortgage Index
Wed - Jun 24 - 08:30 - GDP
Wed - Jun 24 - 10:30 - Crude Oil Inventories
Thu - Jun 25 - 08:00 - EU Summit
Thu - Jun 25 - 08:30 - Initial Jobless Claims
Thu - Jun 25 - 08:30 - Personal Income & Spending
Thu - Jun 25 - 08:30 - PCE Prices
Thu - Jun 25 - 10:30 - Natural Gas Inventories
Fri - Jun 26 - 10:00 - Michigan Sentiment
This commentary is designed to stimulate thinking. This analysis is not a recommendation to buy, sell, hold or sell short any security (stock ETF or otherwise). We all need to think for ourselves when it comes to trading our own accounts. First, it is the only way to really learn. Second, we are the only ones responsible for our decisions. Think of these charts as food for further analysis. Before making a trade, it is important to have a plan. Plan the trade and trade the plan. Among other things, this includes setting a trigger level, a target area and a stop-loss level. It is also important to plan for three possible price movements: advance, decline or sideways. Have a plan for all three scenarios BEFORE making the trade. Consider possible holding times. And finally, look at overall market conditions and sector/industry performance.


