There sure was a lot of noise last week, but this noise was not enough to affect small-caps and techs. The Russell 2000 and Nasdaq hit new highs and this is bullish for the market overall. Despite a mixed week, the Russell 2000 iShares (IWM) and the Nasdaq 100 Equal-Weight ETF (QQEW) gained around 1.5% to lead. The sectors were mixed with finance and energy losing ground last week. The consumer discretionary picked up the slack and gained around 1.5% though. It is good to see this sector leading again. Within consumer discretionary, the Home Construction iShares (ITB) gained almost 2% and the Retail SPDR (XRT) was up 1.11%. The Biotech SPDR (XBI) and HealthCare Providers ETF (IHF) led the healthcare sector.
**This chart analysis is for educational purposes only, and should not
be construed as a recommendation to buy, sell or sell-short said securities**
Short-term Overview (Monday, 22-June-2015):
- AD Percent is bullish and AD Volume Percent is still bearish, but I am calling overall breadth net bullish.
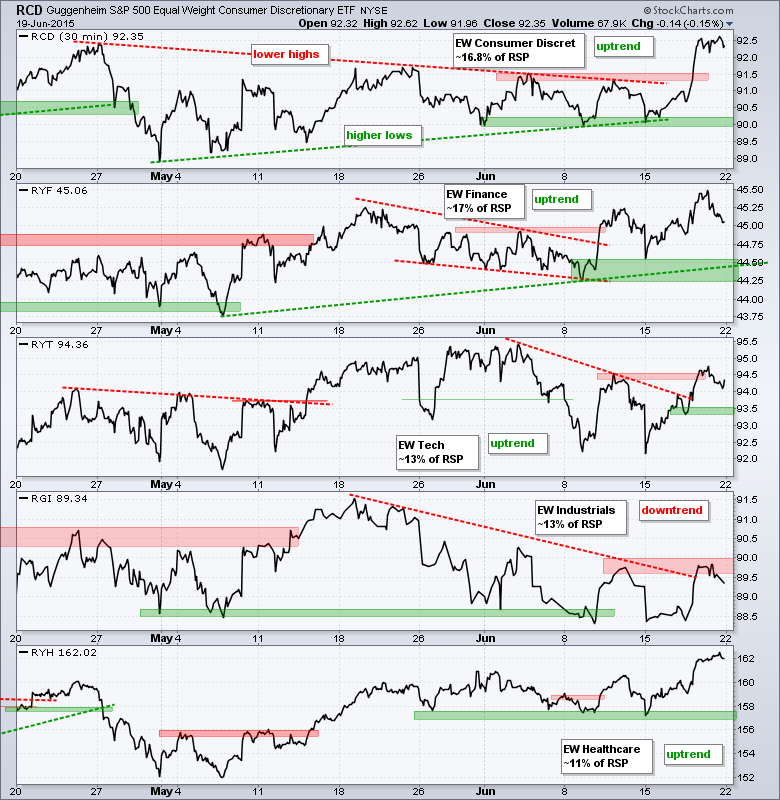
- Four of the five equal-weight sector ETFs are in uptrends.
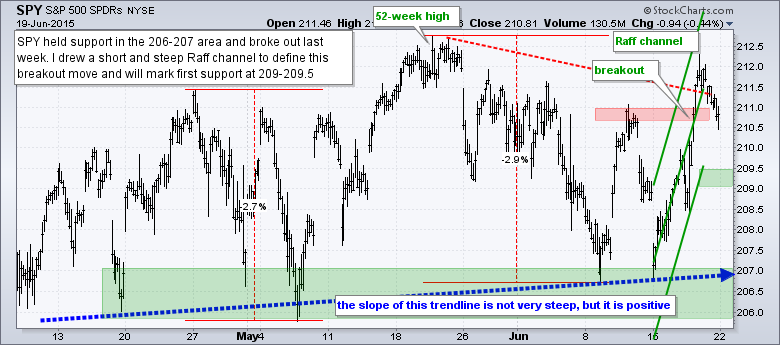
- SPY broke resistance to reverse the short-term downswing last week.
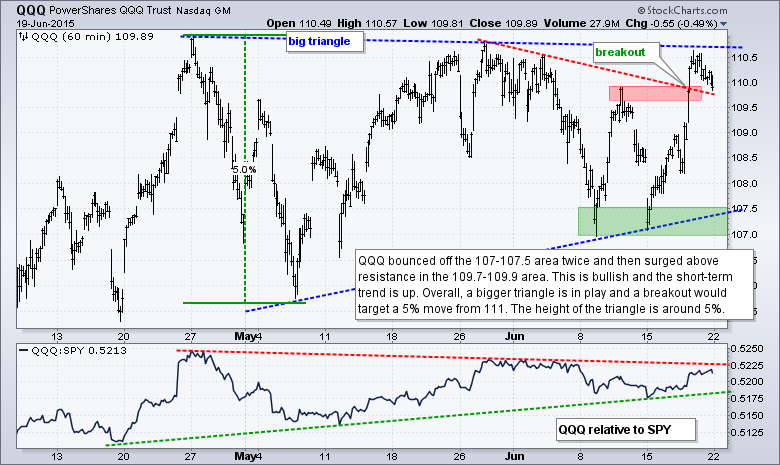
- QQQ bounced off triangle support and broke above resistance last week.
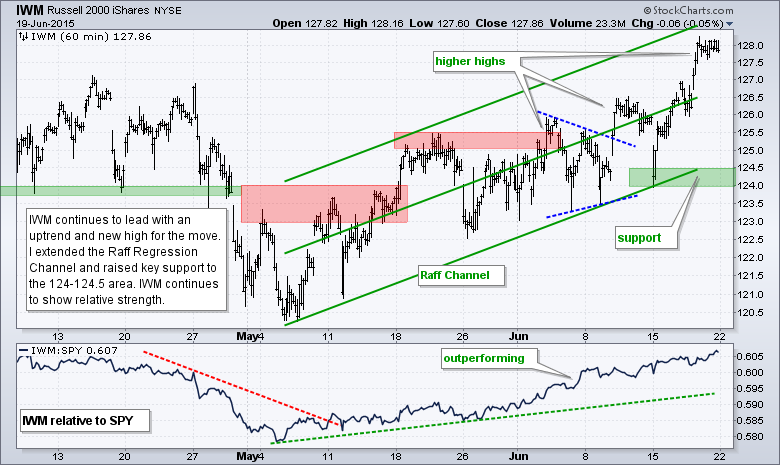
- IWM hit a new high for the move and remains in a short-term uptrend.
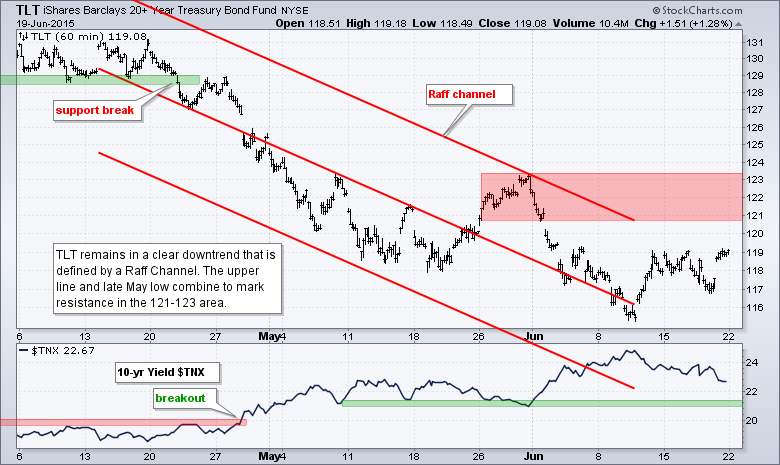
- TLT got an oversold bounce, but remains in a downtrend overall.
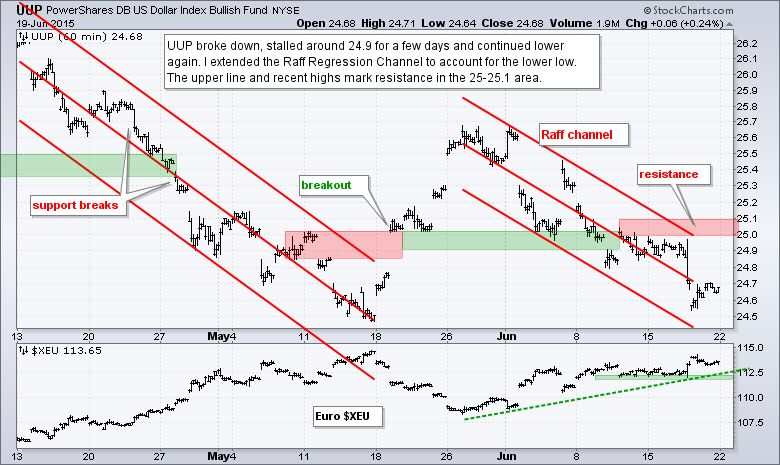
- UUP fell after the Fed announcement and remains in a short-term downtrend.
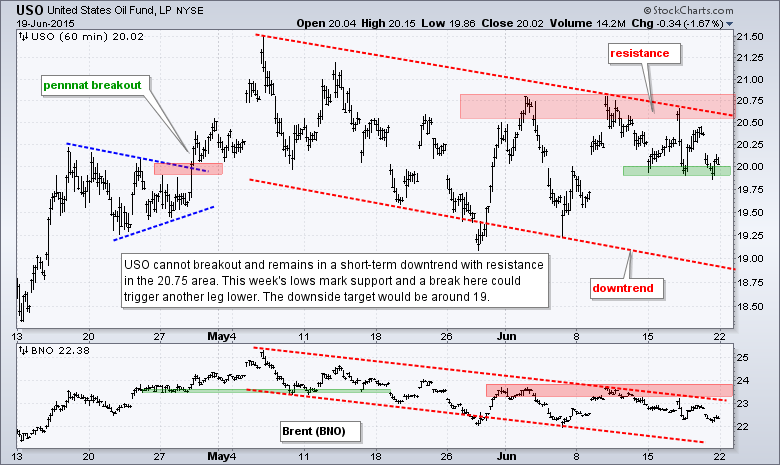
- USO remains in a short-term downtrend.
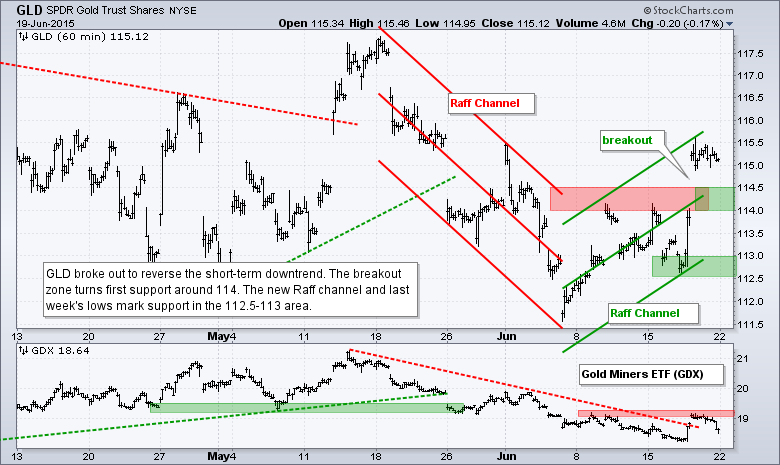
- GLD broke out to reverse the short-term downtrend last week.
The Equal-Weight S&P 500 ETF (RSP) broke out on Thursday with a gap-surge and then fell back on Friday. A strong breakout should hold so I am marking first support at 81.50 (broken resistance). A close below this level would negate the breakout and call for a reassessment of the short-term uptrend.
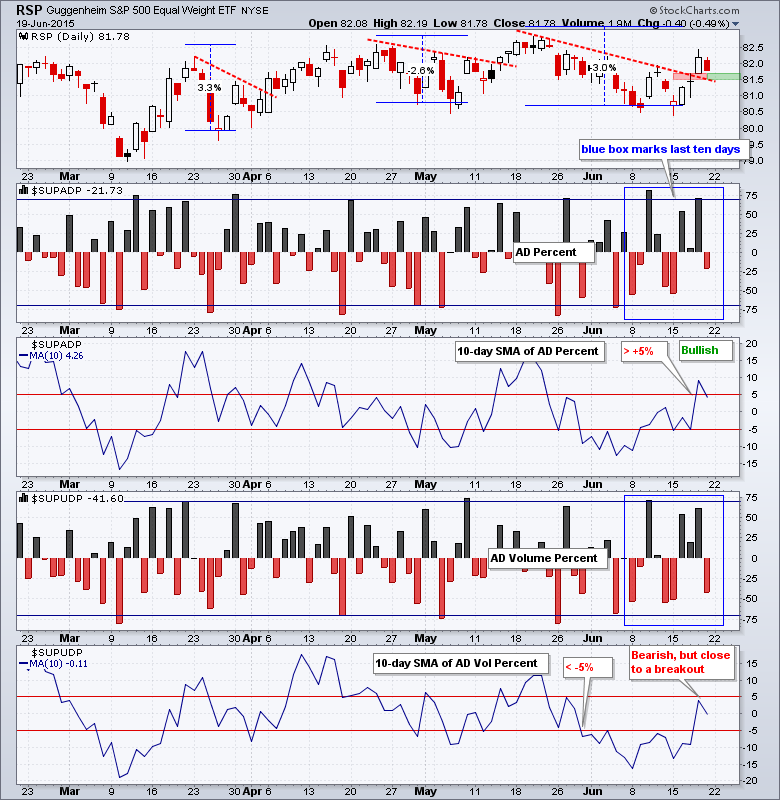
AD Percent and AD Volume Percent fell back on Friday. There was more selling pressure in large-caps because AD Volume Percent (+42%) was down more than AD Percent (-22%). The 10-day SMA for AD Percent triggered a bullish signal last week, but this has yet to be confirmed with a bullish signal from the 10-day SMA for AD Volume Percent. This is pretty much par for the course as the market remains in a mixed, and choppy uptrend.
Four of the top five sector ETFs are in uptrends. I am most impressed with the breakout in the Equal-Weight Consumer Discretionary ETF (RCD) as the ETF challenges the March-April highs. The Equal-weight Finance ETF (RYF) and Equal-weight Healthcare ETF (RYH) are also in strong uptrends as both exceeded their May highs last week. These three are the strongest right now. The Equal-weight Industrials ETF (RGI) remains the weakest and the only one in a downtrend still.
**************************************************************
**************************************************************
**************************************************************
**************************************************************
**************************************************************
**************************************************************
**************************************************************
 ***************************************************************
Key Reports and Events (all times Eastern):
Tue - Jun 23 - 08:30 - Durable Goods Orders
Tue - Jun 23 - 09:00 - FHFA Housing Price Index
Tue - Jun 23 - 10:00 - New Home Sales
Wed - Jun 24 - 08:00 - EU Summit
Wed - Jun 24 - 07:00 - MBA Mortgage Index
Wed - Jun 24 - 08:30 - GDP
Wed - Jun 24 - 10:30 - Crude Oil Inventories
Thu - Jun 25 - 08:00 - EU Summit
Thu - Jun 25 - 08:30 - Initial Jobless Claims
Thu - Jun 25 - 08:30 - Personal Income & Spending
Thu - Jun 25 - 08:30 - PCE Prices
Thu - Jun 25 - 10:30 - Natural Gas Inventories
Fri - Jun 26 - 10:00 - Michigan Sentiment
This commentary is designed to stimulate thinking. This analysis is not a recommendation to buy, sell, hold or sell short any security (stock ETF or otherwise). We all need to think for ourselves when it comes to trading our own accounts. First, it is the only way to really learn. Second, we are the only ones responsible for our decisions. Think of these charts as food for further analysis. Before making a trade, it is important to have a plan. Plan the trade and trade the plan. Among other things, this includes setting a trigger level, a target area and a stop-loss level. It is also important to plan for three possible price movements: advance, decline or sideways. Have a plan for all three scenarios BEFORE making the trade. Consider possible holding times. And finally, look at overall market conditions and sector/industry performance.


