Stocks meandered on Tuesday with the major index ETFs finishing mixed. The Nasdaq 100 Equal-Weight ETF (QQEW) and Equal-Weight S&P 500 ETF (RSP) edged lower, while the Nasdaq 100 ETF (QQQ) and S&P 500 SPDR (SPY) edged higher. The sectors were also mixed with weakness in industrials, materials, consumer staples and utilities. The consumer discretionary sector managed a small gain and continues to hold up well. The Retail SPDR (XRT) and the Global Auto ETF (CARZ) led the consumer discretionary sector higher. Elsewhere, the Internet ETF (FDN) led the tech group as Facebook (FB) surged to a new high. Banks remained strong as the Regional Bank SPDR (KRE) gained over 1% and hit another new high. The Oil & Gas Equip & Services SPDR (XES) got an oversold bounce as oil moved higher. Both remain short of trend reversing breakouts though.
**This chart analysis is for educational purposes only, and should not
be construed as a recommendation to buy, sell orsell-short said securities**
Short-term Overview (Wednesday, 24-June-2015):
- Short-term Breadth is bullish.
- Four of the five equal-weight sector ETFs are in uptrends.
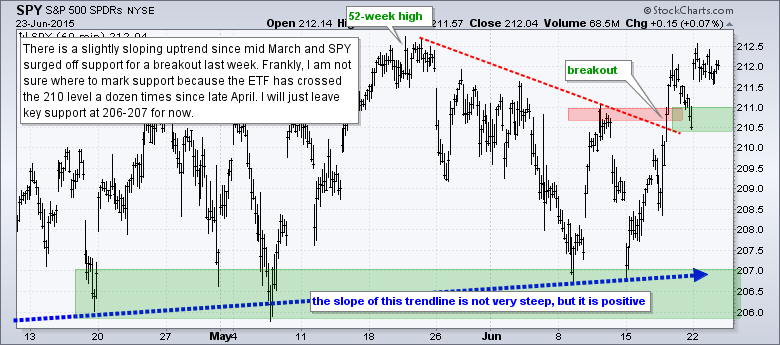
- SPY broke resistance to reverse the short-term downswing last week.
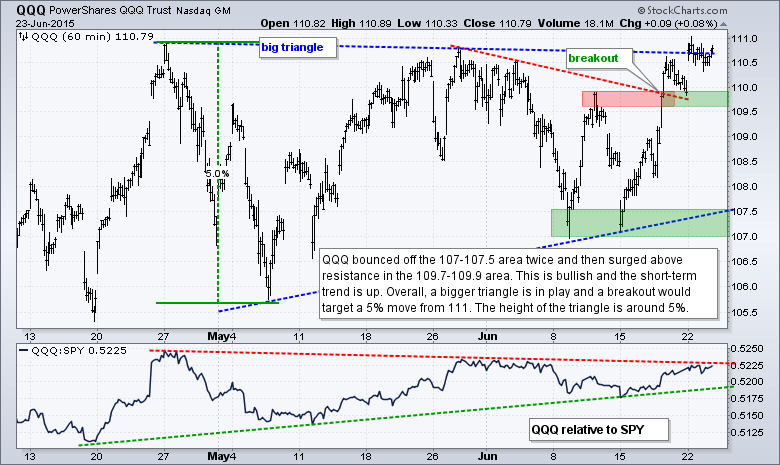
- QQQ bounced off triangle support and broke above resistance last week.
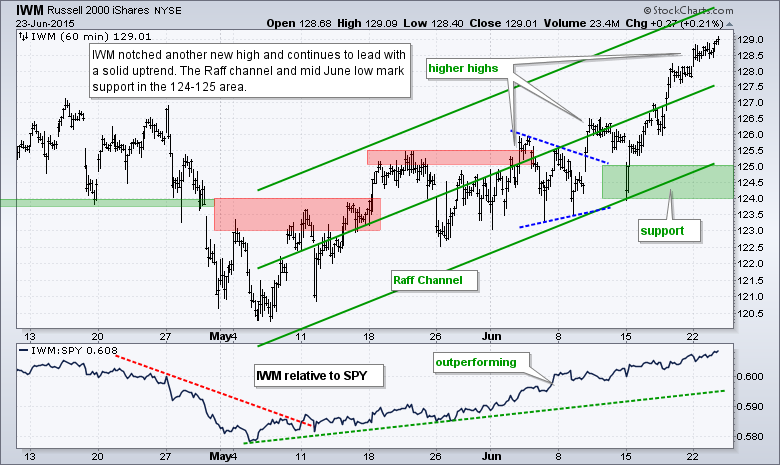
- IWM hit a new high for the move and remains in a short-term uptrend.
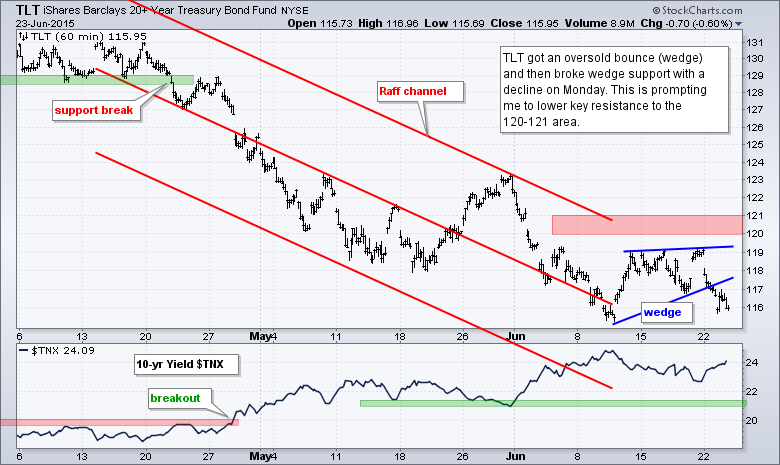
- TLT got an oversold bounce and fell back on Monday so I lowered key resistance.
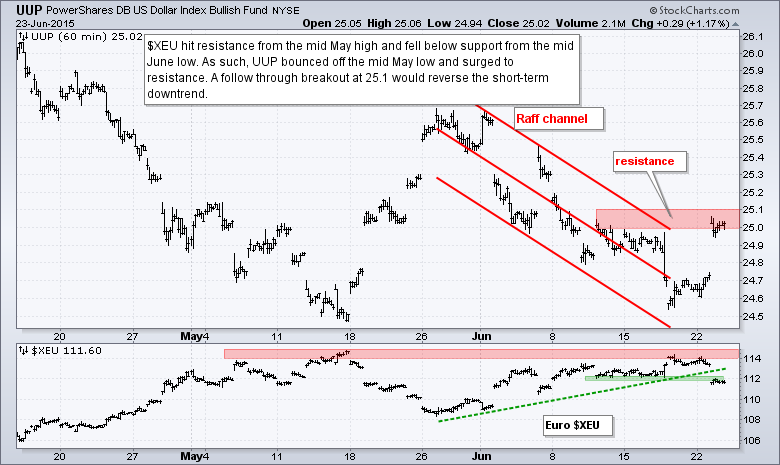
- UUP surged to resistance and needs follow through to reverse the short-term downtrend.
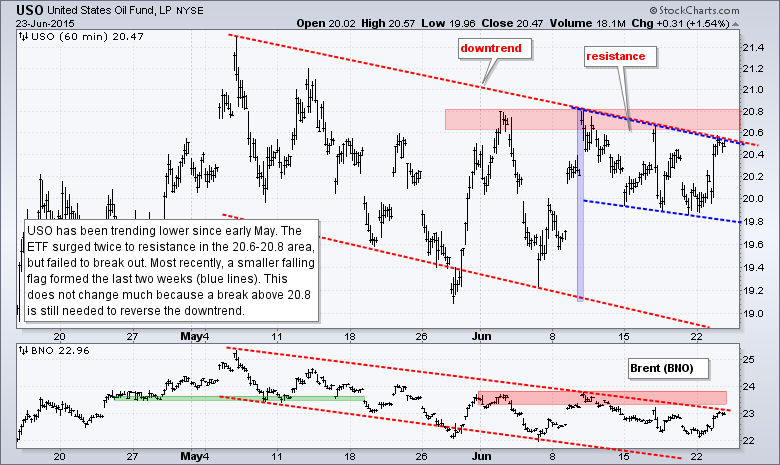
- USO formed a small falling flag the last two weeks, but short-term resistance remains unchanged.
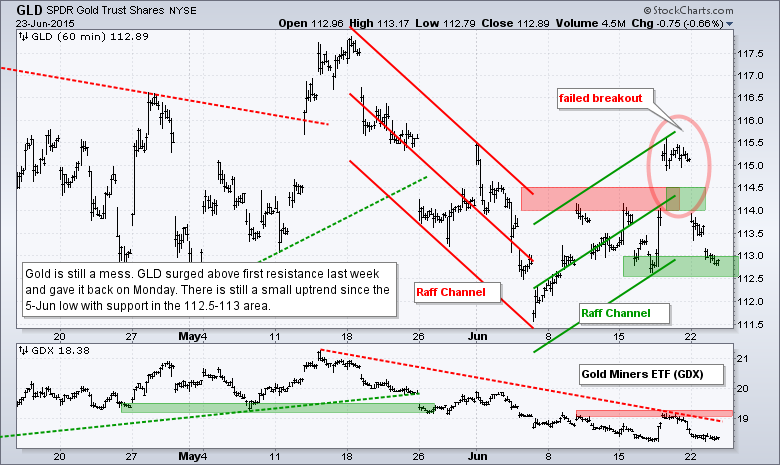
- GLD fell back below its breakout zone, but is holding support for now and remains in a two week uptrend.
The Equal-Weight S&P 500 ETF (RSP) stalled again on Tuesday, but the short-term breakout is holding with first support marked at 81.50. I am not really focused on what is happening day-to-day as long as the breakout holds. A sharp move back below 81.50 would show cold feet and call for a re-evaluation.
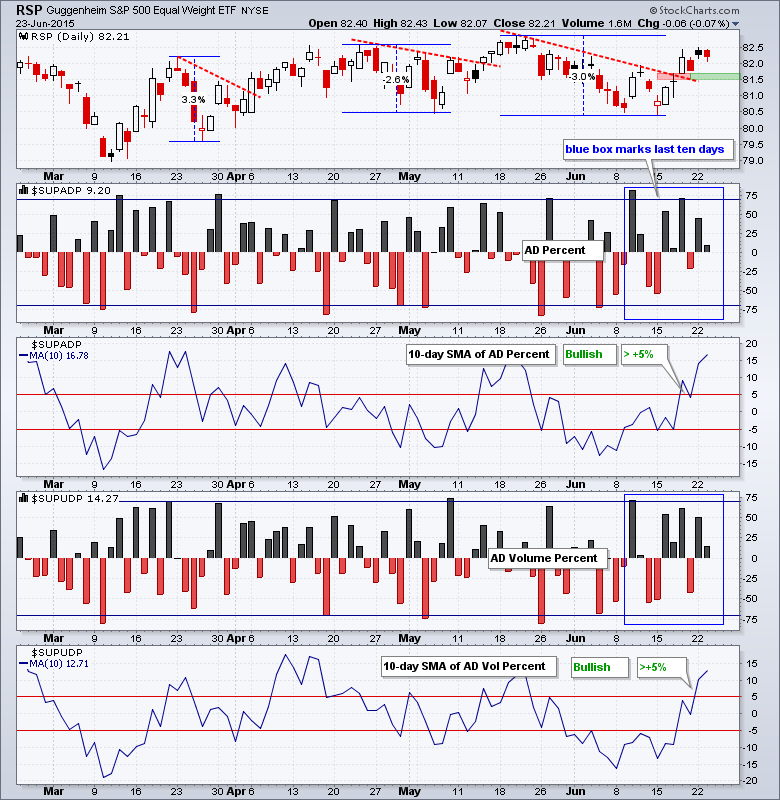
AD Percent and AD Volume Percent finished slightly positive. This marks the fifth positive day of the last six and the seventh of the last ten. The 10-day SMA for AD Percent was the first to breakout last week and the 10-day SMA for AD Volume Percent followed through with a breakout this week. Breadth is bullish right now.
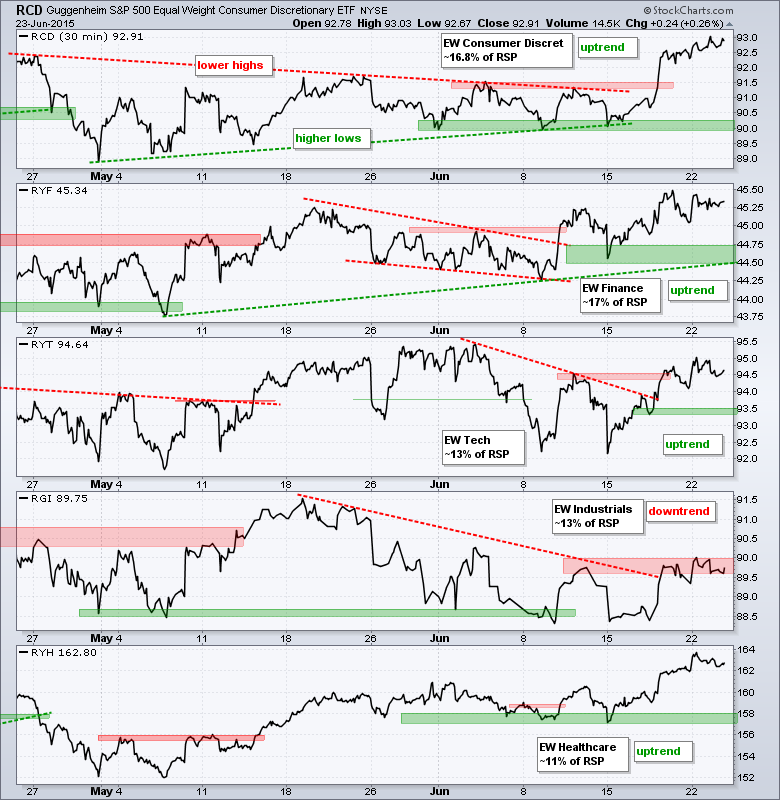
Four of the top five sector ETFs are in uptrends. The Equal-Weight Consumer Discretionary ETF (RCD) continues to impress as it works its way higher after last week's breakout. The Equal-weight Finance ETF (RYF) and Equal-weight Healthcare ETF (RYH) are also strong. The Equal-weight Industrials ETF (RGI) continues to stall at resistance and remains a relative laggard.
**************************************************************
**************************************************************
**************************************************************
**************************************************************
**************************************************************
**************************************************************
**************************************************************
***************************************************************
Key Reports and Events (all times Eastern):
Wed - Jun 24 - 08:00 - EU Summit
Wed - Jun 24 - 07:00 - MBA Mortgage Index
Wed - Jun 24 - 08:30 - GDP
Wed - Jun 24 - 10:30 - Crude Oil Inventories
Thu - Jun 25 - 08:00 - EU Summit
Thu - Jun 25 - 08:30 - Initial Jobless Claims
Thu - Jun 25 - 08:30 - Personal Income & Spending
Thu - Jun 25 - 08:30 - PCE Prices
Thu - Jun 25 - 10:30 - Natural Gas Inventories
Fri - Jun 26 - 10:00 - Michigan Sentiment
This commentary is designed to stimulate thinking. This analysis is not a recommendation to buy, sell, hold or sell short any security (stock ETF or otherwise). We all need to think for ourselves when it comes to trading our own accounts. First, it is the only way to really learn. Second, we are the only ones responsible for our decisions. Think of these charts as food for further analysis. Before making a trade, it is important to have a plan. Plan the trade and trade the plan. Among other things, this includes setting a trigger level, a target area and a stop-loss level. It is also important to plan for three possible price movements: advance, decline or sideways. Have a plan for all three scenarios BEFORE making the trade. Consider possible holding times. And finally, look at overall market conditions and sector/industry performance.


