Stocks surged with the major index ETFs gaining over 1% on the day. IWM and QQQ led with 1.5% advances. DIA and SPY gained around 1%. Eight of the nine sectors were up with solid gains coming from consumer discretionary, finance and healthcare. Energy lagged as oil remained in a short-term downtrend and did not break out. Oil and the Energy SPDR (XLE) are lagging over the last few weeks and this could foreshadow further weakness in these two. Biotechs were once again the stars as the Biotech SPDR (XBI) and Biotech iShares (IBB) surged to new highs.
**This chart analysis is for educational purposes only, and should not
be construed as a recommendation to buy, sell or sell-short said securities**
Short-term Overview (Friday, 19-June-2015):
- AD Percent is bullish and AD Volume Percent is still bearish, but I am calling overall breadth net bullish.
- Four of the five equal-weight sector ETFs are in uptrends.
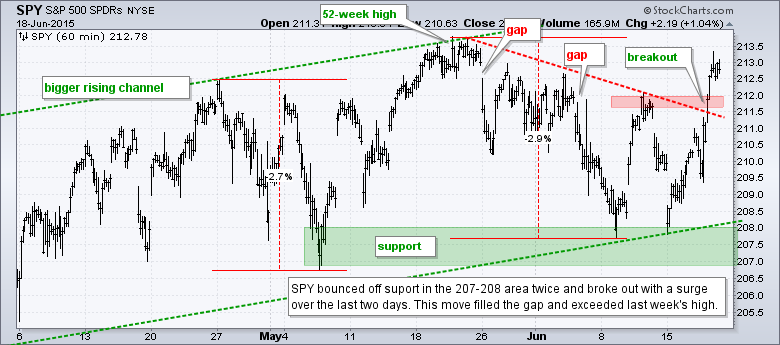
- SPY broke resistance and filled Monday's gap to reverse the short-term downtrend.
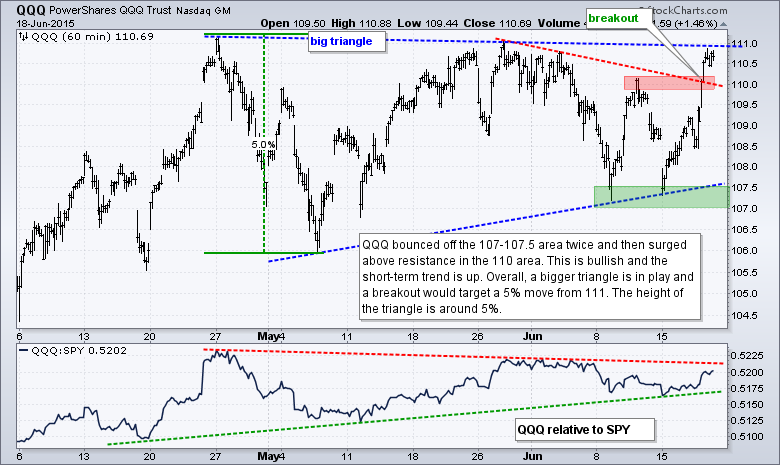
- QQQ bounced off triangle support and broke above resistance.
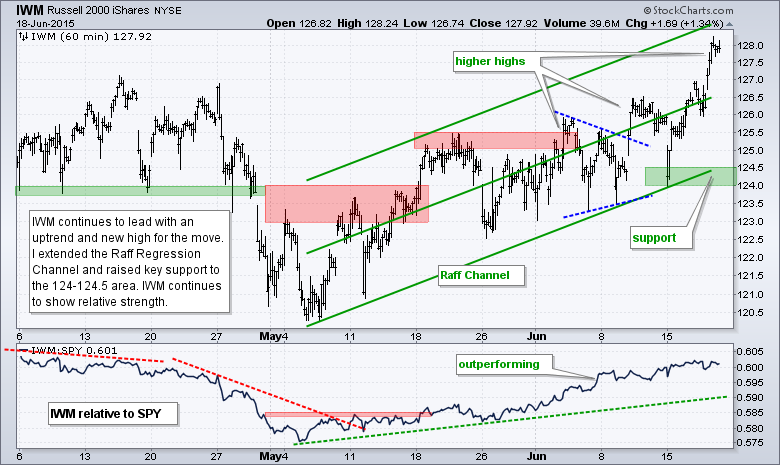
- IWM hit a new high for the move and remains in a short-term uptrend.
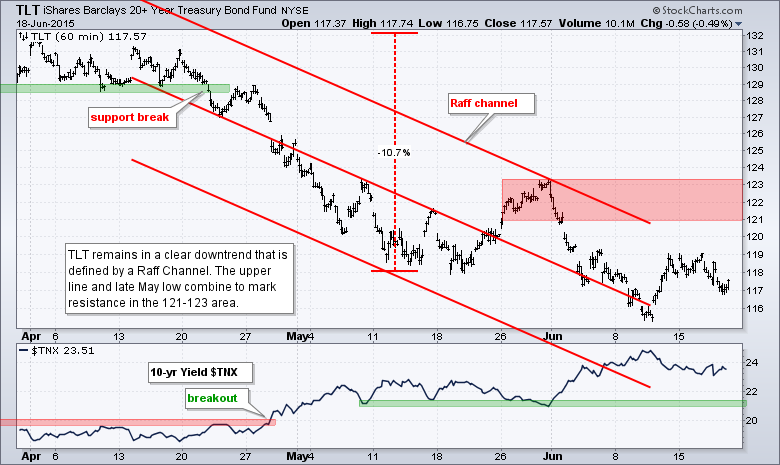
- TLT got an oversold bounce, but remains in a downtrend overall.
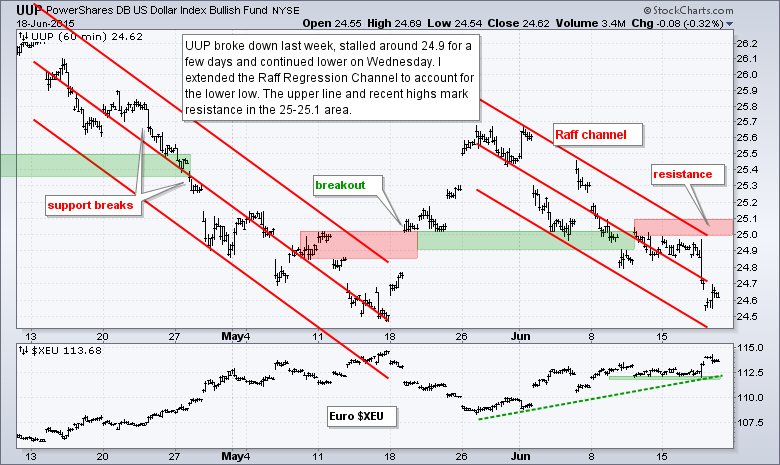
- UUP fell after the Fed announcement and remains in a short-term downtrend.
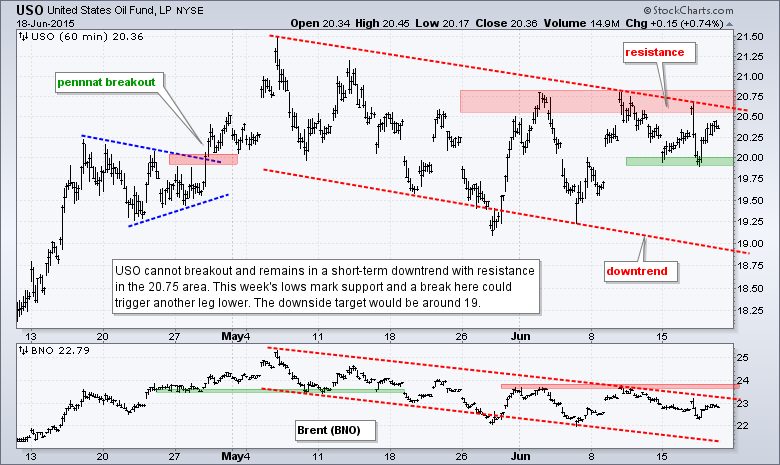
- USO remains in a short-term downtrend.
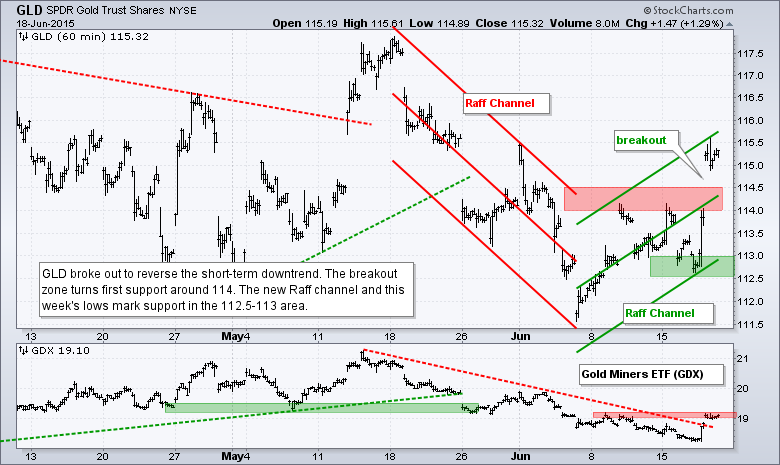
- GLD broke out to reverse the short-term downtrend.
The Equal-Weight S&P 500 ETF (RSP) gapped up and broke resistance with a pretty strong move. The break above 82 reverses the short-term downtrend and signals a continuation of the bigger uptrend, which has been in place since mid March. I will mark first support in the 81.5-82 area for now. A strong breakout should hold and a quick move back below 81.5 would be negative.
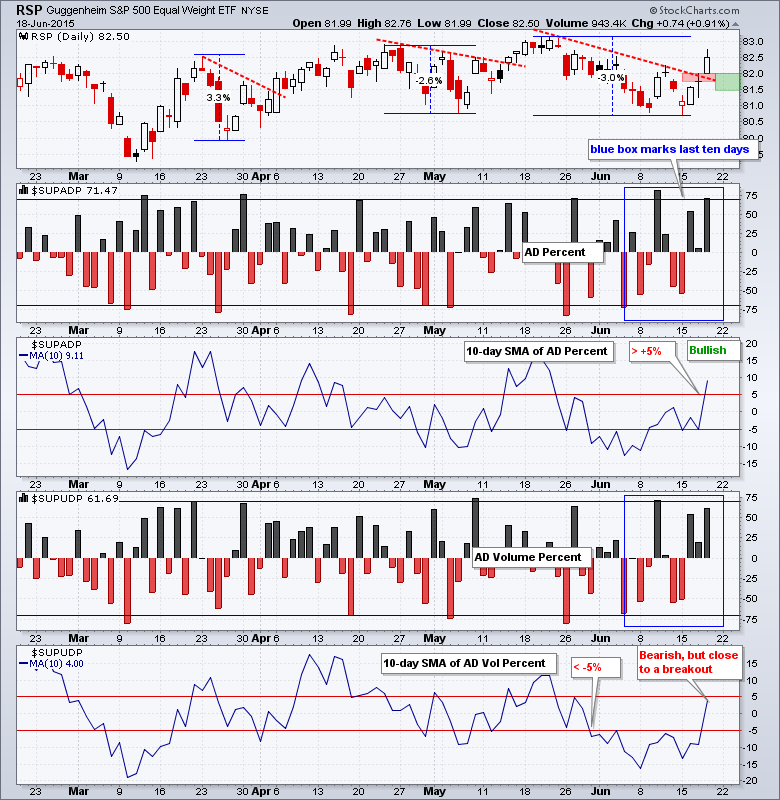
AD Percent and AD Volume Percent surged above +50% for the third time in seven days. Also notice that both have been positive five of the last seven days. The 10-day SMA for AD Percent surged above +5% for a bullish signal. The 10-day SMA for AD Volume Percent surged to +4% and fell just short of a bullish signal. On balance, I would call short-term breadth bullish right now.
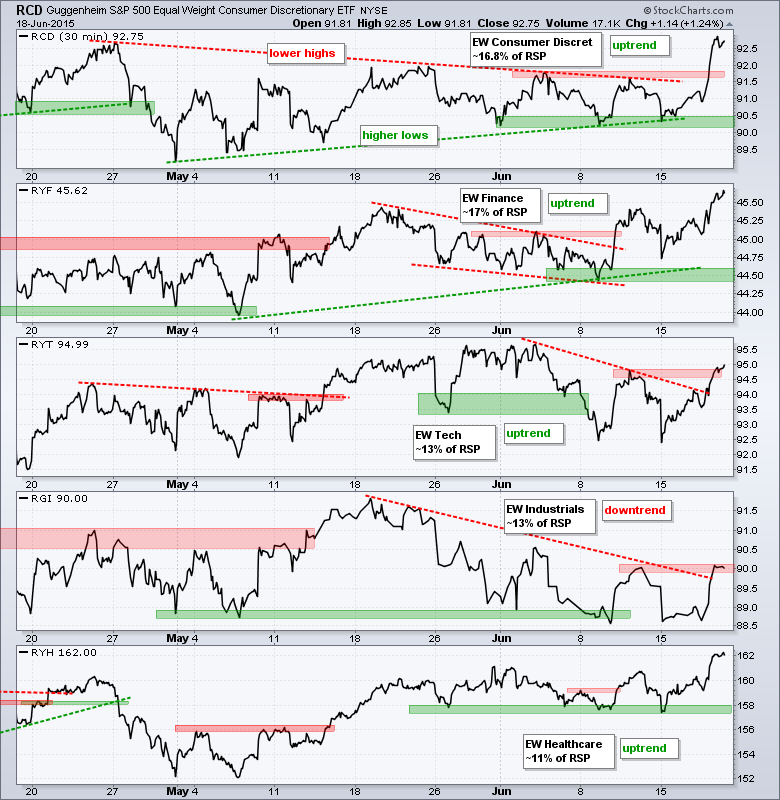
Four of the top five sector ETFs are in uptrends. The Equal-Weight Consumer Discretionary ETF (RCD) broke out and exceeded its May high. The Equal-weight Finance ETF (RYF) also broke above its May high. The Equal-weight Healthcare ETF (RYH) surged off support this week and hit a new 52-week high. These three are the leaders right now. The Equal-weight Industrials ETF (RGI) is the laggard and has yet to make a clean breakout.
**************************************************************
**************************************************************
**************************************************************
**************************************************************
**************************************************************
**************************************************************
**************************************************************
***************************************************************
Key Reports and Events (all times Eastern):
Mon - Jun 22 - 10:00 - Existing Home Sales
Tue - Jun 23 - 08:30 - Durable Goods Orders
Tue - Jun 23 - 09:00 - FHFA Housing Price Index
Tue - Jun 23 - 10:00 - New Home Sales
Wed - Jun 24 - 08:00 - EU Summit
Wed - Jun 24 - 07:00 - MBA Mortgage Index
Wed - Jun 24 - 08:30 - GDP
Wed - Jun 24 - 10:30 - Crude Oil Inventories
Thu - Jun 25 - 08:00 - EU Summit
Thu - Jun 25 - 08:30 - Initial Jobless Claims
Thu - Jun 25 - 08:30 - Personal Income & Spending
Thu - Jun 25 - 08:30 - PCE Prices
Thu - Jun 25 - 10:30 - Natural Gas Inventories
Fri - Jun 26 - 10:00 - Michigan Sentiment
This commentary is designed to stimulate thinking. This analysis is not a recommendation to buy, sell, hold or sell short any security (stock ETF or otherwise). We all need to think for ourselves when it comes to trading our own accounts. First, it is the only way to really learn. Second, we are the only ones responsible for our decisions. Think of these charts as food for further analysis. Before making a trade, it is important to have a plan. Plan the trade and trade the plan. Among other things, this includes setting a trigger level, a target area and a stop-loss level. It is also important to plan for three possible price movements: advance, decline or sideways. Have a plan for all three scenarios BEFORE making the trade. Consider possible holding times. And finally, look at overall market conditions and sector/industry performance.


