Stocks just couldn't bear the pressure any longer and sold off on Thursday. The S&P 500 opened weak and finished weak for a .86% decline on the day. Overall, the decline is not that big and the index is still less than 2% from an all time high. Selling pressure was pretty much across the board with all sectors moving lower. Commodity-related ETFs were hit especially hard with the Copper Miners ETF (COPX) falling 3%, the Gold Miners ETF (GDX) losing 1.75% and the Steel ETF (SLX) down 1.73%. Defense stocks were also hammered as the iShares Aerospace & Defense ETF (ITA) and Aerospace & Defense ETF (PPA) fell over 1%.
**This chart analysis is for educational purposes only, and should not
be construed as a recommendation to buy, sell or sell-short said securities**
Short-term Overview (Friday, 5-June-2015):
- Short-term breadth is bearish.
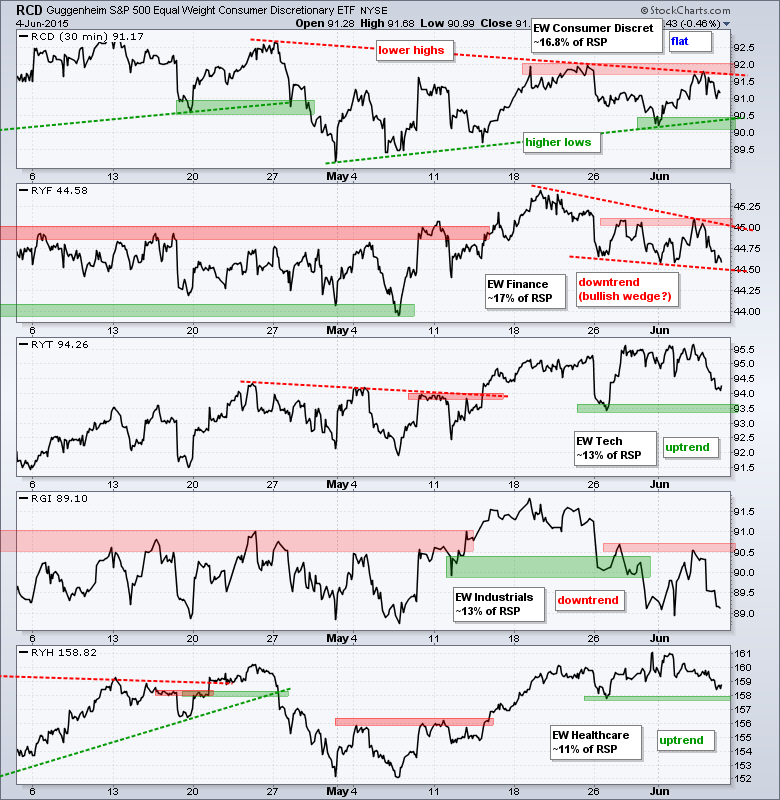
- The equal-weight sectors are mixed: 2 up, 2 down and 1 flat.
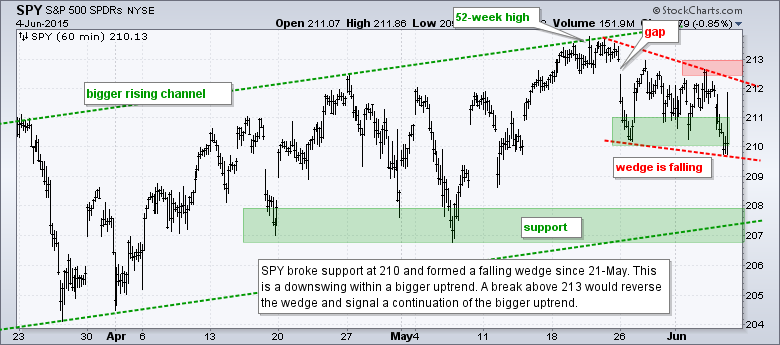
- SPY broke first support and formed a falling wedge.
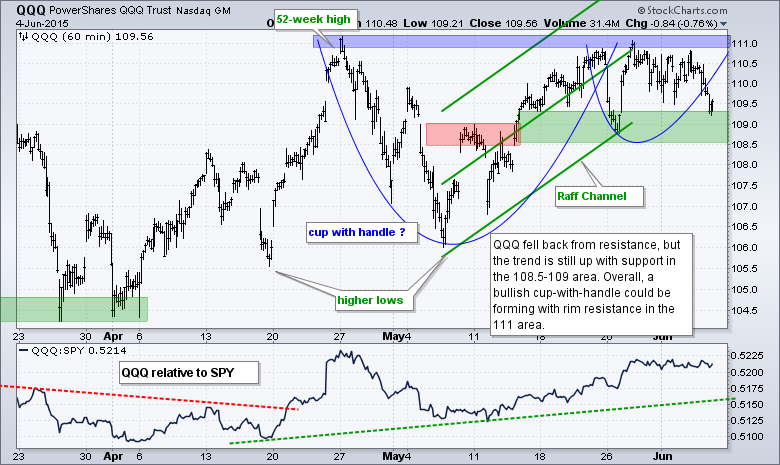
- QQQ is consolidating above support with a possible cup-with-handle.
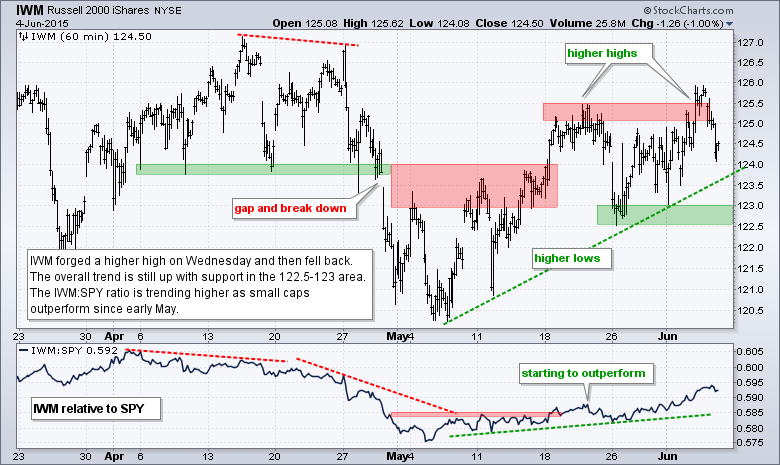
- IWM remains in a short-term uptrend and shows relative strength.
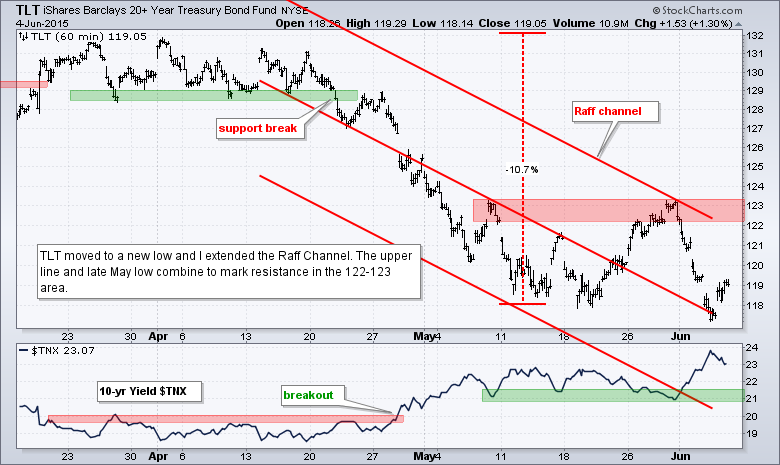
- TLT remains in a downtrend.
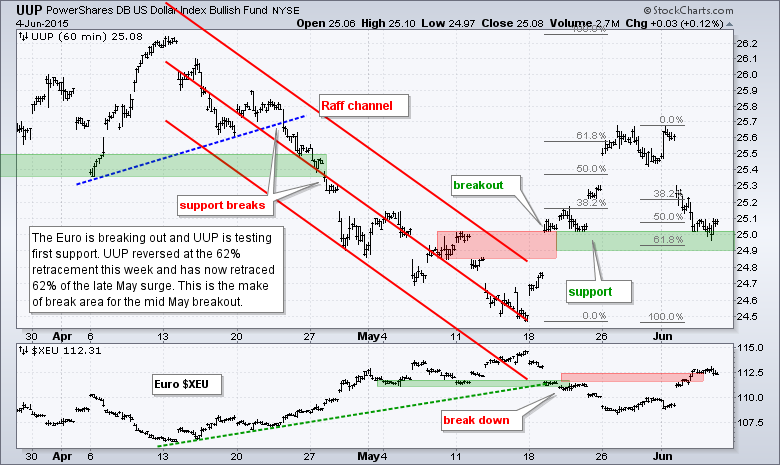
- UUP fell back hard and is now at the make-or-break level.
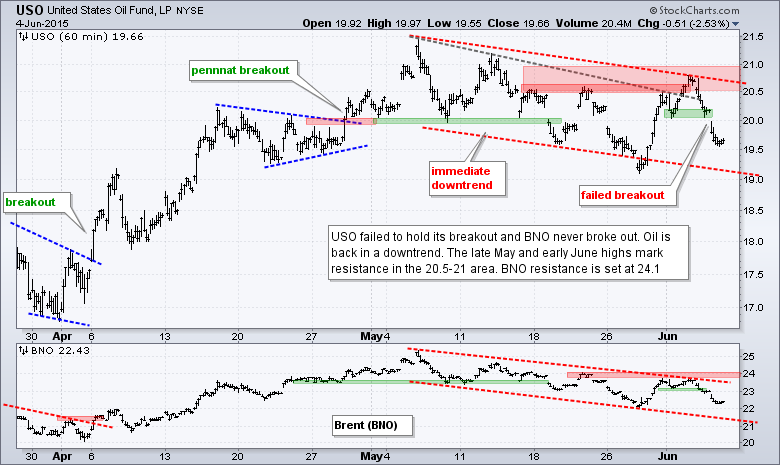
- USO failed to hold the breakout and fell back into a short-term downtrend.
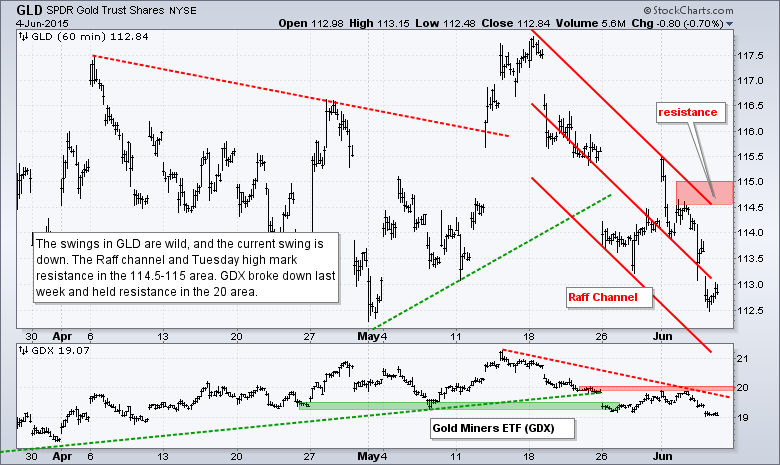
- GLD plunged and extended its short-term downtrend.
The Equal-Weight S&P 500 ETF (RSP) opened weak and closed below support. The swing has been down since last week's gap below 82.75. Thursday's decline represents a continuation of last week's decline, but the ETF closed just above 81.5 (81.52 to be exact). There could still be support in the 81.5-82 area, but a break above 82.6 is needed to reverse the downswing.
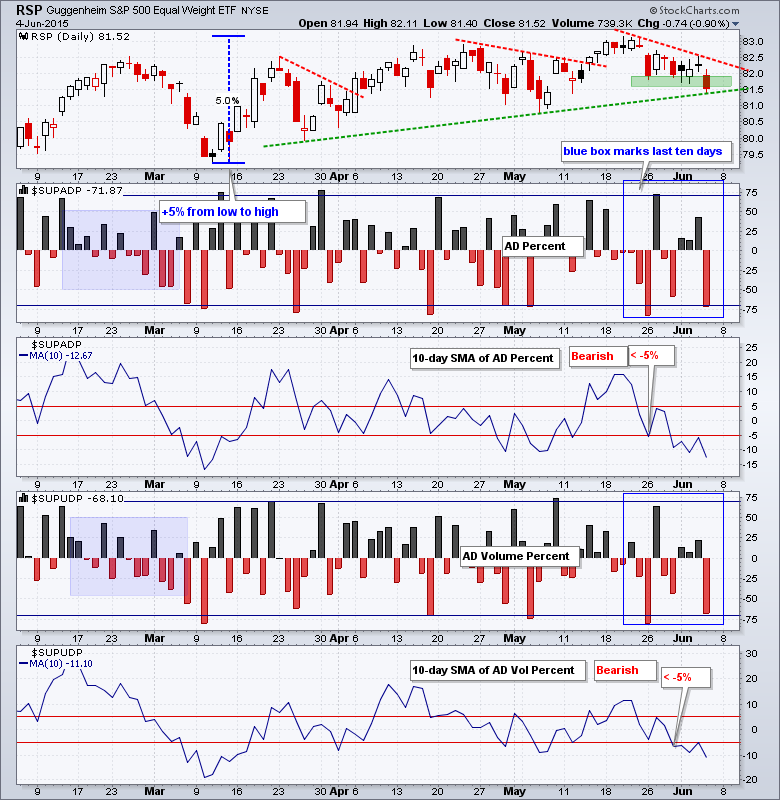
AD Percent fell below -50% for the third time in eight days and AD Volume Percent fell below 50% for the second time in eight days. Overall, breadth has been bearish since last week and remains bearish. Both indicators need to cross above +5% to turn bullish again.
The equal-weight sector ETFs remain mixed overall. The Equal-Weight Consumer Discretionary ETF (RCD) is flat and forming a big triangle. The Equal-weight Finance ETF (RYF) is in a falling wedge. Both need breakouts to reverse the short-term slide in the broader market. The Equal-weight Industrials ETF (RGI) fell back from resistance and remains weak.
**************************************************************
**************************************************************
**************************************************************
**************************************************************
**************************************************************
**************************************************************
**************************************************************
***************************************************************
Keep in mind that Friday is a loaded day. We have non-farm payrolls, the deadline for Greece and an OPEC meeting. Probably best just to turn off the market and watch the semi-final between Djokovic and Murray.
Key Reports and Events (all times Eastern):
Fri - Jun 05 - 08:30 - Employment Report
Fri - Jun 05 - 14:00 - Consumer Credit
Tue - Jun 09 - 10:00 - Wholesale Inventories
Tue - Jun 09 - 10:00 - JOLTS - Job Openings
Wed - Jun 10 - 07:00 - MBA Mortgage Index
Wed - Jun 10 - 10:30 - Crude Oil Inventories
Wed - Jun 10 - 14:00 - Treasury Budget
Thu - Jun 11 - 08:30 - Initial Jobless Claims
Thu - Jun 11 - 08:30 - Retail Sales
Thu - Jun 11 - 10:00 - Business Inventories
Thu - Jun 11 - 10:30 - Natural Gas Inventories
Fri - Jun 12 - 08:30 - Producer Price Index (PPI)
Fri - Jun 12 - 10:00 - Michigan Sentiment
Mon - Jun 15 - 08:30 - Empire State Manufacturing
Mon - Jun 15 - 09:15 - Industrial Production
Mon - Jun 15 - 10:00 - NAHB Housing Market Index
Tue - Jun 16 - 08:30 - Housing Starts & Building Permits
Wed - Jun 17 - 07:00 - MBA Mortgage Index
Wed - Jun 17 - 10:30 - Crude Oil Inventories
Wed - Jun 17 - 14:00 - FOMC Rate Decision
Thu - Jun 18 - 08:30 - Initial Jobless Claims
Thu - Jun 18 - 08:30 - Consumer Price Index (CPI)
Thu - Jun 18 - 10:00 - Philadelphia Fed
Thu - Jun 18 - 10:00 - Leading Economic Indicators
Thu - Jun 18 - 10:30 - Natural Gas Inventories
Mon - Jun 22 - 10:00 - Existing Home Sales
Tue - Jun 23 - 08:30 - Durable Goods Orders
Tue - Jun 23 - 09:00 - FHFA Housing Price Index
Tue - Jun 23 - 10:00 - New Home Sales
Wed - Jun 24 - 07:00 - MBA Mortgage Index
Wed - Jun 24 - 08:30 - GDP
Wed - Jun 24 - 10:30 - Crude Oil Inventories
Thu - Jun 25 - 08:30 - Initial Jobless Claims
Thu - Jun 25 - 08:30 - Personal Income & Spending
Thu - Jun 25 - 08:30 - PCE Prices
Thu - Jun 25 - 10:30 - Natural Gas Inventories
Fri - Jun 26 - 10:00 - Michigan Sentiment
This commentary is designed to stimulate thinking. This analysis is not a recommendation to buy, sell, hold or sell short any security (stock ETF or otherwise). We all need to think for ourselves when it comes to trading our own accounts. First, it is the only way to really learn. Second, we are the only ones responsible for our decisions. Think of these charts as food for further analysis. Before making a trade, it is important to have a plan. Plan the trade and trade the plan. Among other things, this includes setting a trigger level, a target area and a stop-loss level. It is also important to plan for three possible price movements: advance, decline or sideways. Have a plan for all three scenarios BEFORE making the trade. Consider possible holding times. And finally, look at overall market conditions and sector/industry performance.
