Stocks chopped around again on Wednesday, but managed to hold their early gains and close positive. The S&P 500 surged to 2121 in the first hour, fell back to 2112 around lunchtime and then finished at 2114 for a small gain. The Russell 2000 iShares (IWM) and the S&P SmallCap iShares (IJR) led with 1% gains. Consumer discretionary and finance led the sectors, which is positive. The Retail SPDR (XRT) surged to resistance and is on the verge of a breakout. Facebook (FB) led the Internet ETF (FDN) higher with a flag breakout. The Cyber Security ETF (HACK) surged to a new high. Banks and brokers were also strong with the Broker-Dealer iShares (IAI) and Regional Bank SPDR (KRE) gaining over 1%. Simply put, there are enough pockets of strength to keep the broader market buoyant.
**This chart analysis is for educational purposes only, and should not
be construed as a recommendation to buy, sell or sell-short said securities**
Short-term Overview (Thursday, 4-June-2015):
- Short-term breadth is bearish.
- The equal-weight sectors are mixed: 2 up, 2 down and 1 flat.
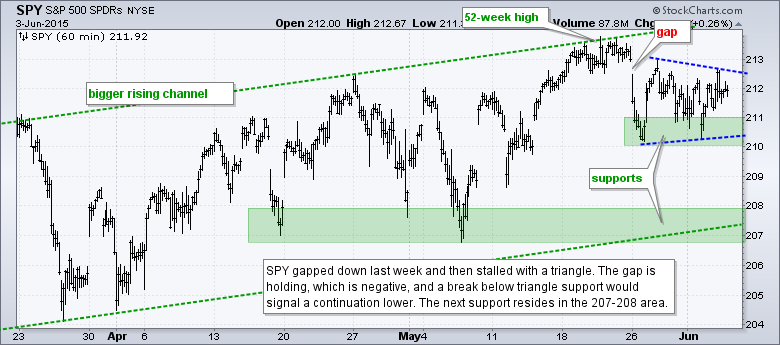
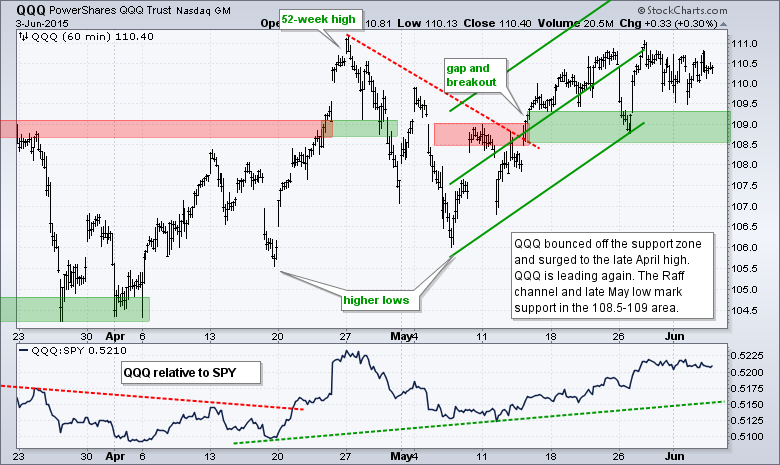
- SPY and QQQ are consolidating above support.
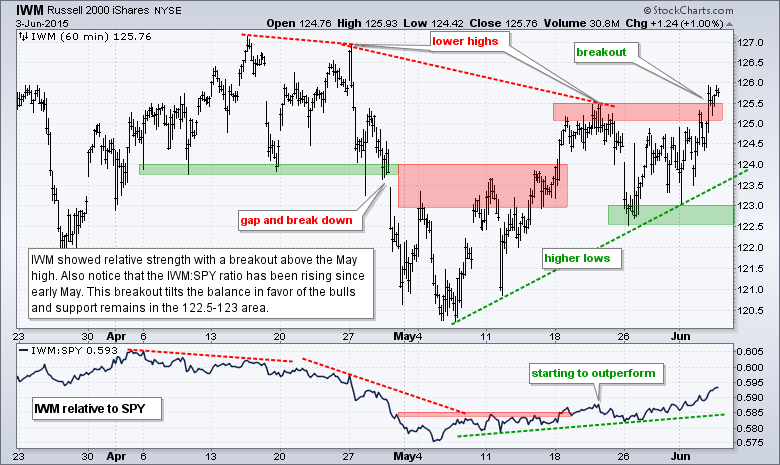
- IWM broke out of its range and shows relative strength.
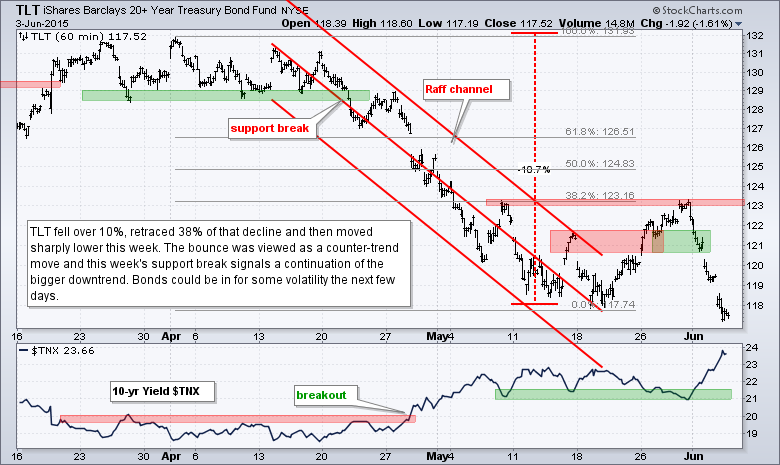
- TLT broke support to reverse the short-term upswing and moved to new lows.
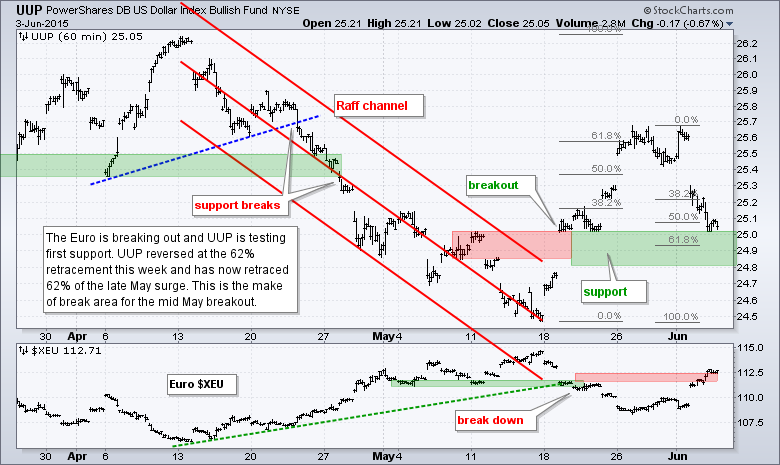
- UUP fell back hard and is now at the make-or-break level.
- USO broke channel resistance to reverse the short-term downtrend, but I am keeping support tight.
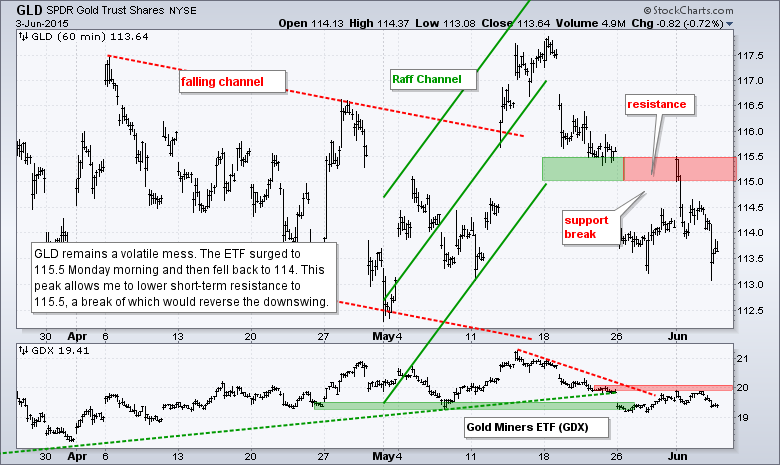
- GLD remains very volatile and the current swing is down.
The Equal-Weight S&P 500 ETF (RSP) moved above 82.5 in early trading, but fell back and closed with a doji candlestick (indecision). Overall, the ETF remains between a rock and a hard place (moment-of-truth). The trend since mid March is up with support in the 81.5-82 area. The swing since last week is down with resistance at 82.5.
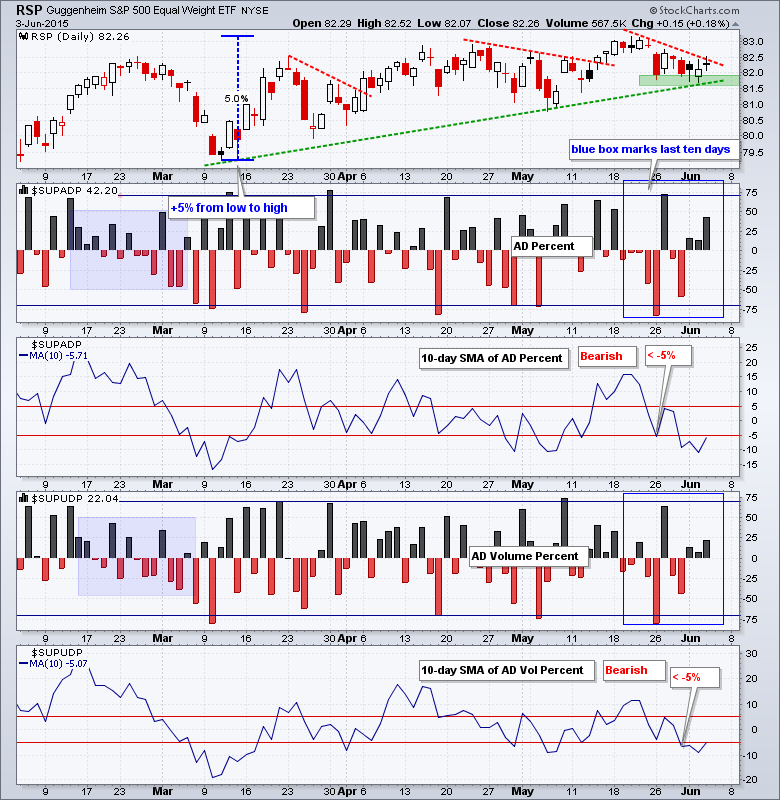
AD Percent finished at a respectable +42% as money moved into small-caps. AD Volume Percent was also positive (+22%), but not as strong because large-caps lagged. Overall, the 10-day SMAs turned bearish last week and will remain bearish until they move above +5%.
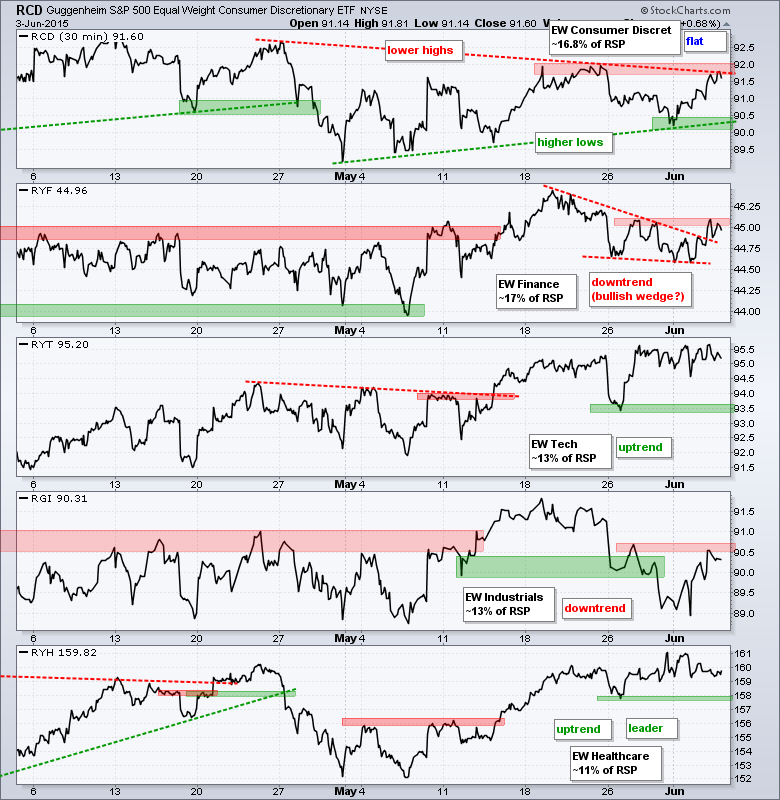
The equal-weight sector ETFs remain mixed. Two are in uptrends (healthcare and tech), two are in downtrends (finance and industrials) and one is flat (consumer discretionary). Actually, one could argue that finance and industrials are also flat. I am watching industrials, finance and consumer discretionary closely. RCD advanced to resistance and a breakout would be bullish. RYF broke the wedge trend line and a follow thru breakout would be bullish. RGI surged off the April-May lows and a breakout would be bullish. These three could tilt the balance back to the bulls.
**************************************************************
**************************************************************
**************************************************************
**************************************************************
**************************************************************
**************************************************************

**************************************************************
***************************************************************
Keep in mind that Friday is a loaded day. We have non-farm payrolls, the deadline for Greece and an OPEC meeting. Probably best just to turn off the market and watch the semi-final between Djokovic and Murray.
Key Reports and Events (all times Eastern):
Thu - Jun 04 - 07:30 - Challenger Job Report
Thu - Jun 04 - 08:30 - Initial Jobless Claims
Thu - Jun 04 - 10:30 - Natural Gas Inventories
Fri - Jun 05 - 08:30 - Employment Report
Fri - Jun 05 - 14:00 - Consumer Credit
Tue - Jun 09 - 10:00 - Wholesale Inventories
Tue - Jun 09 - 10:00 - JOLTS - Job Openings
Wed - Jun 10 - 07:00 - MBA Mortgage Index
Wed - Jun 10 - 10:30 - Crude Oil Inventories
Wed - Jun 10 - 14:00 - Treasury Budget
Thu - Jun 11 - 08:30 - Initial Jobless Claims
Thu - Jun 11 - 08:30 - Retail Sales
Thu - Jun 11 - 10:00 - Business Inventories
Thu - Jun 11 - 10:30 - Natural Gas Inventories
Fri - Jun 12 - 08:30 - Producer Price Index (PPI)
Fri - Jun 12 - 10:00 - Michigan Sentiment
Mon - Jun 15 - 08:30 - Empire State Manufacturing
Mon - Jun 15 - 09:15 - Industrial Production
Mon - Jun 15 - 10:00 - NAHB Housing Market Index
Tue - Jun 16 - 08:30 - Housing Starts & Building Permits
Wed - Jun 17 - 07:00 - MBA Mortgage Index
Wed - Jun 17 - 10:30 - Crude Oil Inventories
Wed - Jun 17 - 14:00 - FOMC Rate Decision
Thu - Jun 18 - 08:30 - Initial Jobless Claims
Thu - Jun 18 - 08:30 - Consumer Price Index (CPI)
Thu - Jun 18 - 10:00 - Philadelphia Fed
Thu - Jun 18 - 10:00 - Leading Economic Indicators
Thu - Jun 18 - 10:30 - Natural Gas Inventories
Mon - Jun 22 - 10:00 - Existing Home Sales
Tue - Jun 23 - 08:30 - Durable Goods Orders
Tue - Jun 23 - 09:00 - FHFA Housing Price Index
Tue - Jun 23 - 10:00 - New Home Sales
Wed - Jun 24 - 07:00 - MBA Mortgage Index
Wed - Jun 24 - 08:30 - GDP
Wed - Jun 24 - 10:30 - Crude Oil Inventories
Thu - Jun 25 - 08:30 - Initial Jobless Claims
Thu - Jun 25 - 08:30 - Personal Income & Spending
Thu - Jun 25 - 08:30 - PCE Prices
Thu - Jun 25 - 10:30 - Natural Gas Inventories
Fri - Jun 26 - 10:00 - Michigan Sentiment
This commentary is designed to stimulate thinking. This analysis is not a recommendation to buy, sell, hold or sell short any security (stock ETF or otherwise). We all need to think for ourselves when it comes to trading our own accounts. First, it is the only way to really learn. Second, we are the only ones responsible for our decisions. Think of these charts as food for further analysis. Before making a trade, it is important to have a plan. Plan the trade and trade the plan. Among other things, this includes setting a trigger level, a target area and a stop-loss level. It is also important to plan for three possible price movements: advance, decline or sideways. Have a plan for all three scenarios BEFORE making the trade. Consider possible holding times. And finally, look at overall market conditions and sector/industry performance.


