Stocks were hit with broad selling pressure as the major index ETFs fell sharply and all sectors moved lower. The declines in the major index ETFs were pretty even with each losing around 2%. DIA held up the best with a 1.95% decline and IJR fared the worst with a 2.31% decline. Utilities held up the best because bonds surge and yields fell. Six of the nine sectors fell over 2%. The Industrials SPDR (XLI), Energy SPDR (XLE) and Utilities SPDR (XLU) fell less than 2%. Commodities were mixed as oil fell over 2% and natural gas gained over 2%. Gold and sugar moved higher, while copper and aluminum edged lower. In fact, I was a bit surprised as how well copper and aluminum held up. Perhaps they already had their bear runs because both are down over 10% from their early May highs.
**This chart analysis is for educational purposes only, and should not
be construed as a recommendation to buy, sell or sell-short said securities**
Short-term Overview (Tuesday, 30-June-2015):
- Short-term Breadth is bearish.
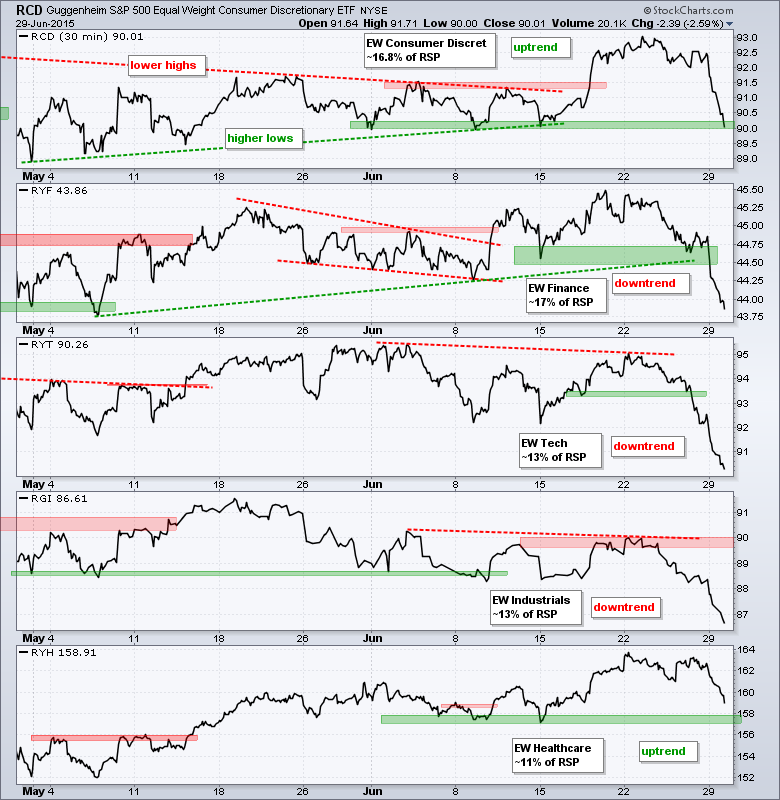
- Three of the five equal-weight sector ETFs are in downtrends.
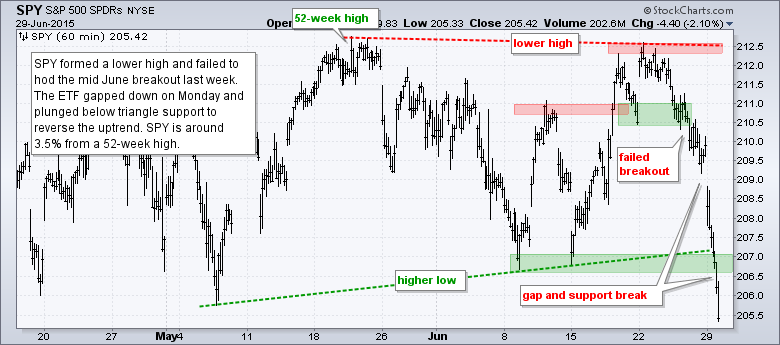
- SPY broke triangle support to fully reverse its short-term uptrend.
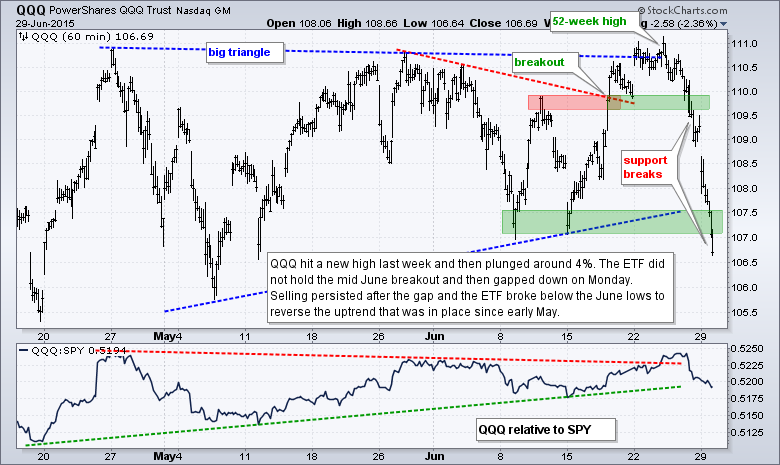
- QQQ hit a new high last week, fell 4% and broke support on Monday.
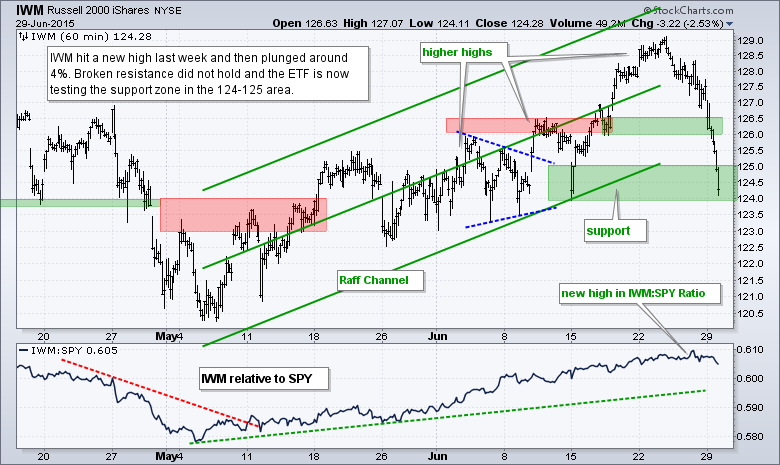
- IWM fell 4%, but remains in an uptrend overall and is testing key support.
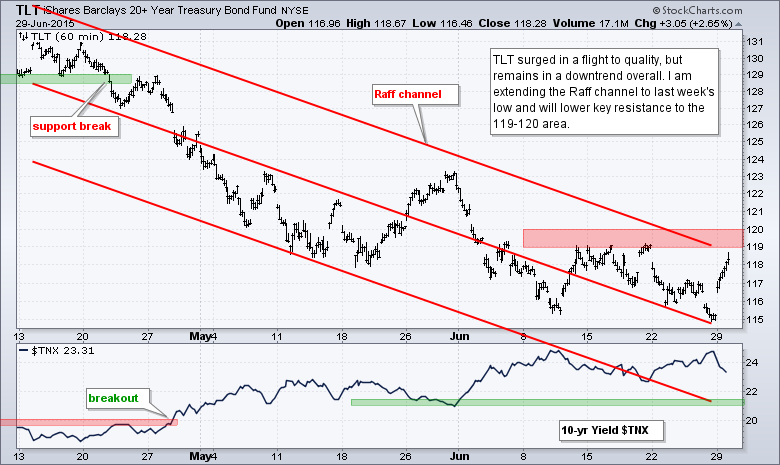
- TLT bounced with a flight to safety, but remains in a downtrend and I lowered resistance.
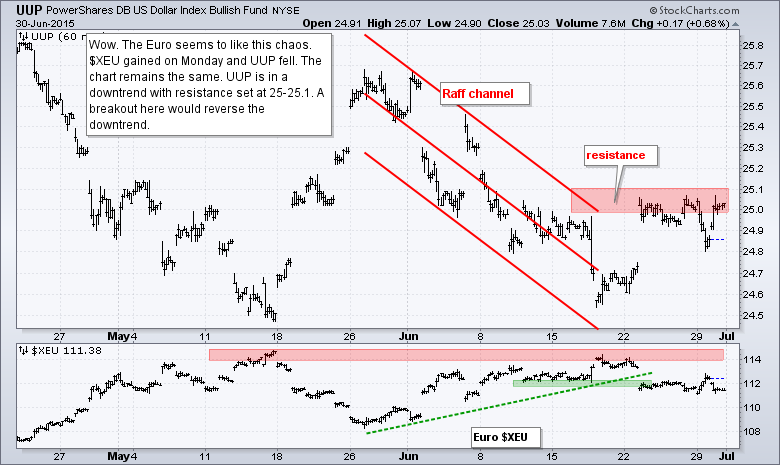
- UUP remains in a short-term downtrend, but is challenging resistance.
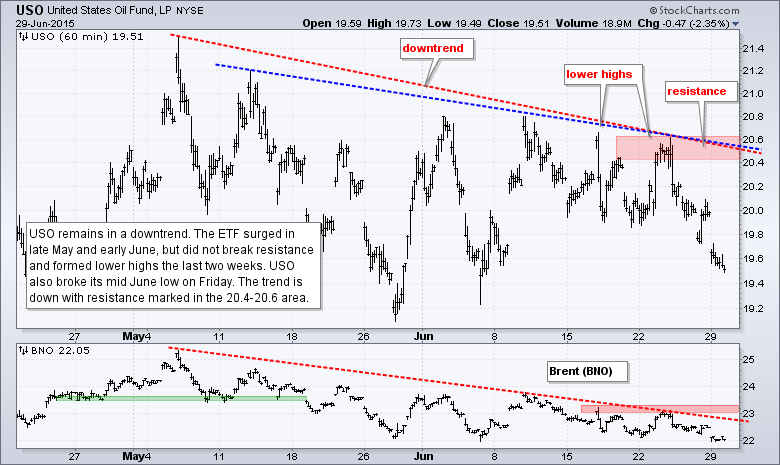
- USO remains in a short-term downtrend.
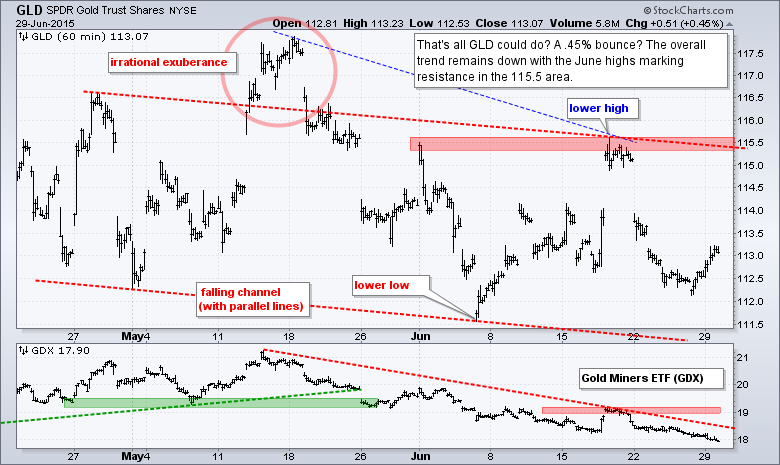
- GLD bounced, but remains in a short-term downtrend.
The Equal-Weight S&P 500 ETF (RSP) failed to hold its breakout last week and plunged on Monday. The ETF opened weak and finished near the low of the day as selling pressure persisted.
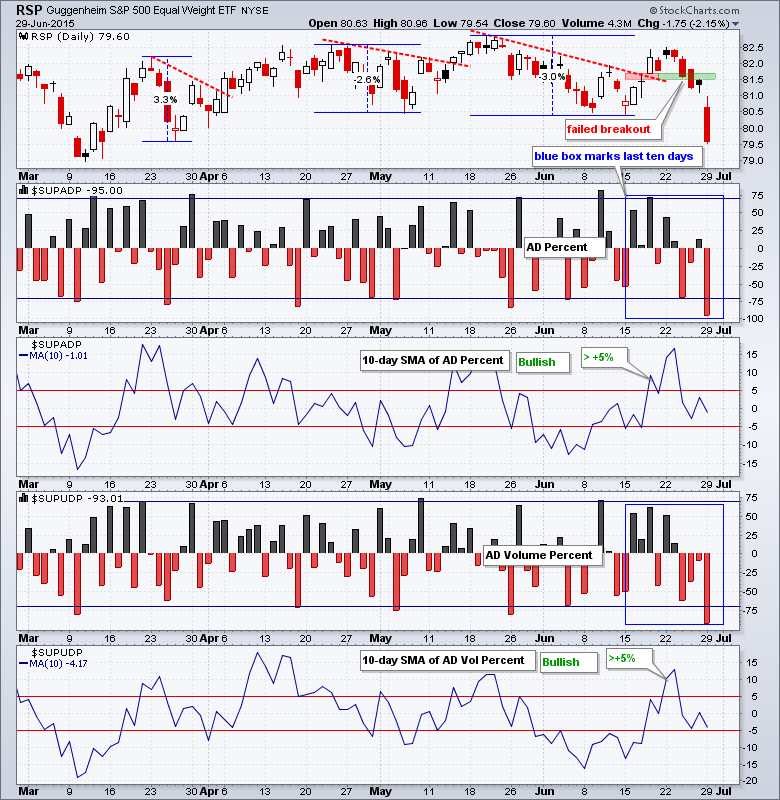
AD Percent finished at its lowest level since February 2014 and AD Volume Percent finished at its lowest level since September 2014. Both exceeded the -90% level for a bearish breadth thrust. The 10-day SMAs for AD Percent and AD Volume Percent did not turn bearish though. Why? Because a fairly big negative day was dropped from the 10-day SMA and a bigger negative day was added. As the histograms show, AD Percent has been positive six of the last ten days and AD Volume Percent has been positive five of the last ten days. All told, the 90+ percent down days are bearish and breadth is short-term bearish.
Three of the four equal-weight sector ETFs are in downtrends. The Equal-weight Finance ETF (RYF) broke down with a move below support. The Equal-weight Technology ETF (RYT) broke below its May low and the Equal-weight Industrials ETF (RGI) exceeded its March lows for a complete break down. The Equal-Weight Consumer Discretionary ETF (RCD) is still in an uptrend and testing support. The Equal-weight Healthcare ETF (RYH) remains in an uptrend and above support.
**************************************************************
**************************************************************
**************************************************************
**************************************************************
**************************************************************
**************************************************************
**************************************************************
***************************************************************
Key Reports and Events (all times Eastern):
Tue - Jun 30 - 09:00 - Case-Shiller 20-city Index
Tue - Jun 30 - 09:45 - Chicago PMI
Tue - Jun 30 - 10:00 - Consumer Confidence
Wed - Jul 01 - 07:00 - MBA Mortgage Index
Wed - Jul 01 - 07:30 - Challenger Job Report
Wed - Jul 01 - 08:15 - ADP Employment Report
Wed - Jul 01 - 10:00 - ISM Manufacturing Index
Wed - Jul 01 - 10:00 - Construction Spending
Wed - Jul 01 - 10:30 - Crude Oil Inventories
Wed - Jul 01 - 17:00 - Auto-Truck Sales
Thu - Jul 02 - 08:30 - Initial Jobless Claims
Thu - Jul 02 - 08:30 - Employment Report
Thu - Jul 02 - 10:00 - Factory Orders
Thu - Jul 02 - 10:30 - Natural Gas Inventories
This commentary is designed to stimulate thinking. This analysis is not a recommendation to buy, sell, hold or sell short any security (stock ETF or otherwise). We all need to think for ourselves when it comes to trading our own accounts. First, it is the only way to really learn. Second, we are the only ones responsible for our decisions. Think of these charts as food for further analysis. Before making a trade, it is important to have a plan. Plan the trade and trade the plan. Among other things, this includes setting a trigger level, a target area and a stop-loss level. It is also important to plan for three possible price movements: advance, decline or sideways. Have a plan for all three scenarios BEFORE making the trade. Consider possible holding times. And finally, look at overall market conditions and sector/industry performance.
