Last week was almost the week that wasn't. There wasn't much change in the major index ETFs and there was no solution for Greece. There were some other significant moves though. The Home Construction iShares (ITB) and the Regional Bank SPDR (KRE) had a good week with 2+ percent gains. Techs were under pressure as the Networking iShares (IGN), Semiconductor SPDR (XSD) and Cyber Security ETF (HACK) fell more than 3%. These three hit new highs in June so I would not read too much into their declines just yet. The main European indices were higher last week, but they gave up these gains with sharp declines on Monday morning. Stocks in Asia closed lower on Monday with the Nikkei 225 ($NIKK) and Hang Seng Composite ($HSI) losing over 2%. The Dow and S&P 500 are set to open sharply lower on Monday. The gap down is not so important. Instead, we need to watch price action after the gap and see what happens when the dust settles. Also keep in mind that trading volumes are light and this can exasperate price moves. And finally, in regards to Greece, it ain't over until it's over. I have no idea how this will pan out, but get ready for more gyrations as the markets brace for Sunday's referendum.
**This chart analysis is for educational purposes only, and should not
be construed as a recommendation to buy, sell or sell-short said securities**
Short-term Overview (Monday, 29-June-2015):
- Short-term Breadth is bullish.
- Three of the five equal-weight sector ETFs are in uptrends.
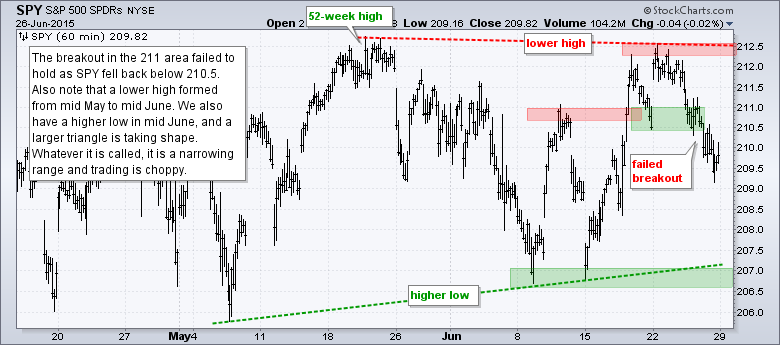
- SPY formed a lower high last week and the swing within the triangle is down.
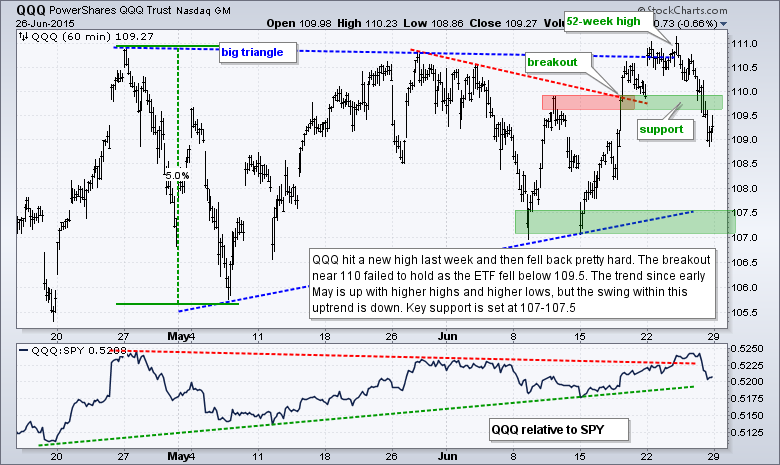
- QQQ hit a new high last week, but fell sharply to reverse the upswing and negate the breakout.
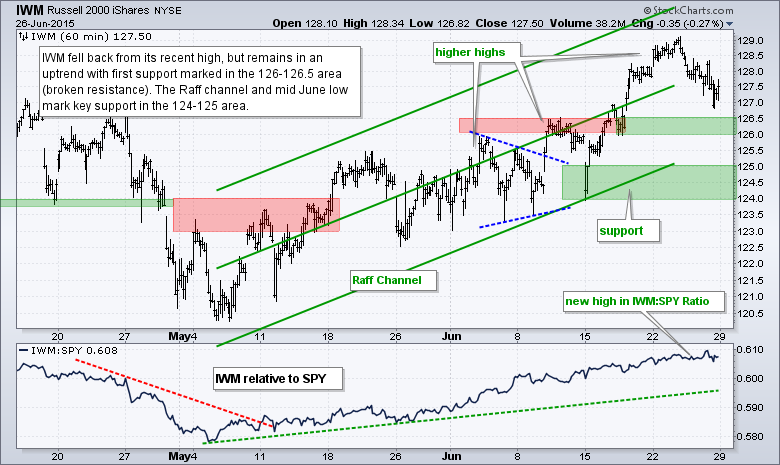
- IWM pulled back the last few days, but remains in an uptrend and shows relative strength.
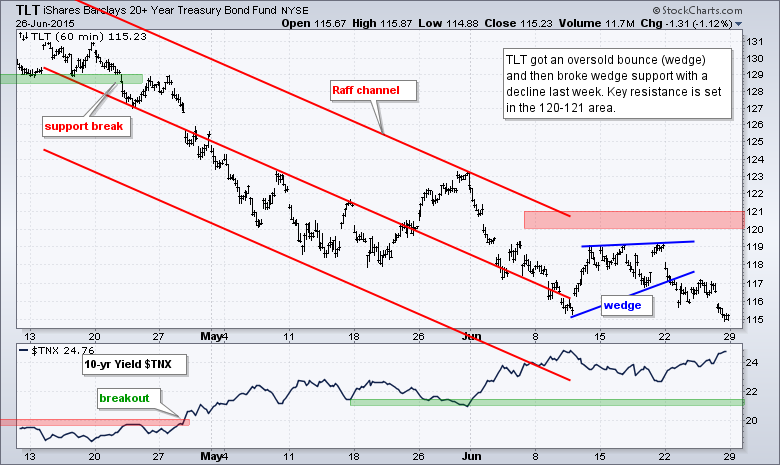
- TLT broke wedge support last week and remains in a downtrend overall.
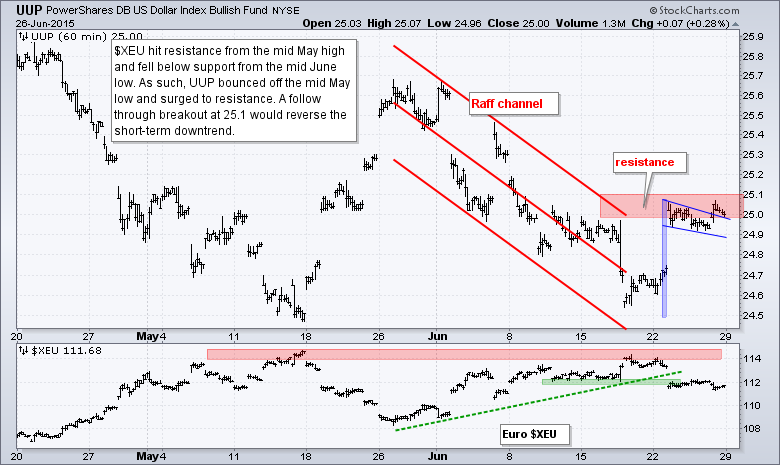
- UUP remains in a short-term downtrend, but is challenging resistance.
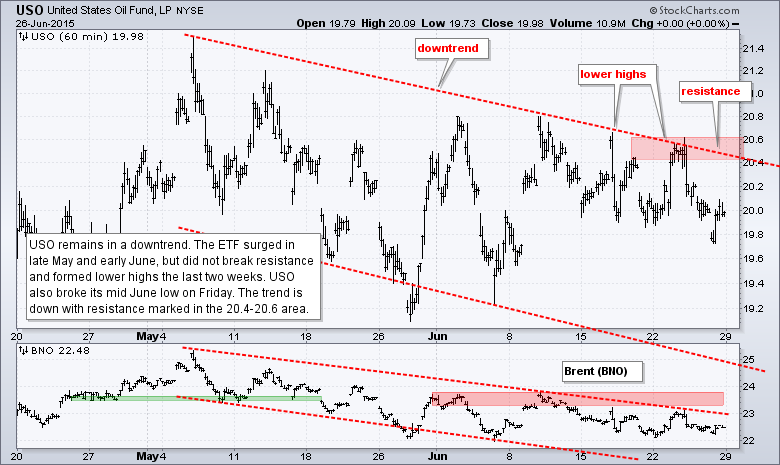
- USO remains in a short-term downtrend.
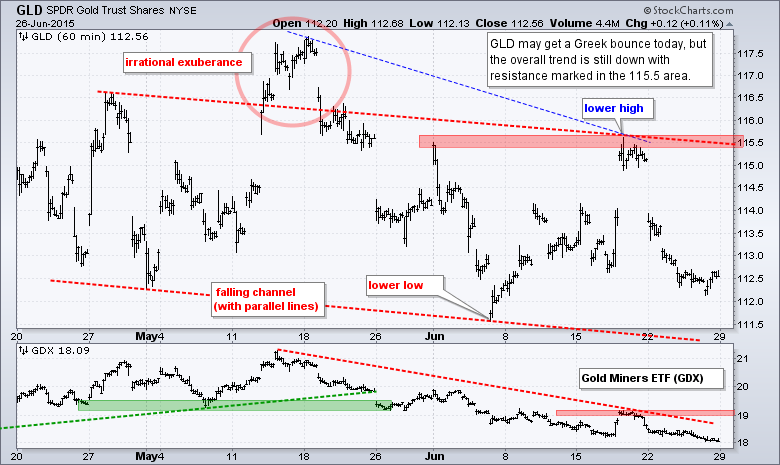
- GLD is a mess.
The Equal-Weight S&P 500 ETF (RSP) moved below the breakout zone on Thursday to negate the breakout at 81.50. The ETF also formed a lower high because it did not exceed the mid May high. Thus, there are two short-term negatives working on this chart right now.
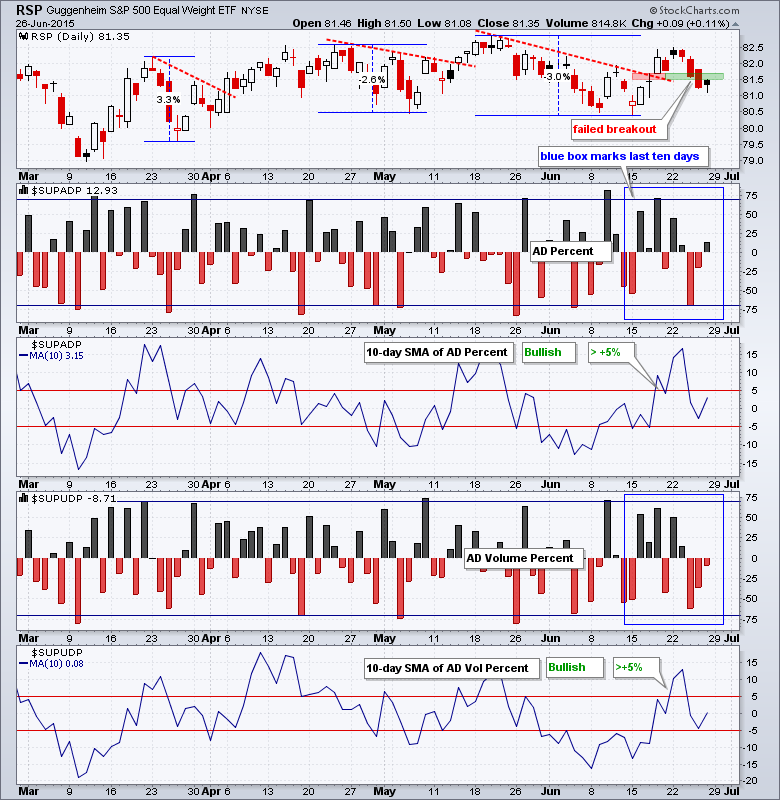
AD Percent and AD Volume Percent were split on Friday. AD Percent was slightly positive and AD Volume Percent was slightly negative. This split reflects some strength in small-caps and some weakness in large-caps. Overall, the 10-day SMAs triggered bullish signals in mid June and these signals have yet to be negated. Both need to move below -5% to show enough selling pressure to be considered bearish.
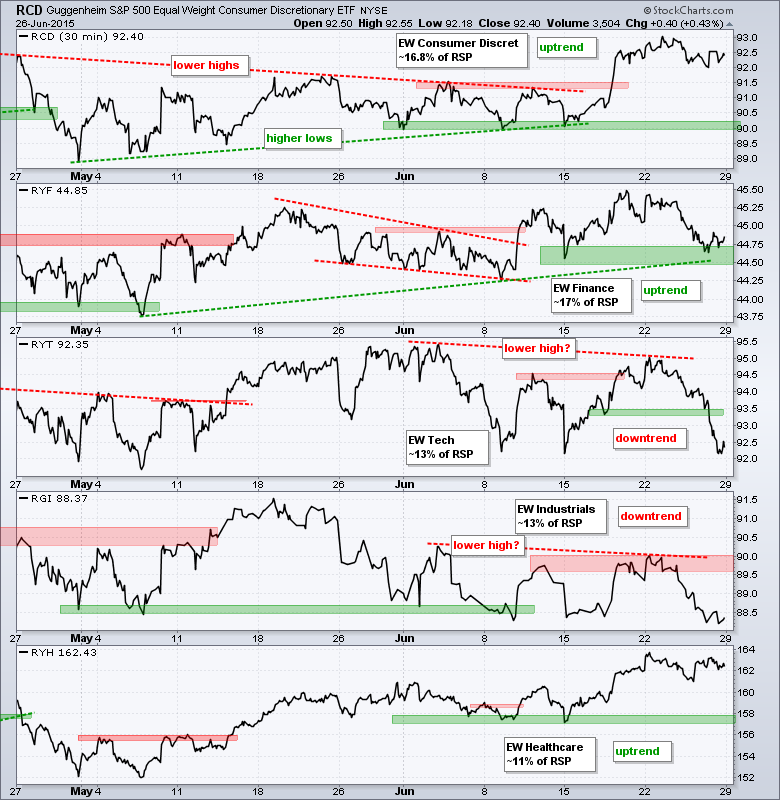
Three of the four equal-weight sector ETFs are in uptrends. The Equal-Weight Consumer Discretionary ETF (RCD) and Equal-weight Healthcare ETF (RYH) are by far the strongest of the five as both hit new highs early last week. The Equal-weight Industrials ETF (RGI) is the weakest because it broke below the May lows. The Equal-weight Technology ETF (RYT) formed a lower high last week and broke down on Friday to turn bearish. The Equal-weight Finance ETF (RYF) is right near support and could break with weakness today.
**************************************************************
**************************************************************
**************************************************************
**************************************************************
**************************************************************
**************************************************************
**************************************************************
***************************************************************
Key Reports and Events (all times Eastern):
Mon - Jun 29 - 10:00 - Pending Home Sales
Tue - Jun 30 - 09:00 - Case-Shiller 20-city Index
Tue - Jun 30 - 09:45 - Chicago PMI
Tue - Jun 30 - 10:00 - Consumer Confidence
Wed - Jul 01 - 07:00 - MBA Mortgage Index
Wed - Jul 01 - 07:30 - Challenger Job Report
Wed - Jul 01 - 08:15 - ADP Employment Report
Wed - Jul 01 - 10:00 - ISM Manufacturing Index
Wed - Jul 01 - 10:00 - Construction Spending
Wed - Jul 01 - 10:30 - Crude Oil Inventories
Wed - Jul 01 - 17:00 - Auto-Truck Sales
Thu - Jul 02 - 08:30 - Initial Jobless Claims
Thu - Jul 02 - 08:30 - Employment Report
Thu - Jul 02 - 10:00 - Factory Orders
Thu - Jul 02 - 10:30 - Natural Gas Inventories
This commentary is designed to stimulate thinking. This analysis is not a recommendation to buy, sell, hold or sell short any security (stock ETF or otherwise). We all need to think for ourselves when it comes to trading our own accounts. First, it is the only way to really learn. Second, we are the only ones responsible for our decisions. Think of these charts as food for further analysis. Before making a trade, it is important to have a plan. Plan the trade and trade the plan. Among other things, this includes setting a trigger level, a target area and a stop-loss level. It is also important to plan for three possible price movements: advance, decline or sideways. Have a plan for all three scenarios BEFORE making the trade. Consider possible holding times. And finally, look at overall market conditions and sector/industry performance.


