The S&P 500 surged on Monday morning with a move from 2110 to 2130. That was it for the buying pressure. The index peaked late Morning on Monday and fell the next three and a half days. $SPX closed near 2102.5 on Thursday and is down slightly for the week. Most sectors were under some selling pressure with energy, utilities and industrials leading the way lower. The healthcare sector bucked the trend as HMOs and hospitals surged. The Home Construction iShares (ITB) also held up well and advanced a fraction. Commodity related stocks were hit again as the Metals & Mining SPDR (XME) fell 1.5% and neared a new low. The Steel ETF (SLX) was also hit and the Copper Miners ETF (COPX) gave up Wednesday's gain.
**This chart analysis is for educational purposes only, and should not
be construed as a recommendation to buy, sell or sell-short said securities**
Short-term Overview (Friday, 26-June-2015):
- Short-term Breadth is bullish.
- Four of the five equal-weight sector ETFs are in uptrends.
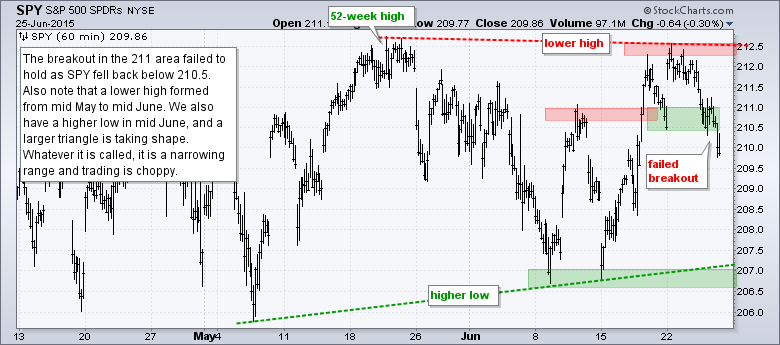
- SPY failed to hold last week's breakout and is forming a triangle overall.
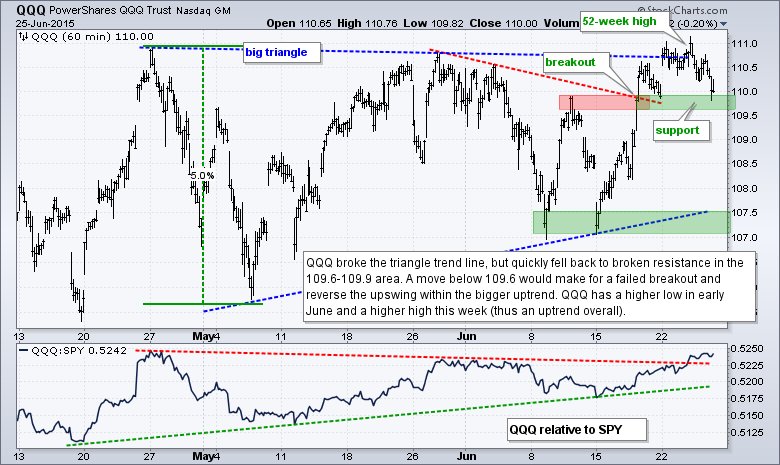
- QQQ hit a new high and then fell back to test last week's breakout.
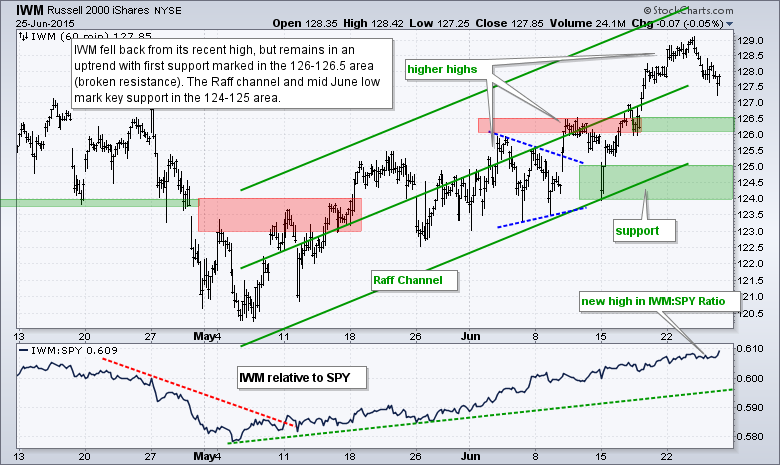
- IWM pulled back the last few days, but remains in an uptrend and shows relative strength.
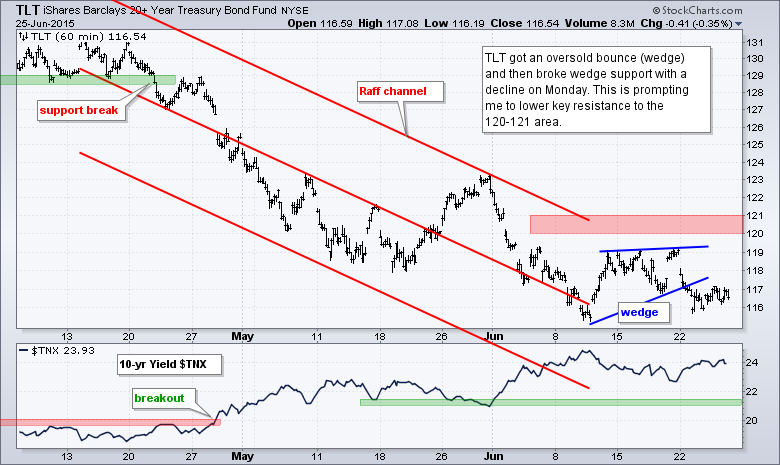
- TLT got an oversold bounce and fell back on Monday so I lowered key resistance.
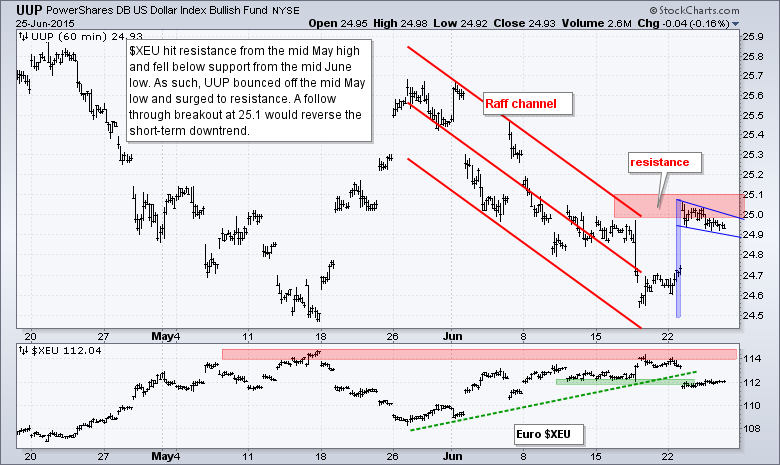
- UUP remains in a short-term downtrend, but is challenging resistance.
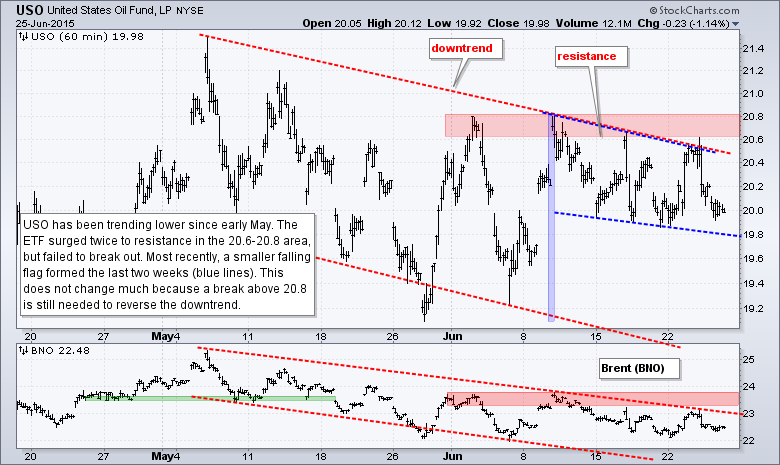
- USO remains in a short-term downtrend with a small flag taking shape.
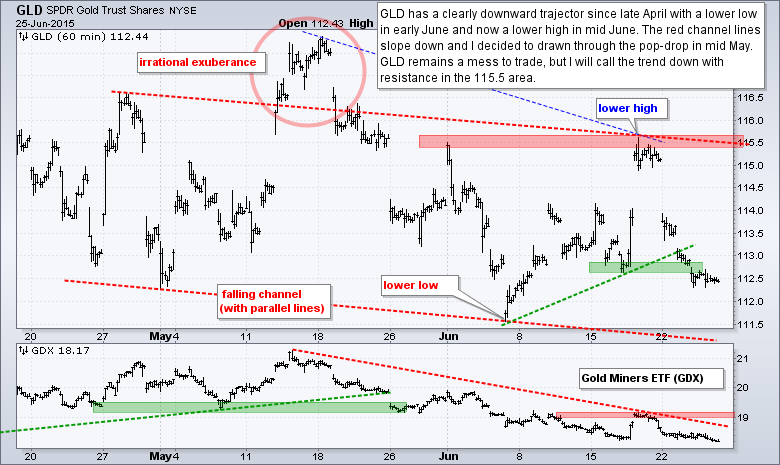
- GLD broke upswing support and I drew a falling channel to define the overall downtrend.
The Equal-Weight S&P 500 ETF (RSP) opened with a small bounce, but selling pressure took hold and pushed the ETF below support by the close. The breakout has failed. Overall, the ETF has crossed the 81.5 level a dozen times since mid March. Trading the swings since mid March has been tough because there has been little overall direction.
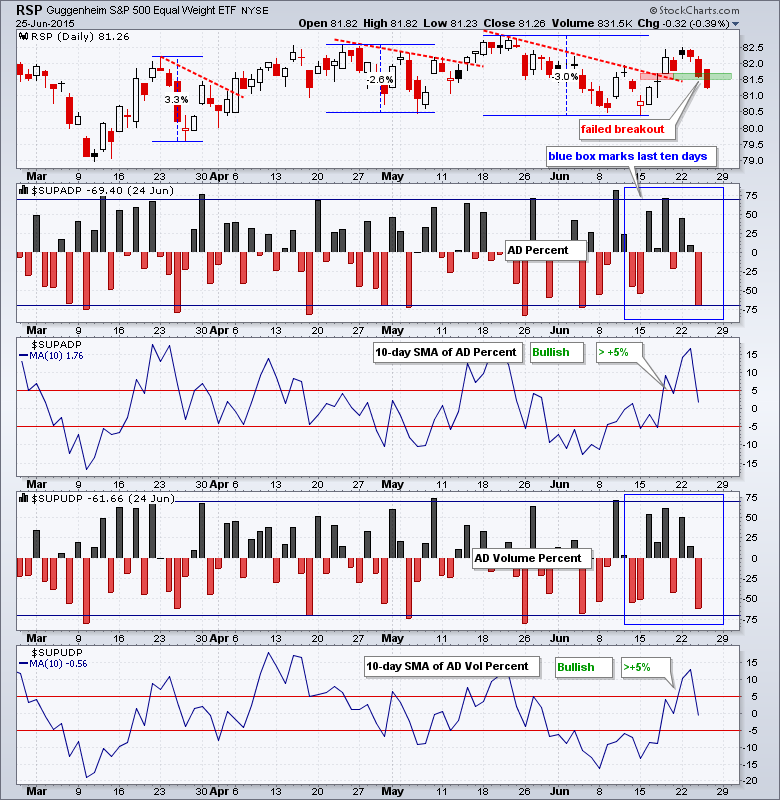
Due to technical issues, the breadth indicators did not update yesterday. They will be updated on Friday at some point. It is safe to say that AD Percent and AD Volume Percent finished in negative territory and most likely below -60%. The 10-day SMA for AD Percent is probably still above -5%, but the 10-day SMA of AD Volume Percent may have broken below -5%.
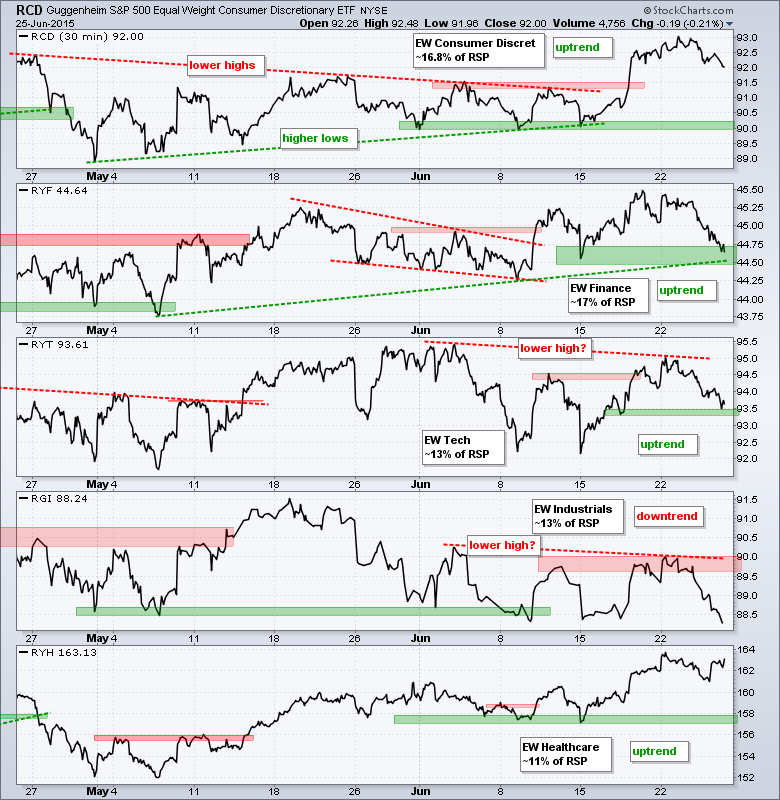
Four of the top five sector ETFs are in uptrends with two testing uptrend support now. The Equal-weight Finance ETF (RYF) and Equal-weight Technology ETF (RYT) fell this week and are testing uptrend support. RYT formed a lower high. The Equal-Weight Consumer Discretionary ETF (RCD) also fell back, but remains strong overall. The Equal-weight Healthcare ETF (RYH) bounced on Thursday and is the strongest of the five. The Equal-weight Industrials ETF (RGI) broke support and is the weakest of the five, by far.
**************************************************************
**************************************************************
**************************************************************
**************************************************************
**************************************************************
**************************************************************
**************************************************************
***************************************************************
Key Reports and Events (all times Eastern):
Tue - Jun 23 - 08:30 - Durable Goods Orders
Tue - Jun 23 - 09:00 - FHFA Housing Price Index
Tue - Jun 23 - 10:00 - New Home Sales
Wed - Jun 24 - 08:00 - EU Summit
Wed - Jun 24 - 07:00 - MBA Mortgage Index
Wed - Jun 24 - 08:30 - GDP
Wed - Jun 24 - 10:30 - Crude Oil Inventories
Thu - Jun 25 - 08:00 - EU Summit
Thu - Jun 25 - 08:30 - Initial Jobless Claims
Thu - Jun 25 - 08:30 - Personal Income & Spending
Thu - Jun 25 - 08:30 - PCE Prices
Thu - Jun 25 - 10:30 - Natural Gas Inventories
Fri - Jun 26 - 10:00 - Michigan Sentiment
This commentary is designed to stimulate thinking. This analysis is not a recommendation to buy, sell, hold or sell short any security (stock ETF or otherwise). We all need to think for ourselves when it comes to trading our own accounts. First, it is the only way to really learn. Second, we are the only ones responsible for our decisions. Think of these charts as food for further analysis. Before making a trade, it is important to have a plan. Plan the trade and trade the plan. Among other things, this includes setting a trigger level, a target area and a stop-loss level. It is also important to plan for three possible price movements: advance, decline or sideways. Have a plan for all three scenarios BEFORE making the trade. Consider possible holding times. And finally, look at overall market conditions and sector/industry performance.


