Stocks opened weak and closed with with the S&P 500 losing around .74% on the day. Selling pressure was contained, but across the board as all sectors declined and most industry-group ETFs lost ground. The Materials SPDR (XLB) led the sectors lower with a 1.27% decline. It is really an ETF and stock pickers' market. Note that the Global Auto ETF (CARZ) fell over 1.30% as GM plunged after a downgrade from Goldman. Ford (F), however, surged as Goldman upgraded the rival. The Home Construction iShares (ITB) remained strong with a .88% gain, but the Retail SPDR (XRT) weakened with a .83% loss. The Metals & Mining SPDR (XME) fell around 1% with weakness in steel stocks, but the Copper Miners ETF (COPX) surged 1.59% on the day. Biotechs finally took a breather as the Biotech SPDR (XBI) fell over 2%. The ETF, however, is still about 3% from an all time high.
**This chart analysis is for educational purposes only, and should not
be construed as a recommendation to buy, sell orsell-short said securities**
Short-term Overview (Thursday, 25-June-2015):
- Short-term Breadth is bullish.
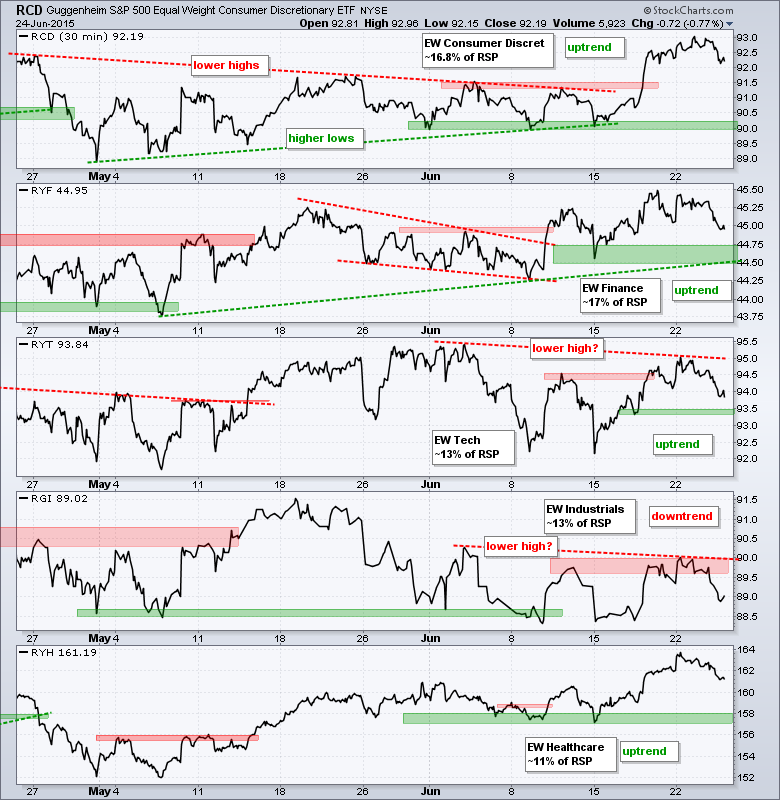
- Four of the five equal-weight sector ETFs are in uptrends.
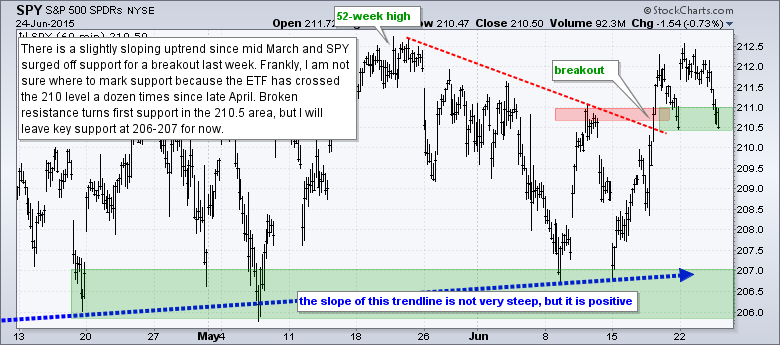
- SPY broke resistance to reverse the short-term downswing last week.
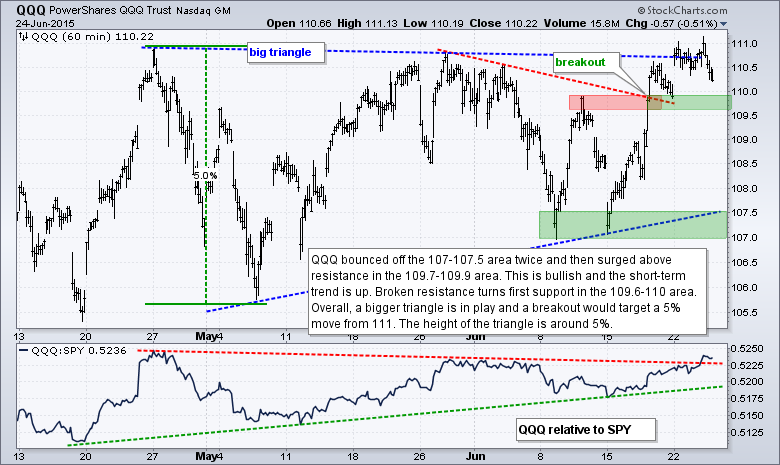
- QQQ bounced off triangle support and broke above resistance last week.
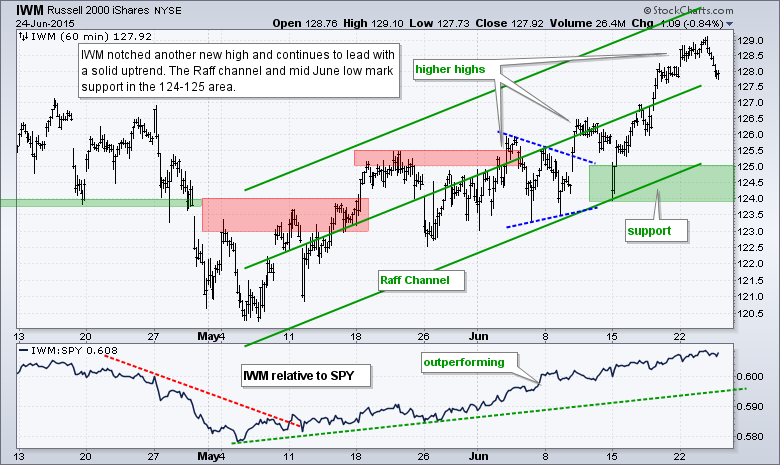
- IWM hit a new high for the move and remains in a short-term uptrend.
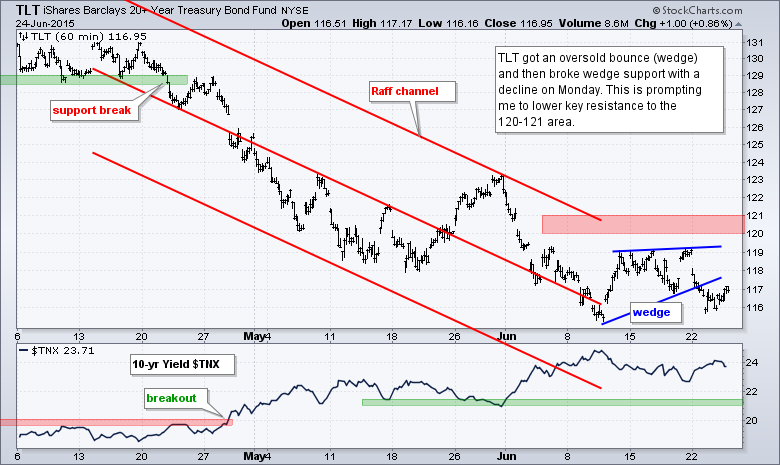
- TLT got an oversold bounce and fell back on Monday so I lowered key resistance.
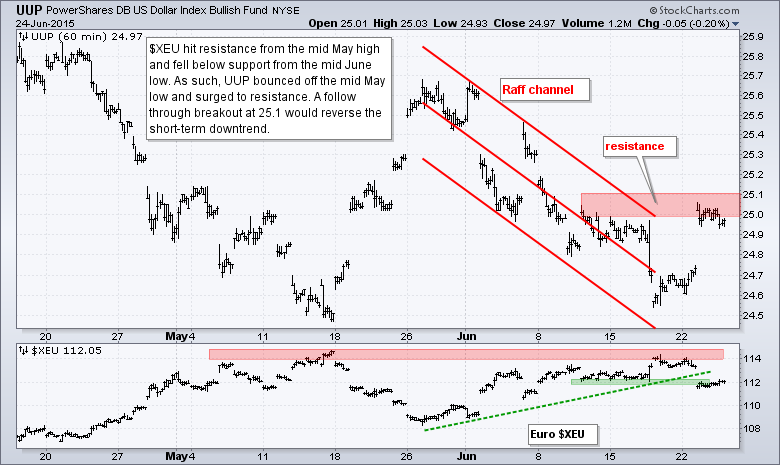
- UUP remains in a short-term downtrend, but is challenging resistance.
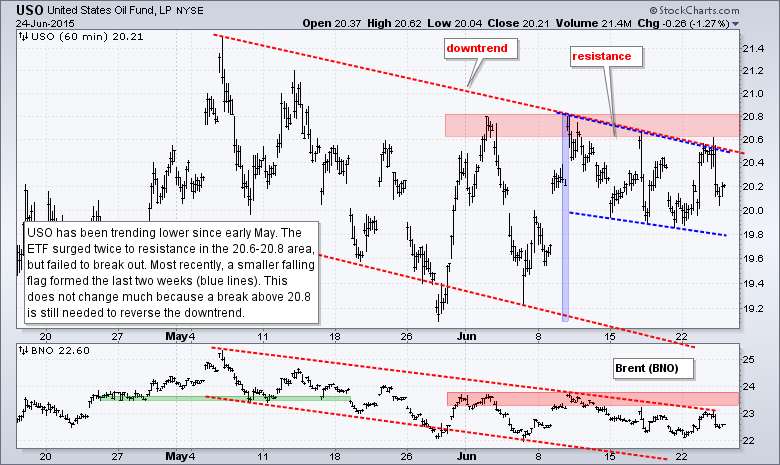
- USO remains in a short-term downtrend with a small flag taking shape.
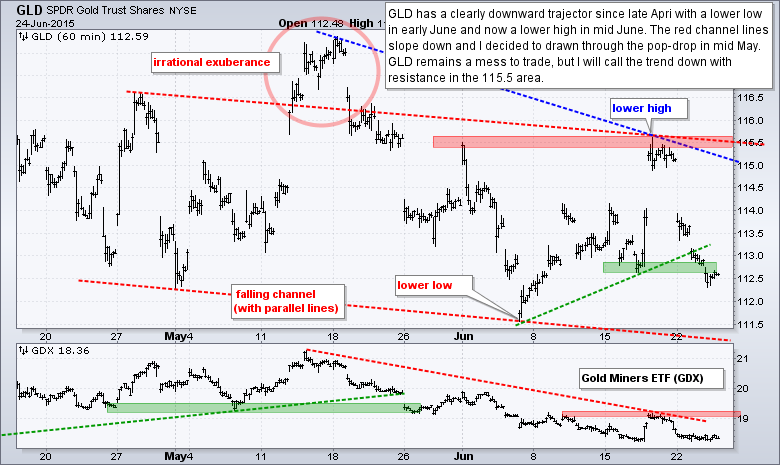
- GLD broke upswing support and I drew a falling channel to define the overall downtrend.
The Equal-Weight S&P 500 ETF (RSP) opened weak and closed weak to form a long filled red candlestick. The ETF closed at the support zone marked by broken resistance. Further weakness with a close below 81.5 would negate the breakout and call for a reassessment of the breakout.
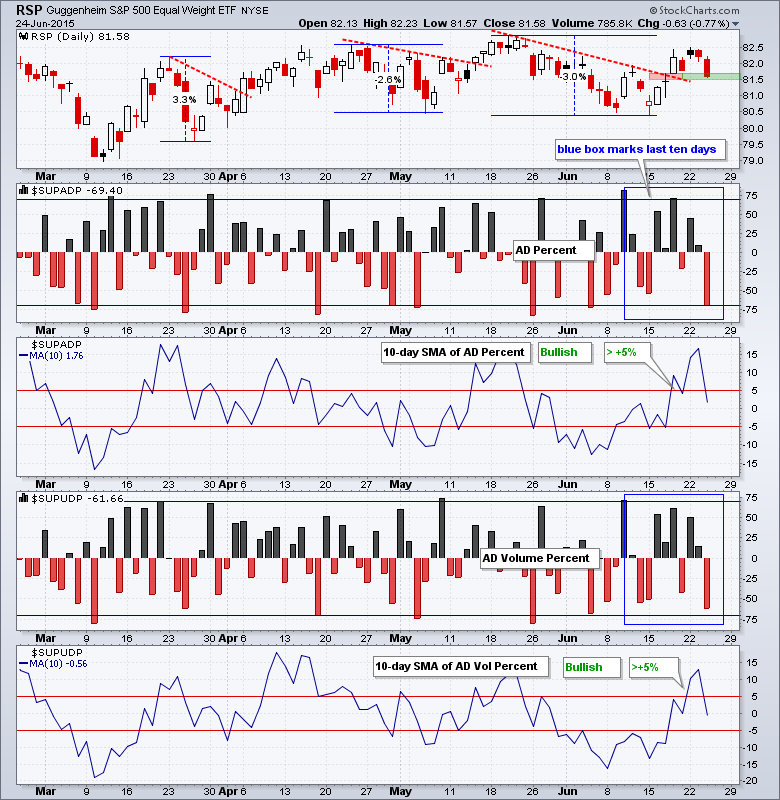
AD Percent and AD Volume Percent finished below -60%, which showed the most selling pressure since June 4th. Breadth was improving, but this steep decline could be a short-term warning. The 10-day SMAs for AD Percent and AD Volume Percent turned bullish, but the 10-day SMA for AD Volume Percent is already in negative territory. Further weakness below -5% would put it back in the bearish camp.
Four of the top five sector ETFs are in uptrends. The Equal-Weight Consumer Discretionary ETF (RCD), Equal-weight Finance ETF (RYF) and Equal-weight Healthcare ETF (RYH) moved above their May highs and are in clear uptrends. The Equal-weight Industrials ETF (RGI) and Equal-weight Technology ETF (RYT) did not exceed their early June highs and could be forming lower highs. RGI is clearly the weakest of the five and in a short-term downtrend.
**************************************************************
**************************************************************
**************************************************************
**************************************************************
**************************************************************
**************************************************************
**************************************************************
***************************************************************
Key Reports and Events (all times Eastern):
Tue - Jun 23 - 08:30 - Durable Goods Orders
Tue - Jun 23 - 09:00 - FHFA Housing Price Index
Tue - Jun 23 - 10:00 - New Home Sales
Wed - Jun 24 - 08:00 - EU Summit
Wed - Jun 24 - 07:00 - MBA Mortgage Index
Wed - Jun 24 - 08:30 - GDP
Wed - Jun 24 - 10:30 - Crude Oil Inventories
Thu - Jun 25 - 08:00 - EU Summit
Thu - Jun 25 - 08:30 - Initial Jobless Claims
Thu - Jun 25 - 08:30 - Personal Income & Spending
Thu - Jun 25 - 08:30 - PCE Prices
Thu - Jun 25 - 10:30 - Natural Gas Inventories
Fri - Jun 26 - 10:00 - Michigan Sentiment
This commentary is designed to stimulate thinking. This analysis is not a recommendation to buy, sell, hold or sell short any security (stock ETF or otherwise). We all need to think for ourselves when it comes to trading our own accounts. First, it is the only way to really learn. Second, we are the only ones responsible for our decisions. Think of these charts as food for further analysis. Before making a trade, it is important to have a plan. Plan the trade and trade the plan. Among other things, this includes setting a trigger level, a target area and a stop-loss level. It is also important to plan for three possible price movements: advance, decline or sideways. Have a plan for all three scenarios BEFORE making the trade. Consider possible holding times. And finally, look at overall market conditions and sector/industry performance.


