Index Table Turns Deep Red
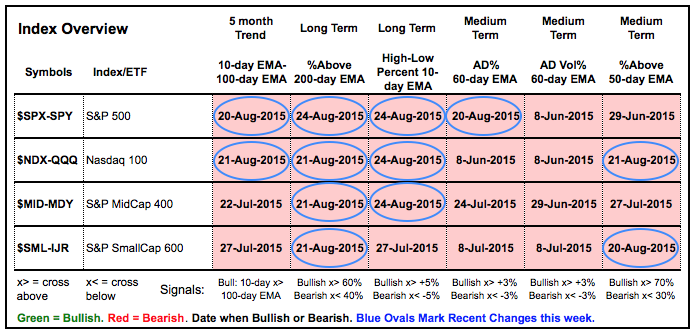
The charts and commentary are part of Tuesday's webinar. Click here for the recording. Unsurprisingly, the breadth-trend table has turned decidedly bearish over the last few days. The blue ovals mark the breadth indicators that turned bearish this past week. Last Tuesday, this table was evenly split with 12 bullish and 12 bearish. The S&P Small-Cap 600 and S&P MidCap 400 were net bearish, while the S&P 500 and Nasdaq 100 were net bullish. With an exceptionally sharp and broad decline the last five days, the 12 bullish indicators flipped to bearish. As a trend-follower by nature, I have no idea how long this table will remain bearish. I will simply adhere to the message and trade accordingly.
What a Difference a Day Makes
The headline is the title of a classic song from jazz singer Dinah Washington - and it can be found on Youtube. Relaxing songs like these are good when the markets are going haywire. I prefer to use bar and candlestick charts, but Monday's big spike low skewed some of the charts so I am using closing values when necessary.
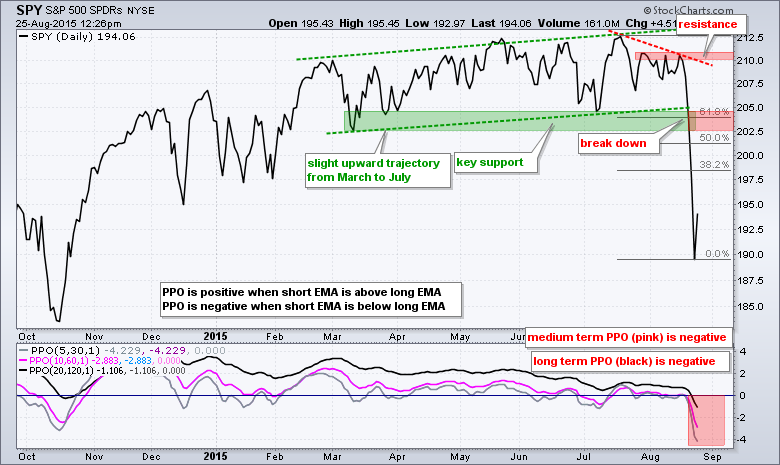
Stocks are rebounding on Tuesday, but this is clearly not enough to negate the breakdowns we saw over the last five days. SPY broke down with a 10% decline the last five days, which is a bit excessive. The stock market is getting a big bounce today, but this is not enough to undo the technical damage or negate the break downs. Broken support turns first resistance in the 202.5-205 area. Also notice that the 62% retracement resides around 204.
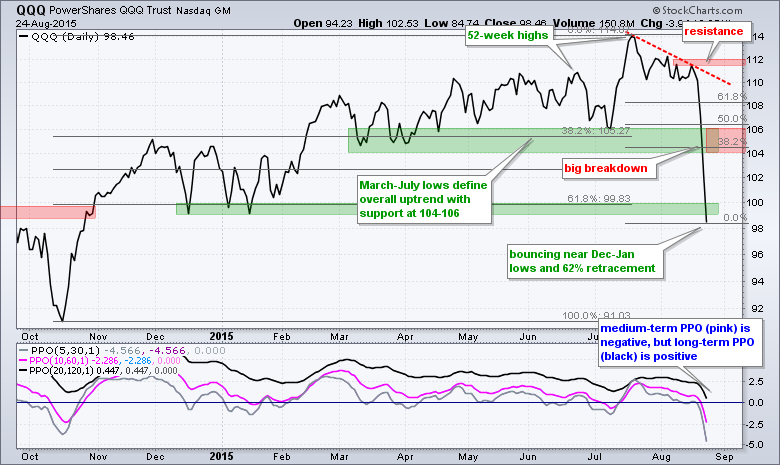
QQQ broke down with a plunge below 105 and this broken support zone turns first resistance to watch on a throwback. Also notice that a 38-50% retracement resides in this area.
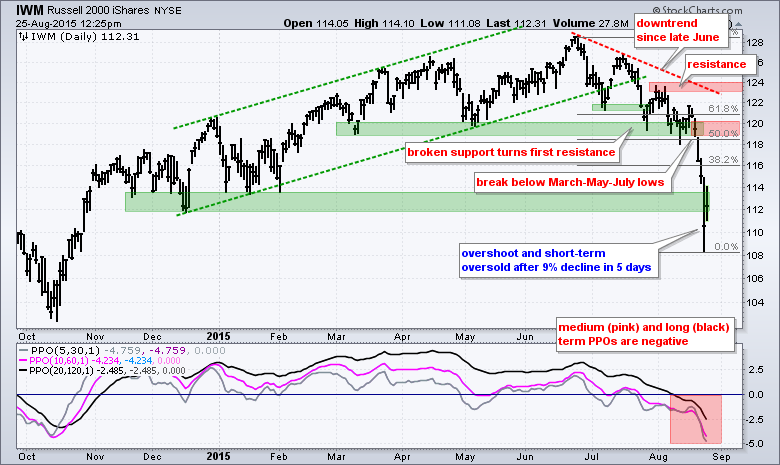
IWM has been trending lower since late June and the ETF broke the March-July lows with a 9% high-low decline the last five days. Wow. It is a bit extreme and the ETF is short-term oversold so a bounce is perfectly normal at this stage. Broken support turns first resistance in the 119-120 area. Also note that a 50-62% retracement of the two month decline would extend to the 119-120 area.
Sector Table Turns Majority Red
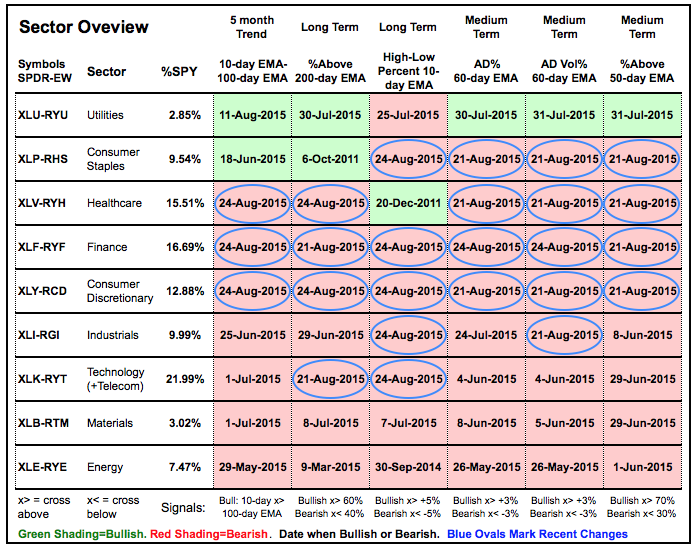
The sector table still favored the bulls last Tuesday because 21 boxes were bearish (red) and 33 were still bullish (green). In addition, five sectors were still bullish and these five represented the majority of the stock market (S&P 500). Technology, industrials, materials and energy were bearish and these four represent about 40% of the S&P 500. The table flipped over the last five trading days as 25 indicators flipped from bullish to bearish. Note that six sectors are completely bearish. Healthcare has one green box. The Consumer staples has two greens and utilities is leading with five green boxes. Notice that the three defensive sectors held up the best during this rout.
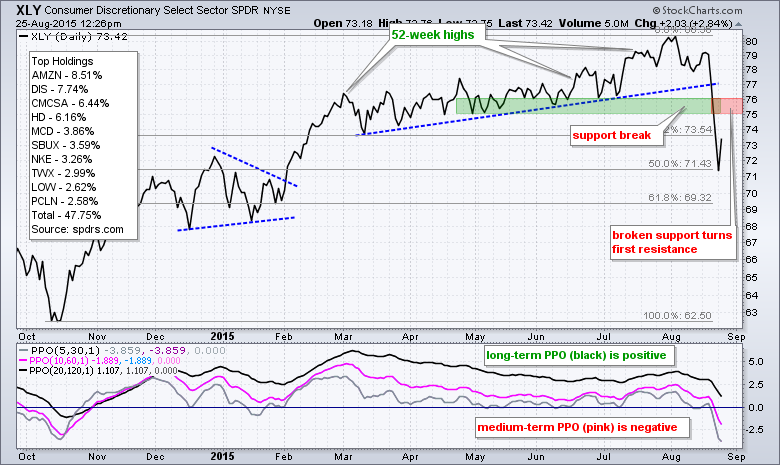
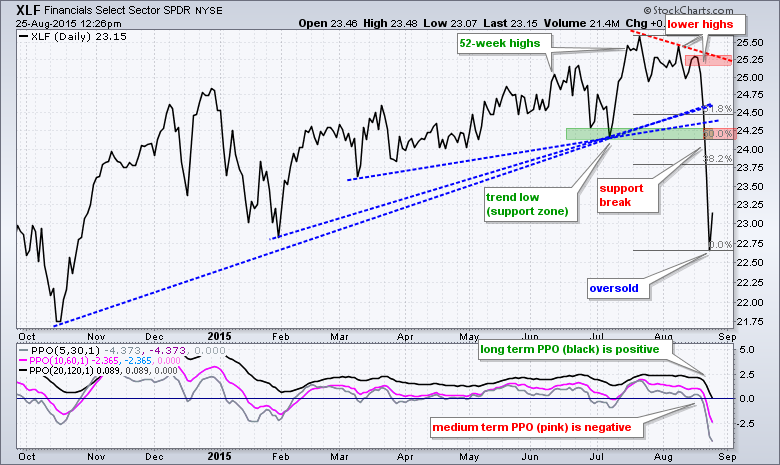
First Resistance for Tech, Discretionary and Finance SPDRs
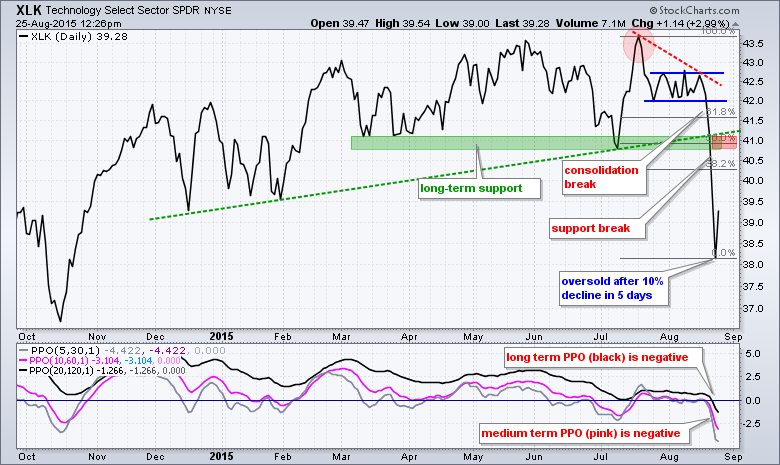
The next charts show some key sector SPDRs. Note that I will cover all nine sector SPDRs in the webinar. The first thing to note is that important support levels were broken with the sharp decline over the last two weeks. Second, the SPDRs are short-term oversold after sharp declines the last five days. I am using the Fibonacci Retracements Tool and broken support levels to mark first resistance. Note that this is not KEY resistance. In other words, a move back above broken support would not be enough to call for a trend reversal. The broken supports and Fiboancci retracements give us an idea of what to expect with an oversold bounce.
Utilities Take the Lead (for Now)
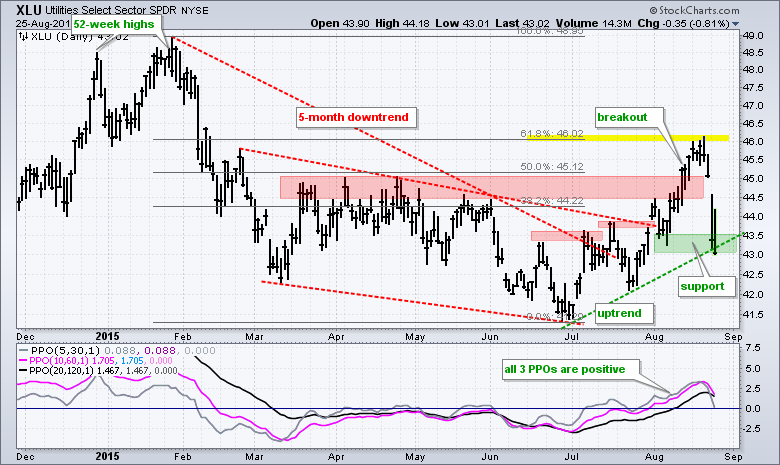
The Utilities SPDR (XLU) is the strongest of the nine sector SPDRs right now, but I am concerned that this could change. First, it has the SCTR of the 18 sector ETFs (9 SPDRs and 9 equal-weight sector ETFs). Second, it is the only one that is still above its June low. Third, it is the only sector with a positive long-term PPO (20,120,1) and a positive medium-term PPO (10,60,1). On the price chart, XLU plunged to support in the 43-43.5 area on Monday and then bounced on Tuesday. 43 is now the level to watch. A close below this level would put XLU back on the bearish track.
REITs Break Down
As noted in the Market Messages over the last few days, the uptrend in the broader market reversed last week and the broad market trend is now down. Even though we have not hit the 20% threshold that technically qualifies as a "bear" market, the weight of the evidence is bearish and this is reason enough for a defensive posture. Nobody really knows how far this downtrend will extend, what path it will take or how long it will last. As far as I am concerned, the best we can do is simply focus on the right side of the chart and wait for evidence of a trend reversal (new uptrend).
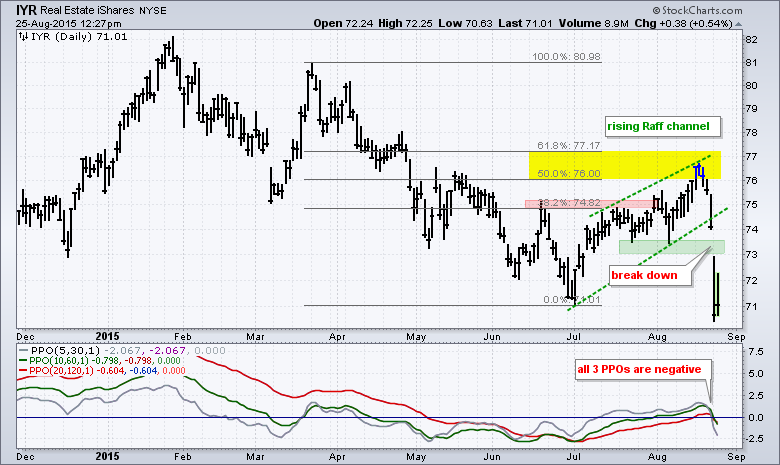
A downtrend for the broader market is important because this suggests that the vast majority of stocks are under selling pressure or will ultimately come under selling pressure. Estimates suggest that some 80% of all stocks decline in a bear market. Put another way, 20% or less than 20% of stocks will buck the broad market trend. This means the odds do not favor bullish stock picks. I am bringing this to attention because it means utility stocks could ultimately fail, just as REITs did. Chart XX shows the REIT iShares (IYR) breaking out in late July and trending higher into mid August. The ETF ultimately hit resistance in the 50-62% retracement zone and broke down over the last few days. Monday's low is a new 52-week low.
Panic is no Reason to Panic
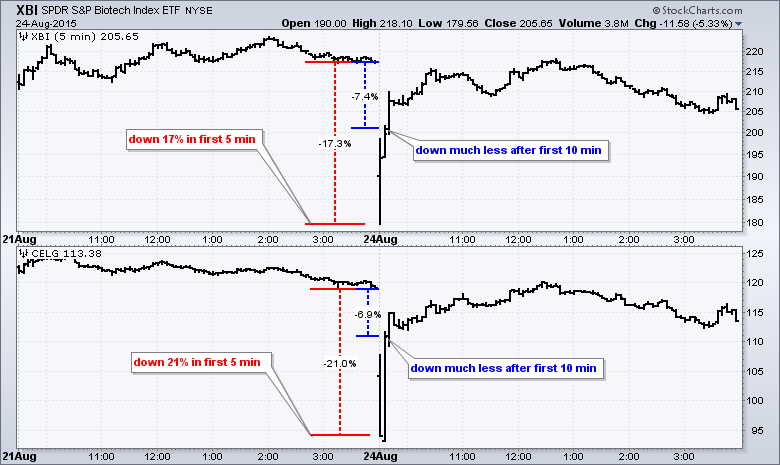
I imagine there will be some investigations into some of the intraday lows in various stocks and ETFs. CNN reports that trading in stocks and ETFs was automatically halted more than 1200 times. The chart below shows an example with the Biotech SPDR (XBI) and Celgene. Both fell double digits in the first 5 minutes of trading, but recouped much of this loss in the next 5 minutes. Both were still down sharply after 10 minutes of trading, but the spike lows should be a concern to all traders and investors. Imagine getting a sell order fill at 180 on XBI or 95 on Celgene. Two items to keep in mind here. First, always use limit orders (do not use market orders). Second, this was clearly a panic reaction and it rarely pays to sell into a panic. Regardless of what happens in China, Celgene's business model did not undergo a 20% adjustment in the first 5 minutes of trading.
Other Webinar Symbols and Topics
- ETFs: GDX, IBB, XBI, IHF, AGG, TLT, $TNX, GLD
- Using the PPOs for Trend Identification and Trading Signals
- Scanning Using the PPOs
- Click here for the recording.
----------------------------------------
Thanks for Tuning in and have a great day!
--Arthur Hill CMT

