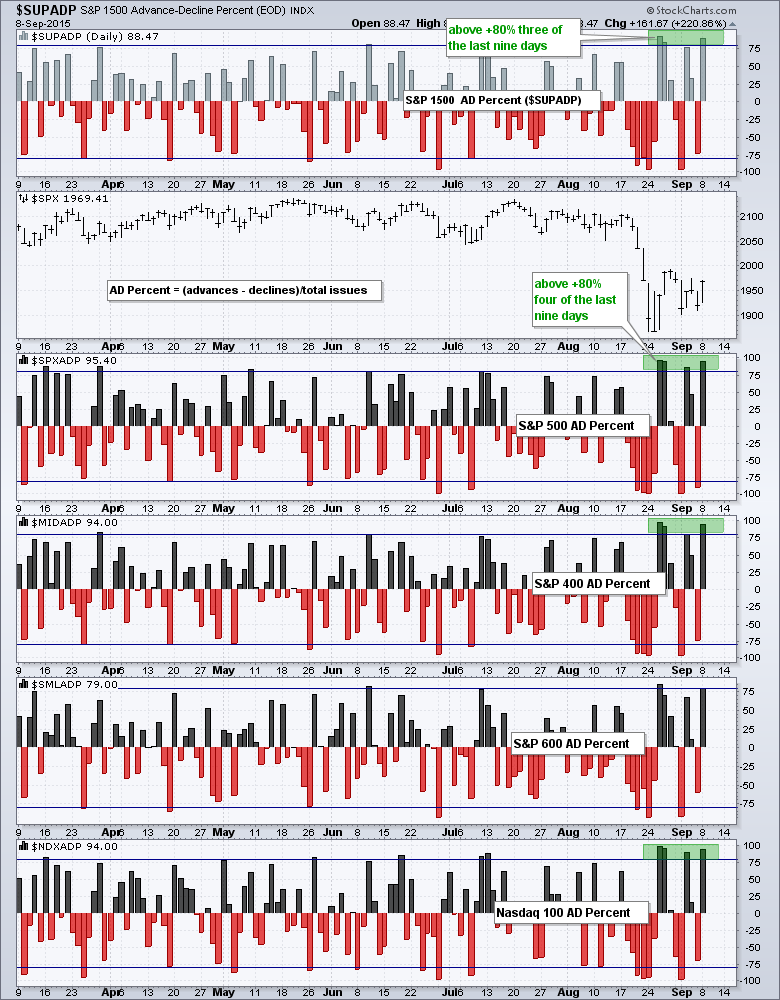
Breadth was exceptionally strong the last two weeks and the broad market indices are on the verge of a bullish breadth thrust. Despite a couple big down days last week, AD Percent for the major index ETFs put in four strong readings in the last nine trading days. Note that S&P 500 AD Percent ($SPXADP) and Nasdaq 100 AD Percent ($NDXADP) exceeded +80% four of the last nine days. Overall, AD Percent has been positive for six of the last nine days. This is strong breadth and almost counts as a bullish breadth thrust. The chart below shows AD Percent for the S&P 500, S&P MidCap 400, S&P Small-Cap 600 and Nasdaq 100. The green shading marks the +80% to +100% zone.
Click this image for a live chart
Quantifying a Breadth Thrust
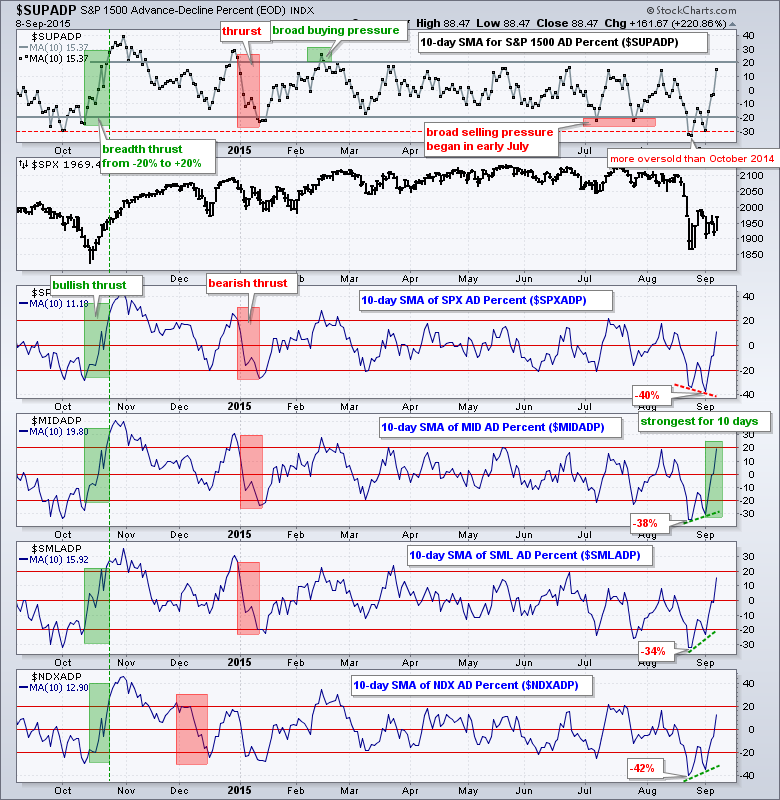
Chartists can quantify a breadth thrust by using the 10-day moving average of AD Percent. The chart below shows the 10-day SMA for S&P 1500 AD Percent ($SUPADP) in the top window, the S&P 500 in the second window and then the 10-day SMA for AD Percent for the other four indices. A bullish breadth thrust occurs when the 10-day SMA of AD Percent moves from below -20% and exceeds +20% in a short timeframe (~2 weeks). A bearish breadth thrust is the opposite. Working from left to right on the top window, notice the bullish breadth thrust in October 2014 and the bearish breadth thrust in January 2015. This bearish breadth thrust was negated when breadth moved back above +20% in mid February. Looking at current conditions, a move above +20% would complete the bullish breadth thrust for S&P 1500 AD Percent ($SUPADP).
Click this image for a live chart
Chartists can also look for readings above +20% to show broad buying pressure and readings below -20% to show broad selling pressure. Breadth started deteriorating in early July when the 10-day SMA for S&P 1500 AD Percent moved below -20%. The indicator bounced in mid July, but failed to exceed +20% and dipped below -20% with another bout of broad selling pressure. These two dips below -20% foreshadowed the August plunge as the indicator exceeded its October low to become very oversold.
There is one more thing to point out on this chart. The 10-day SMA for S&P 500 AD Percent moved below its late August low and hit -40%. The 10-day SMAs for S&P MidCap 400, S&P Small-Cap 600 and Nasdaq 100 formed higher lows over this timeframe and showed some relative (breadth) strength. Notice that the 10-day SMA for S&P MidCap 400 is the highest of the group and this means mid-caps have the strongest breadth over the last ten days.
Energy and Staples Lead Breadth Surge
The next chart shows the 10-day SMA for $SPX AD Percent in the main window and the 10-day SMA for AD Percent for the nine sector SPDRs. The 10-day SMA for S&P 500 AD Percent finished at +11.18%. Any sector with a higher 10-day SMA is showing relative (breadth) strength over the last two weeks. The sectors are sorted by the 10-day SMA of AD Percent and energy is by far the strongest at +25%. Consumer discretionary, technology, materials and consumer discretionary are next with readings between +14% and +17.5%).

Click this image for a live chart
I also drew red and green dotted lines connecting the late August low with the September 2nd low. Red lines slope down and reflect a lower low (broader selling pressure). The green lines slope up and reflect a higher low (less selling pressure). These breadth indicators for the four leading sectors also formed higher lows from August 24th to September 2nd. Overall, it looks like these four sectors are clearly leading the rebound. It is a motley crew, but nice to see technology in the mix.
******************************************
Plan your Trade and Trade your Plan!
--Arthur Hill CMT
*****************************************


