Bullish Breadth Thrust Falls Short
Stocks surged on Wednesday's open, but quickly gave up these gains and declined into the close. Selling pressure was quite broad as AD Percent for the S&P 500 exceeded -80%. Small-caps held up better as S&P 600 AD Percent finished at -56%. Overall, S&P 1500 AD Percent ended the day at -70% and fell short of a bullish breadth thrust.
The first chart follows up on Wednesday's note with the breadth indicators (10-day SMAs of AD Percent for the S&P 1500, S&P 500, S&P MidCap 400, S&P Small-Cap 600 and Nasdaq 100). With some 1500 stocks, the S&P 1500 acts as the broad market barometer and the key indicator to watch. The 10-day SMA for S&P 1500 AD Percent dipped below -20% in early July and again in late July to show broad-based selling pressure (red ovals). These two dips were followed by dips below -30% and the indicator became very oversold. We got the oversold bounce, but the indicator fell short of a bullish breadth thrust, which requires a move from below -20% to above +20%. This means follow through is needed to complete the first bullish breadth thrust since October. Barring such a signal, this breadth indicator remains net bearish.
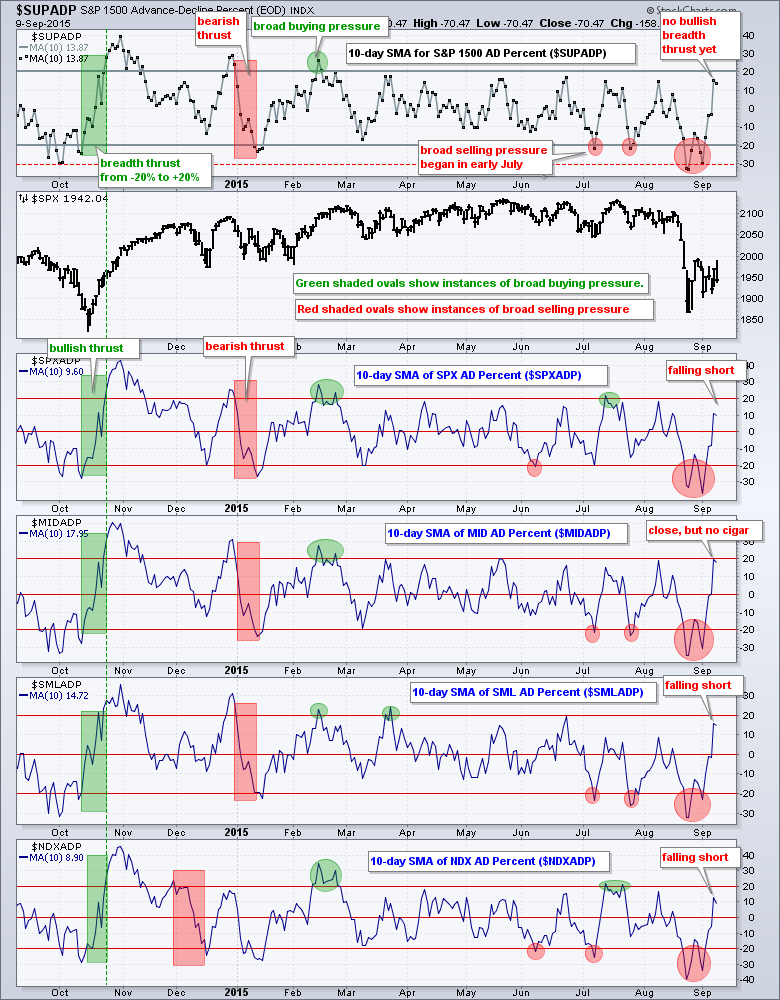
I have also added red ovals to identify instances of broad buying pressure and green ovals (> +20%) for instances of broad selling pressure (< -20%). Chartists only need to focus July, August and September for these ovals. The S&P Small-Cap 600 and S&P MidCap 400 experienced three instances of broad selling pressure since early July and no instances of broad buying pressure. They are clearly bearish overall. The S&P 500 and Nasdaq 100 experienced instances of broad buying pressure in mid July, but these were clearly negated with the August plunges below -20%.
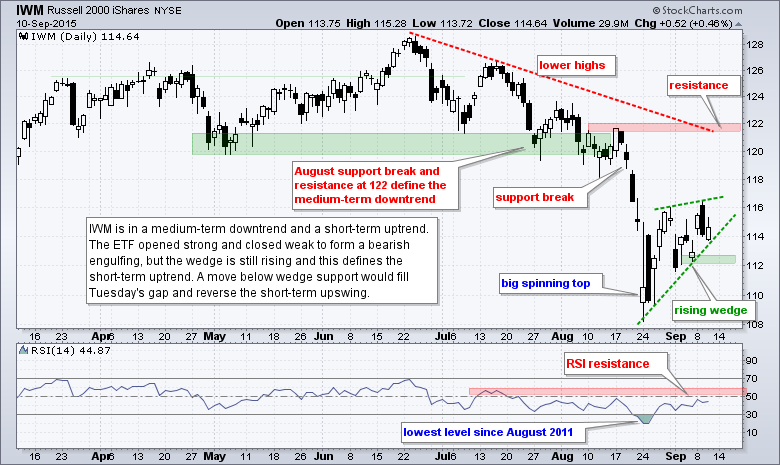
Pennants Evolve into Wedges for QQQ and IWM
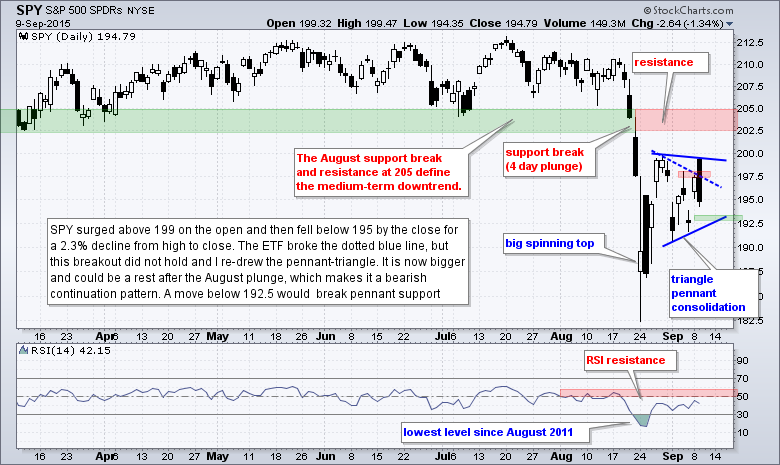
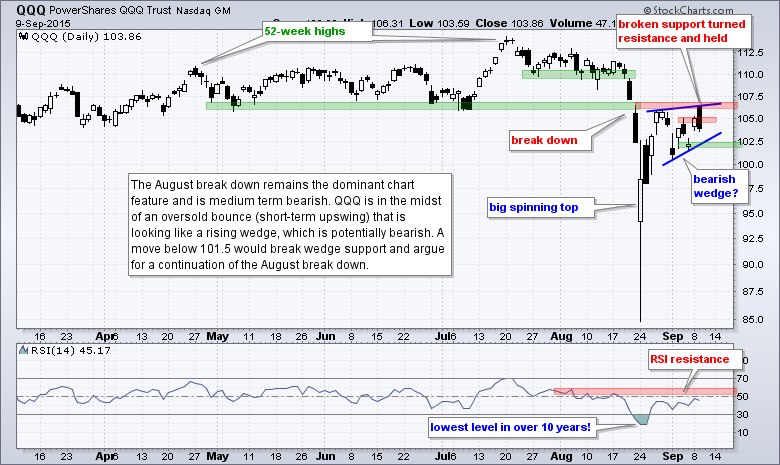
First and foremost, the medium-term trend remains down because the technical damage wreaked in August has yet to be undone. Short-term, IWM and QQQ managed to exceed the late August high on Wednesday's open and both have rising wedge patterns working the last two weeks. These patterns mark a short-term uptrend, but they are also typical for counter-trend bounces and chartists should watch wedge supports closely. Breakdowns here would signal a continuation of the August decline. SPY failed to exceed the last August high and remains with a pennant-triangle, though a bit bigger.
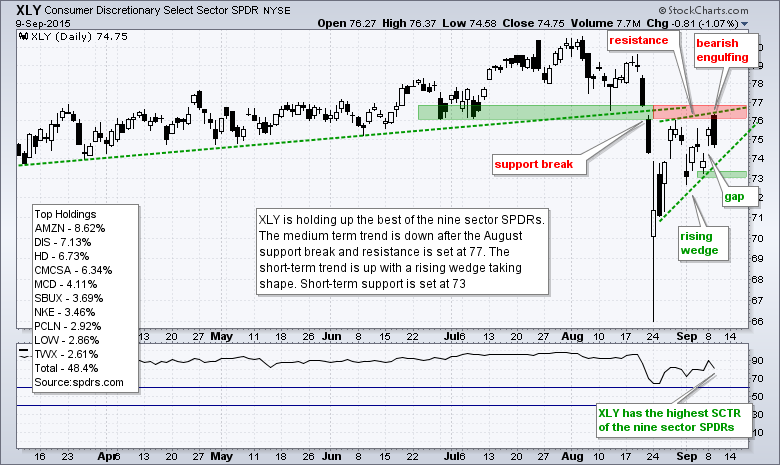
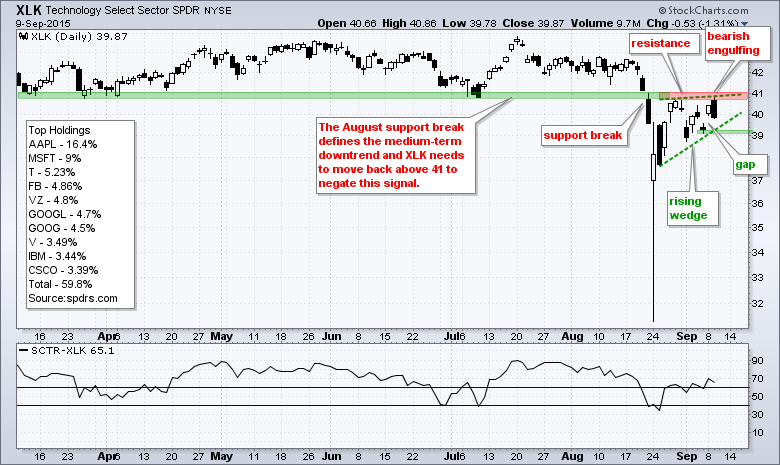
XLY and XLK Lead Sector SPDRs, but Mind the Gaps
The charts below show the Consumer Discretionary SPDR (XLY) and Technology SPDR (XLK) hitting resistance near broken support. These two are the strongest of the nine SPDRs because they have the highest StockCharts Technical Rank (SCTR). Chartists, therefore, should watch these two closely for clues on the broader market. Both gapped up on Tuesday and formed bearish engulfings on Wednesday. They also have rising wedge patterns working the last two weeks. Wedge breaks would fill Tuesday's gap and confirm the bearish engulfings. More importantly, such breaks would reverse the short-term upswings and signal a continuation of the bigger downtrends.
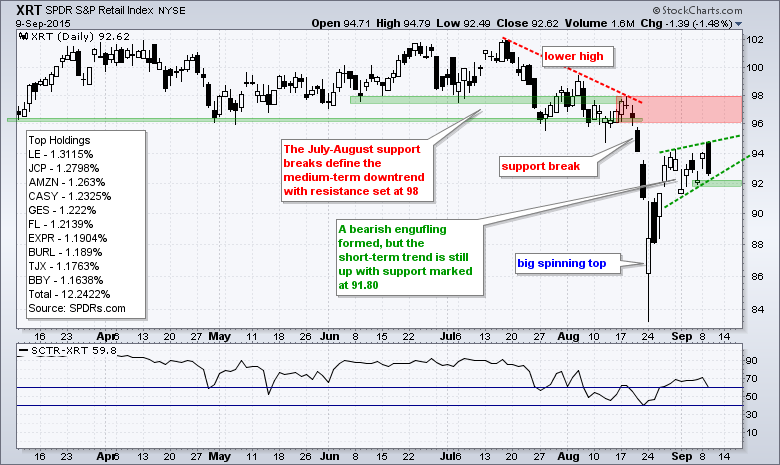
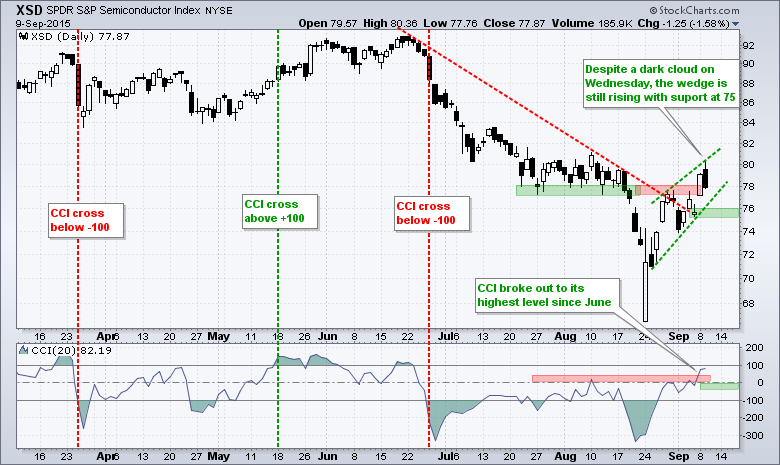
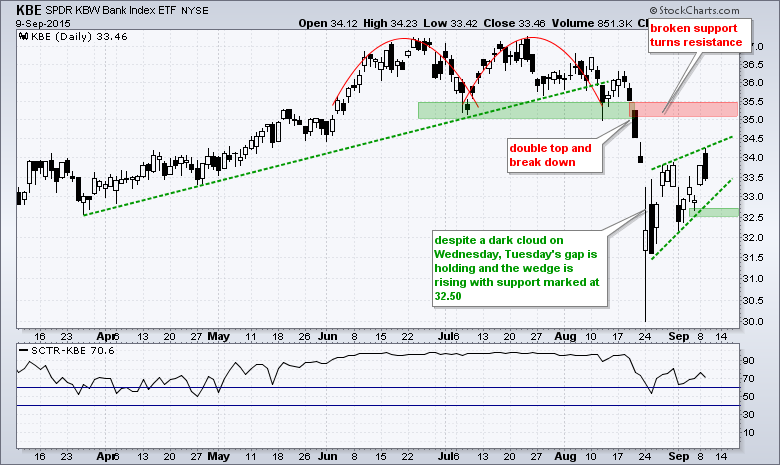
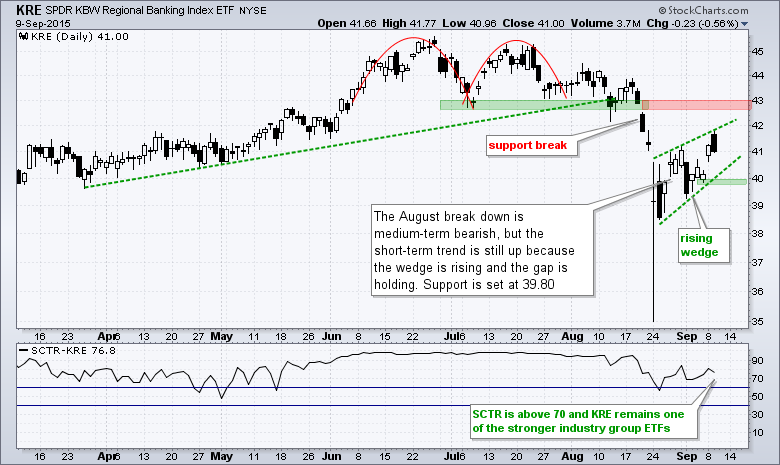
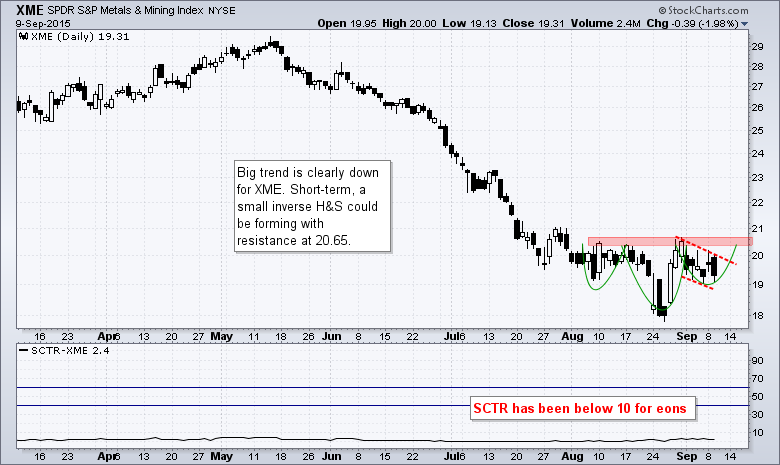
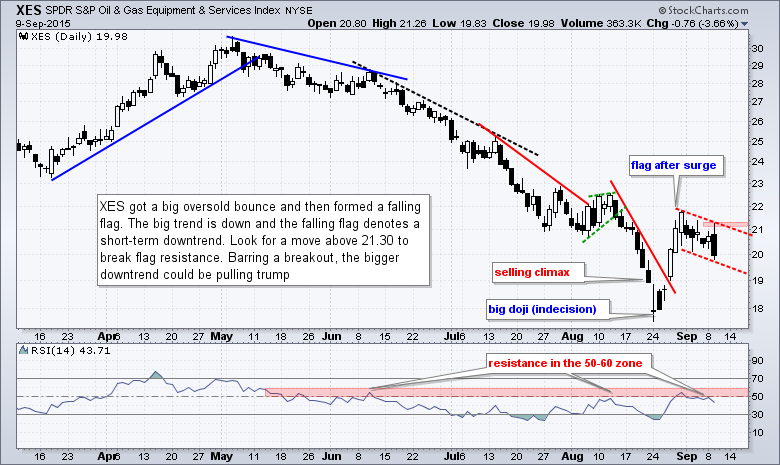
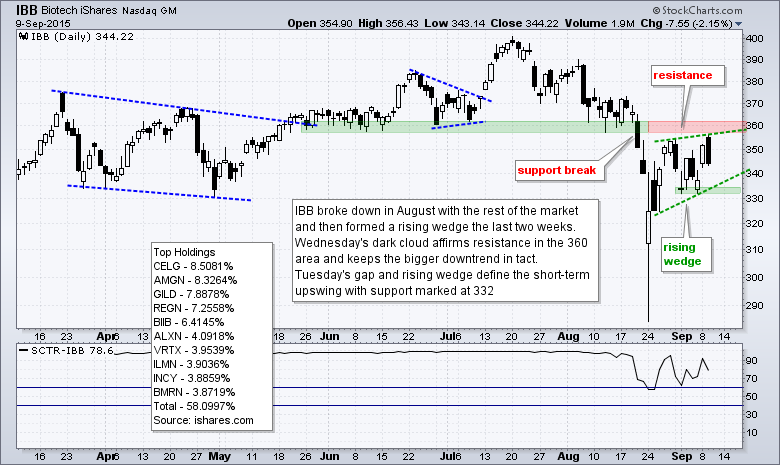
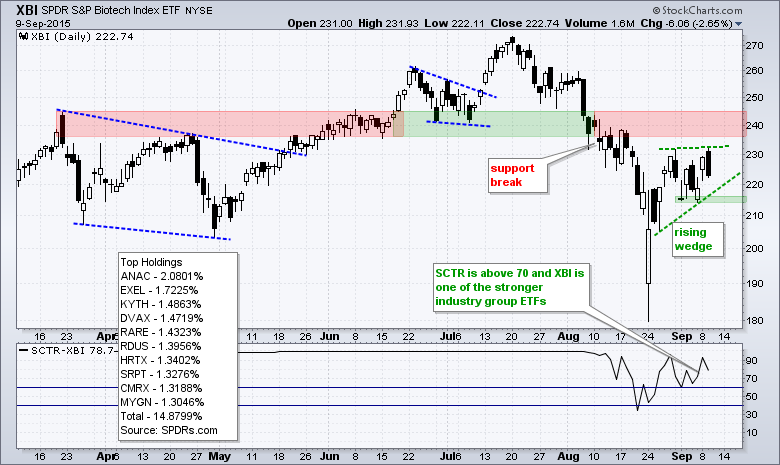
Rising Wedges Dominate Key Industry Group ETFs
The next charts cover some key industry group ETFs. With the exception of the Home Construction iShares (ITB), all are in medium-term downtrends after breaking down in August. It is important that chartists distinguish the short-term from the medium-term here. The medium-term trend is the dominant force and carries more weight. There are some short-term uptrends at work with rising wedges taking shape, but the medium-term downtrend is lurking out there and could pull trump at anytime.

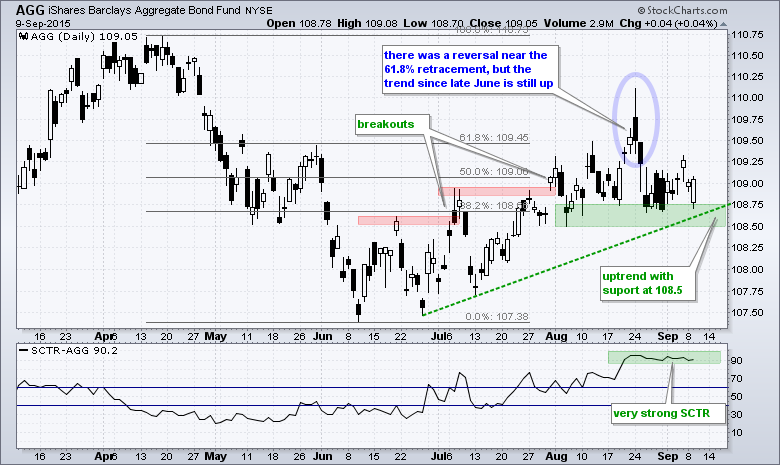
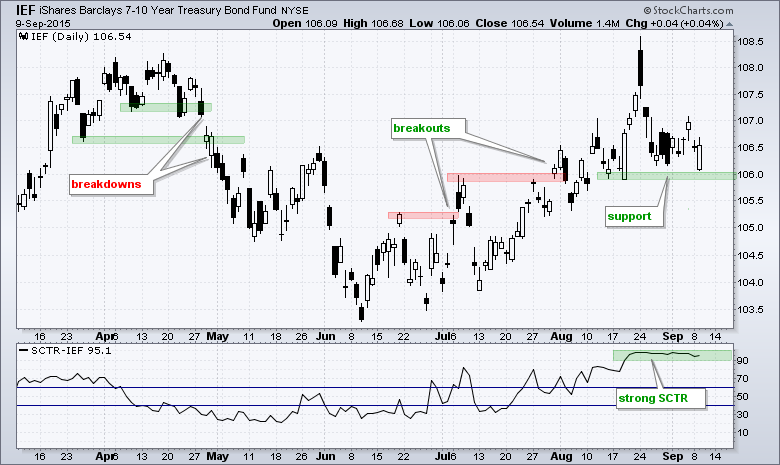
Cueing off the Bond Market
There has been a clear rotation from stocks to bonds over the last few months. Notice that the Aggregate Bond ETF (AGG) and the 7-10 YR T-Bond ETF (IEF) bottomed in June and moved higher in July-August. Money moving into bonds is money that is not available for stocks and this rotation also reflects a certain risk aversion in the market place. I would not expect stocks to continue higher as long as AGG and IEF maintain their uptrends.
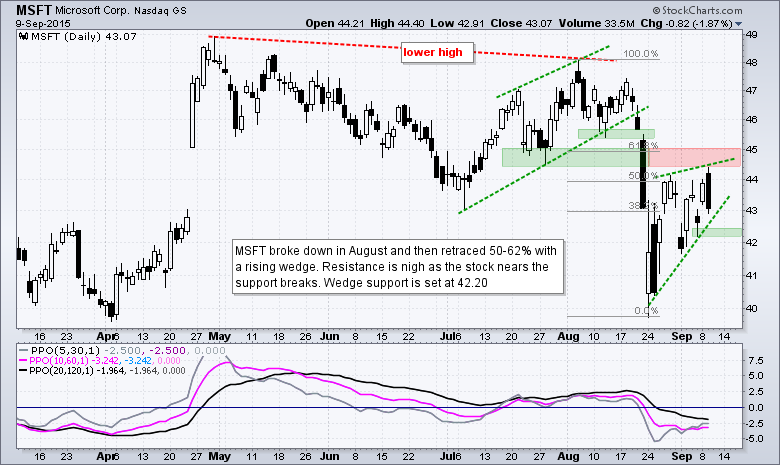
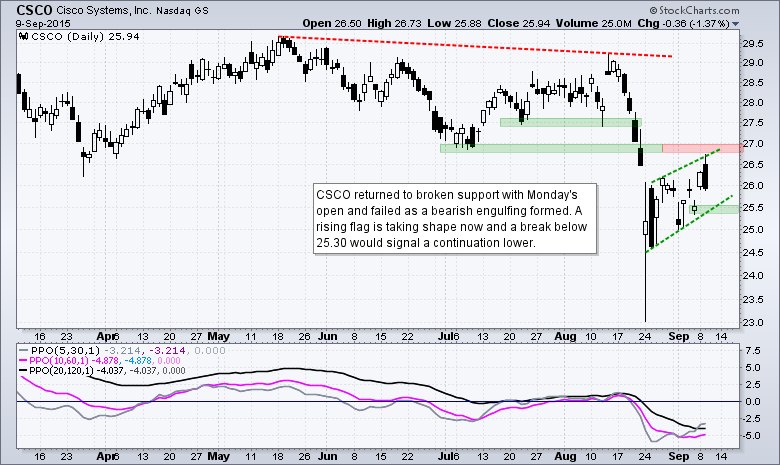
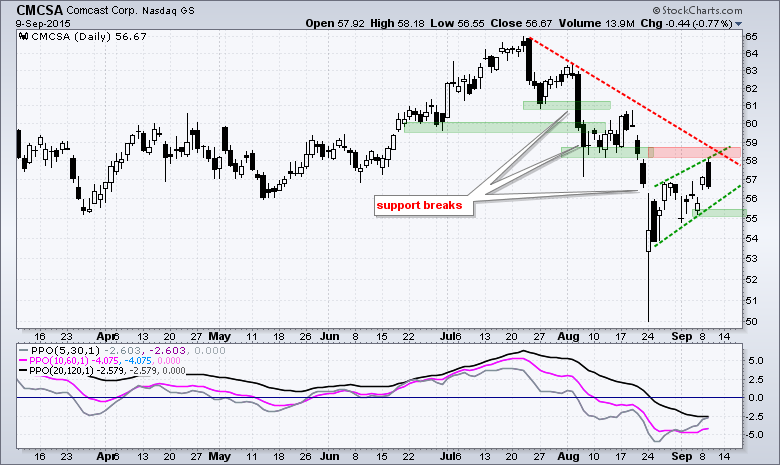
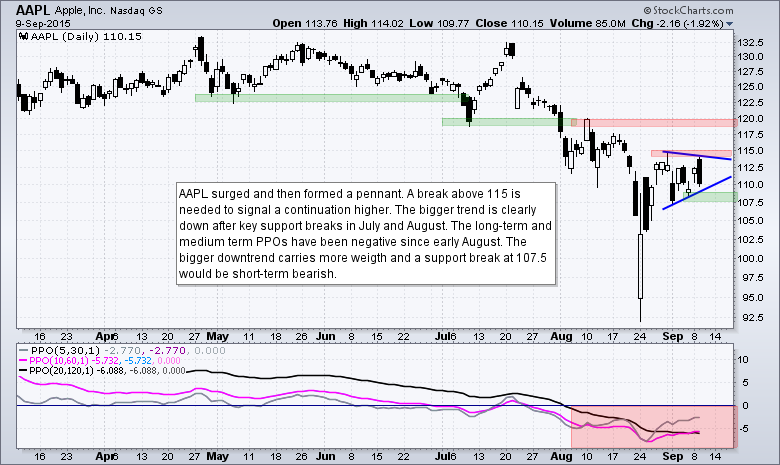
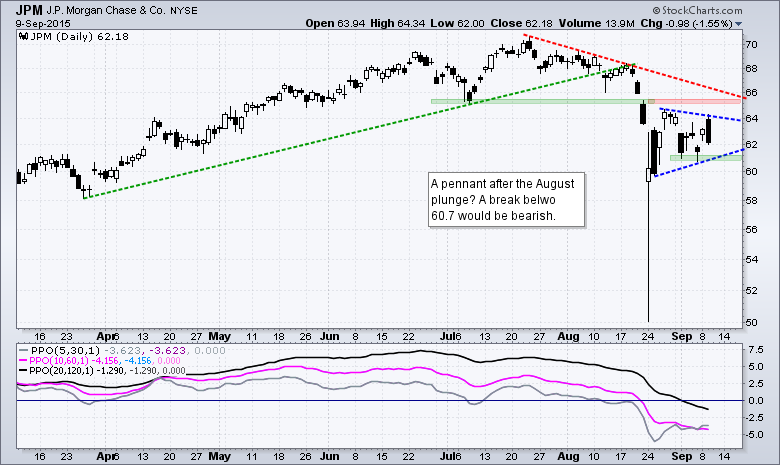
Five Large-cap Stocks to Watch
******************************************
Plan your Trade and Trade your Plan!
--Arthur Hill CMT
*****************************************


