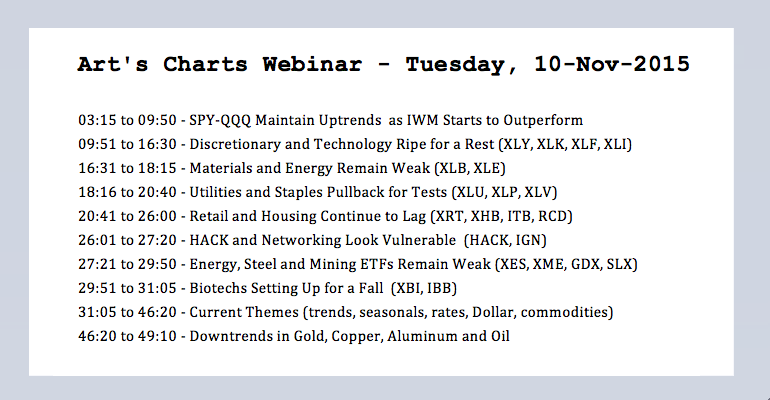
Pockets of Weakness Persist // SPY and QQQ Maintain Short-term Uptrends // IWM Starts to Outperform // XLY and XLK Ripe for a Rest // Materials and Energy Remain Weak // Retail and Housing Continue to Lag // HACK Looks Vulnerable // Oil & Gas Equip & Services SPDR Fall Short // Biotechs Setting Up for a Fall // Current Themes in the Markets ////
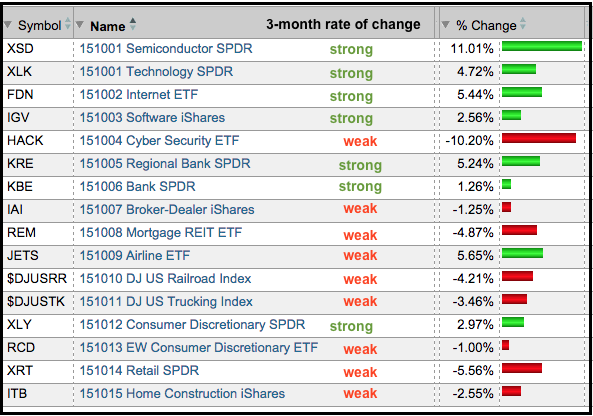
The overall stock market environment remains bullish, but there are still some pockets of weakness creating concern. Basically, it is a market of haves and have-nots. Semiconductor, software and internet are leading the technology sector, but cyber security is lagging bad. Banks and insurance are leading the finance sector, but REITs are starting to lag and mortgage finance remains very weak. The large-cap consumer discretionary stocks are powering XLY, but weakness in housing and retail is weighing on the equal-weight consumer discretionary sector. Airlines are soaring as the Airline ETF (JETS) hits new highs, but the DJ US Railroad Index ($DJUSRR) and the DJ US Trucking Index ($DJUSTK) remain in downtrends overall. This bifurcation could keep the broad market in check and result in choppy trading for the broad indices. This also means it is important to be aligned with the stronger style (large-mid-small), the stronger sectors and the stronger industry groups. I think the bulls have the edge until yearend, but would avoid weakness and embrace strength.
SPY and QQQ Maintain Short-term Uptrends
SPY and QQQ fell back over the last four days, but the short-term trends remain up. A small pullback after a sharp advance is pretty normal at this stage. The Raff Regression Channel and 23-Oct gap define the short-term uptrend for QQQ. A close below 109.7 would fill the gap and reverse the short-term uptrend. SPY support is set at 205. While a close below support would reverse the short-term uptrends, I would not turn too bearish because the bigger trends are still up. This implies that a short-term trend reversal would likely set up the next opportunity within the bigger uptrend.
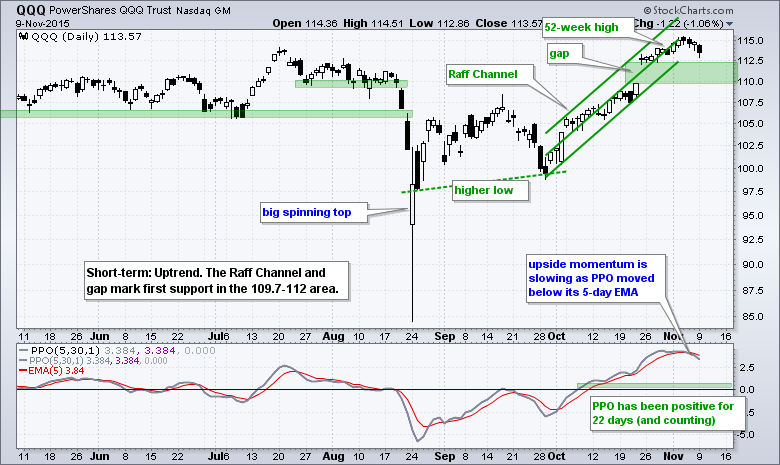
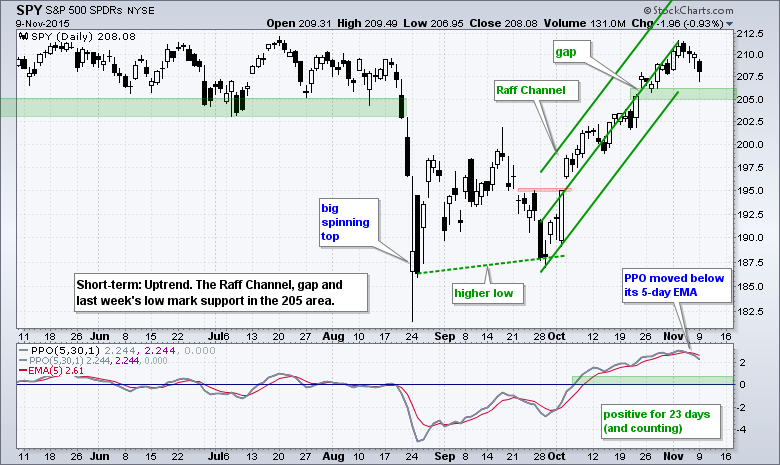
Upside momentum slowed over the last four days as the PPO moved below its signal line (for both SPY and QQQ). Note, however, that the PPOs are positive and greater than +2%. This means the 5-day EMAs are still over 2% higher than their respective 30-day EMAs. The downturn in the PPOs means the two EMAs have converged somewhat and the difference between the two is less than it was five days ago. Upside momentum is slowing, but the short-term trends remain up. There is now a detailed article and video available explaining the PPO and how I used it (click here).
IWM Starts to Outperform
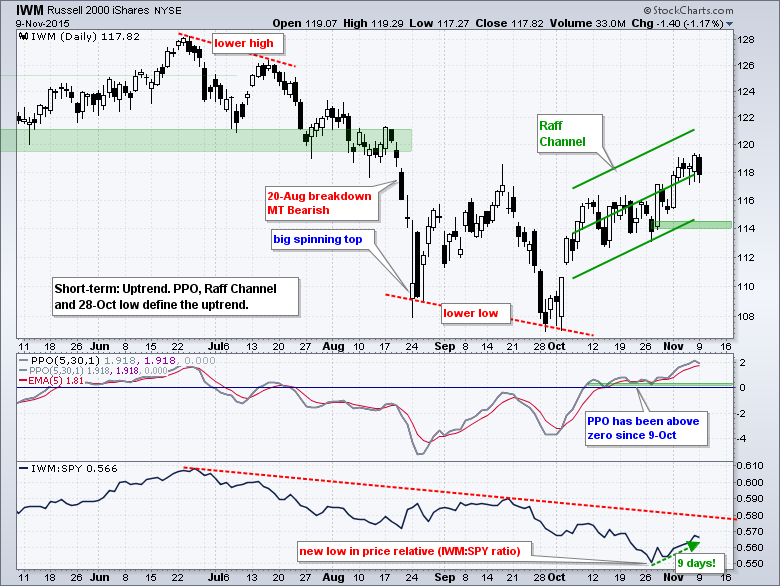
The Russell 2000 iShares (IWM) has held up quite well over the last few days and IWM has outperformed SPY for nine days now. The bigger trend in relative performance is still down, but nine days of relative strength is a start. On the price chart, IWM surged in early October and then worked its way higher the last few weeks. The Raff Regression Channel and positive PPO define the short-term uptrend. A close below 113.9 and a PPO move into negative territory would reverse the short-term uptrend.
XLY and XLK Ripe for a Rest
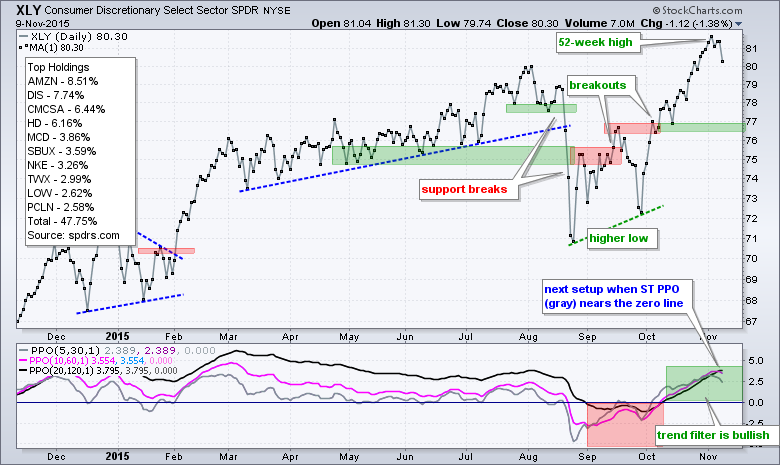
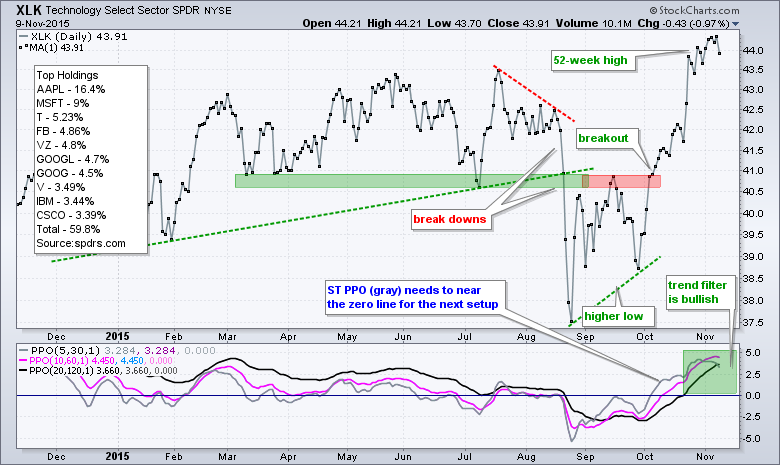
The Consumer Discretionary SPDR (XLY) and the Technology SPDR (XLK) are the market leaders because they were the only two sector SPDRs to hit new highs in early November. The long-term and short-term trends are clearly up, but these two are quite extended after big advances and ripe for a rest, which could involve a trading range or a pullback. As the charts show, the trend filters turned bullish when the PPO (10,60,1) and PPO (20,120,1) turned positive in early October. The short-term PPO (5,30,1) remains above 2% for both and pullback to the zero line is required for a short-term bullish setup. Such a move would require a pullback in the SPDR.
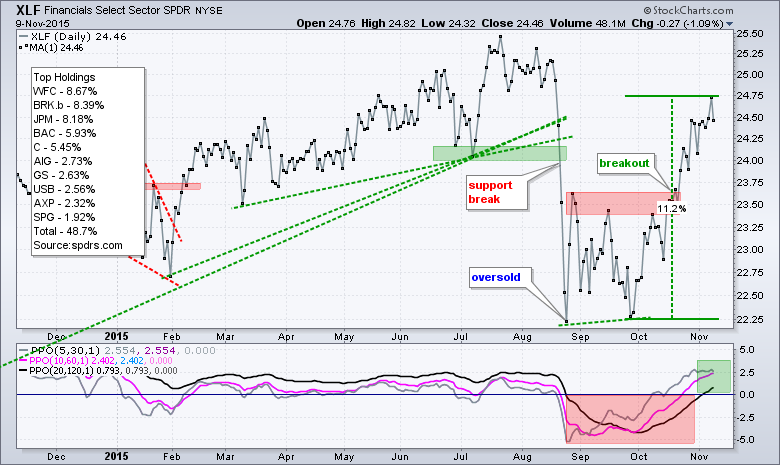
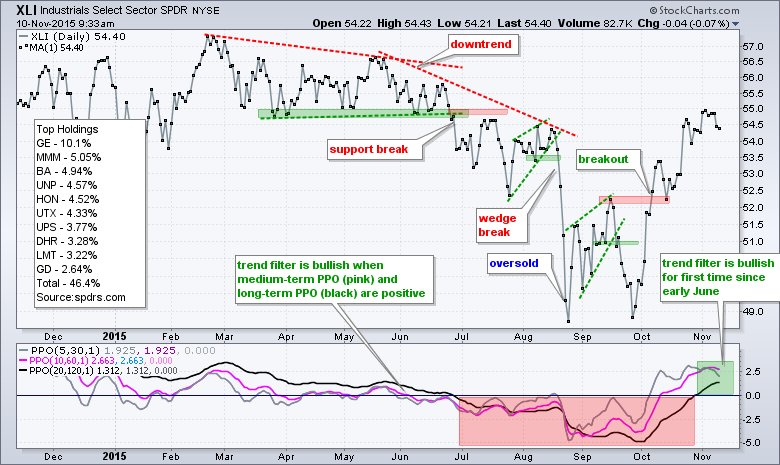
The Finance SPDR (XLF) went from laggard in late September to leader in early November with an 11% surge. This move pushed the PPO (20,120,1) into positive territory and the trend filter is bullish for XLF. The ETF is, however, quite extended and ripe for a rest (pullback or consolidation). The Industrials SPDR (XLI) shows similar characteristics.
Materials and Energy Remain Weak
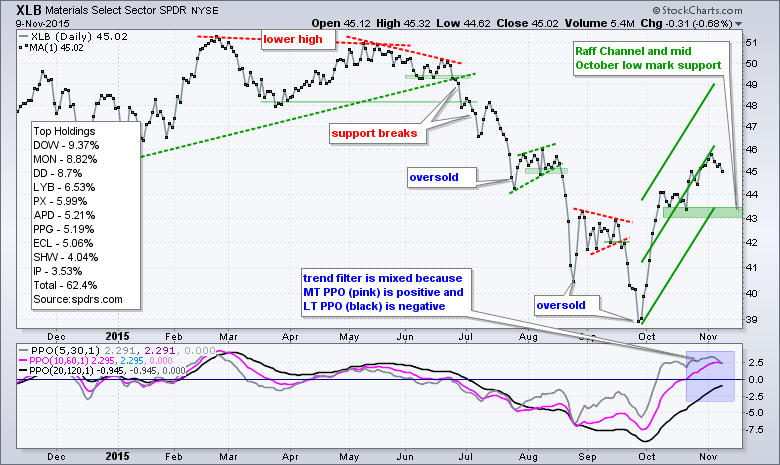
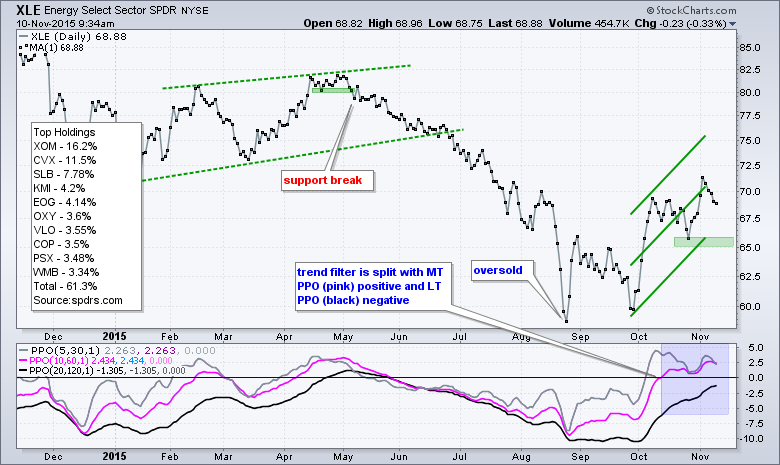
The Materials SPDR (XLB) and the Energy SPDR (XLE) are the two weakest sectors overall. XLE hit a 52-week low in late August and XLB hit a 52-week low in late September. Both are in long-term downtrends. Also note that XLB, XLE and XLV are the only three sectors with a negative long-term PPO (20,120,1). Thus, the bounce in XLB could be a mere counter-trend advance within a bigger downtrend. The Raff Channel, mid October lows and a buffer mark support and a break below 43 would reverse the short-term upswing. The XLE chart shows similar characteristics.
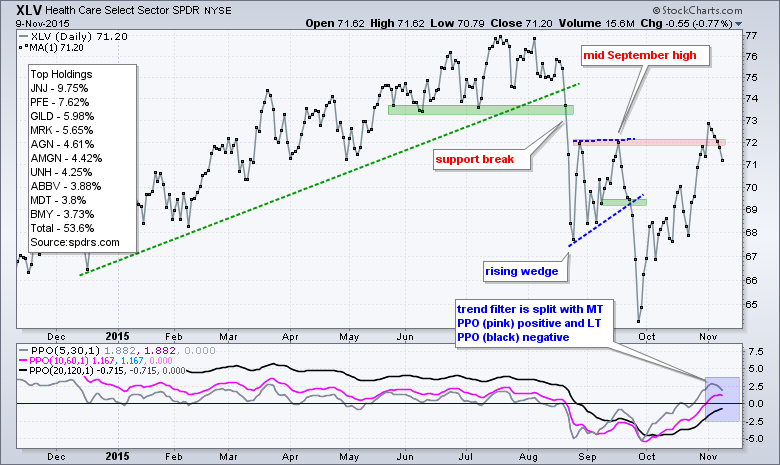
The HealthCare SPDR (XLV) surged almost 10%, but it is still one of the weaker sector SPDRs. The mid September high marks a benchmark high for the major index ETFs and sector ETFs. Those trading above it are showing some relative strength. Those trading below it are showing some relative weakness. XLV edged above it at the end of October, but fell back over the last five days. Using this criteria, XLV and XLU are the only two below their mid September highs right now. The long-term PPO (20,120,1) is also below zero for XLV.
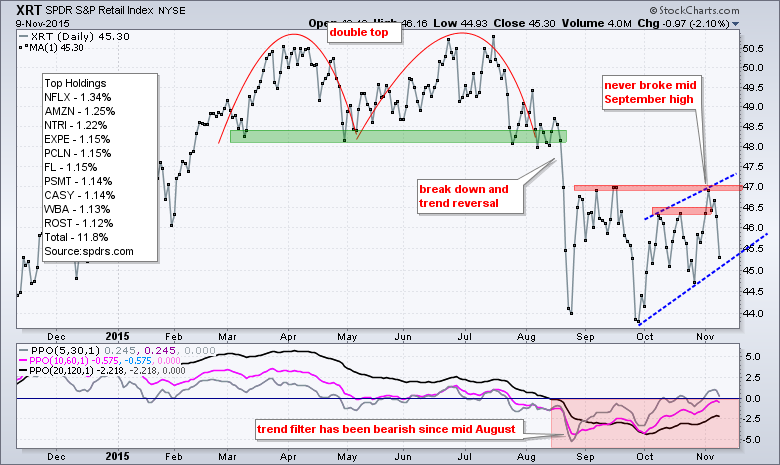
Retail and Housing Continue to Lag
Relative weakness in the Home Construction iShares (ITB) and the Retail SPDR (XRT) remains a concern going forward. XRT broke above its October highs last week, but this did not last long as the ETF plunged on Monday. The trend filter for XRT is bearish and the short-term PPO (5,30,1) is poised to turn negative as well.
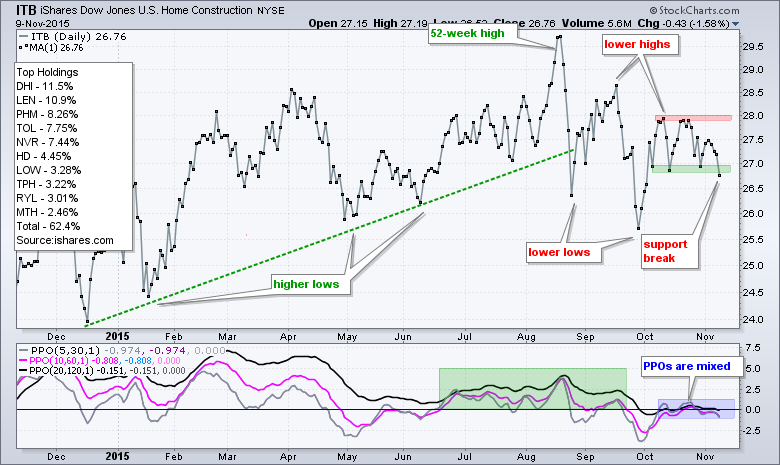
ITB did not even challenge its mid September high and formed a lower high in October. Furthermore, the ETF did not surge with the stock market in late October and broke support with a sharp decline on Monday. Boo hiss. The medium-term PPO (10,60,1) and long-term PPO (20,120,1) has been mixed the last few weeks, but the chart shows a clear downtrend with lower lows and lower highs since late August.
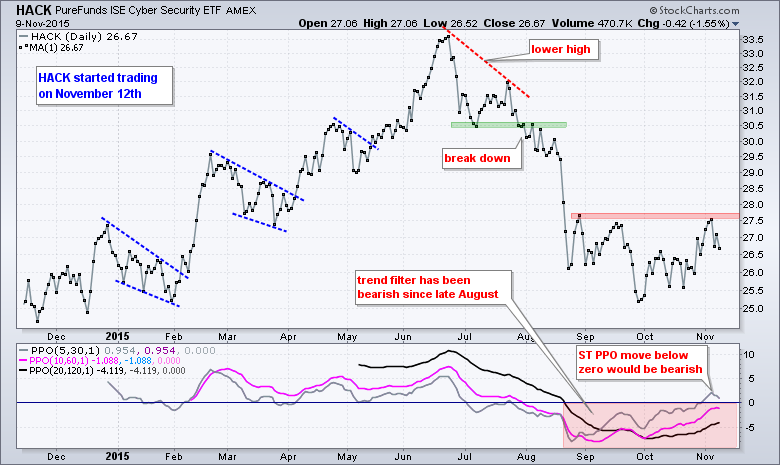
HACK Looks Vulnerable
Even though I like the secular growth story behind the cyber security industry, I do not like the price chart or the relative performance in the Cyber Security ETF (HACK). HACK broke down in early August and broke its late August low in late September. Even though the technology sector led the market rebound, HACK did not break its resistance zone and lagged severely. The trend filter is bearish and the short-term PPO (5,30,1) is just above zero, which means a short-term bearish setup is in the making. A move below zero in the short-term PPO would trigger this signal and argue for lower prices in HACK.
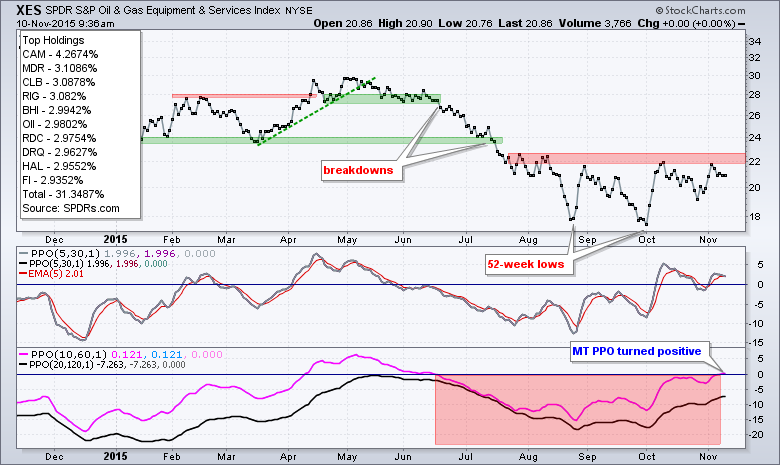
Oil & Gas Equip & Services SPDR Fall Short
Energy stocks led the market in first half of October, but fell back in the second half and remain weak overall. The Oil & Gas Equip & Services SPDR (XES) hit 52-week lows in late August and early October. The bounces over the last few months have all failed in the 22 area and the ETF is once again backing off this resistance zone. The medium-term PPO (10,60,1) turned positive, but the long-term PPO (20,120,1) remains below -5% (deeply negative). I think the bigger trend is down and a move below zero in the short-term PPO (5,30,1) would argue for a continuation of this downtrend.
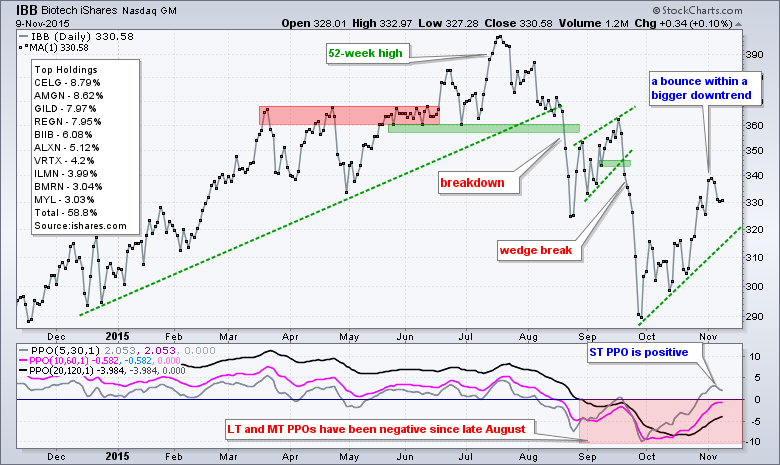
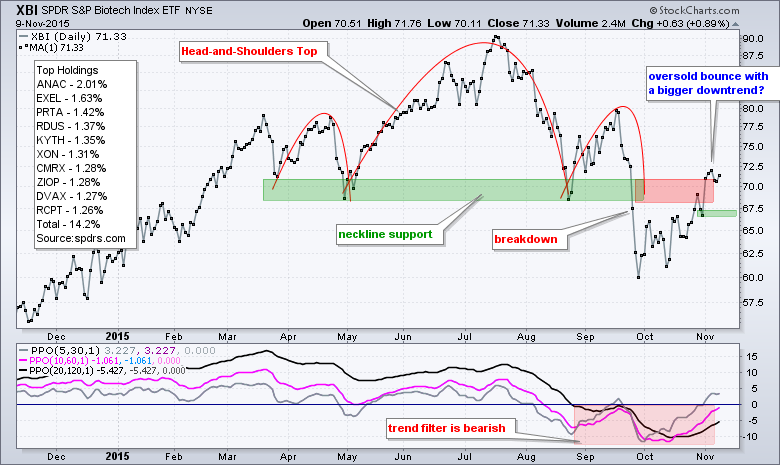
Biotechs Setting Up for a Fall
The Biotech iShares (IBB) and Biotech SPDR (XBI) recovered a large portion of their losses with the October surge, but both fell well short of their mid September highs and their trend filters remain bearish. With the short-term PPO (5,30,1) moving above zero, a short-term bearish setup is emerging. A break below zero in the PPO (5,30,1) would reverse the short-term uptrend and argue for a continuation of the bigger downtrend.
Current Themes Influencing the Markets
There are several themes currently active in the markets and I will make an attempt to summarize these. These are not signals, but rather underlying currents to consider along with basic technical analysis. For example, oil and copper are positively correlated to the 10-yr Treasury Yield. Even though this means they should rise when the 10-yr yield rise, oil and copper are in clear downtrends on the price charts and this downtrends trump correlation. I will also review the relevant charts in today's webinar (Tuesday, November 10th, 1PM ET). Click here to register.
- The S&P 500 and Nasdaq 100 are in long-term uptrends. This means short-term declines are viewed as pullbacks within an uptrend.
- The Russell 2000 broke out on the weekly chart with a close above the mid September high last week, but the weekly indicators have yet to turn up.
- The seasonal patterns are bullish. The six month cycle turned bullish in November and runs bullish until April. Also note that historical performance for the S&P 500 is strong from mid November to yearend.
- The January effect starts sometime in November and this bodes well for small-caps relative to large-caps.
- Treasury yields surged and the 10-YR Treasury Yield broke out. The 7-10 YR T-Bond ETF (IEF) and 20+ YR T-Bond ETF (TLT) broke down. We are now in a rising rate environment on the charts.
- Utilities, consumer staples and REITs are negatively correlated to the 10-YR Treasury Yield. This means they fall when the 10-yr yield rises.
- Banks, brokers and insurance are positively correlated to the 10-year Treasury Yield. This means they rise when the 10-yr yield rises.
- The Yen is negatively correlated to the 10-yr yield and the Nikkei 225 is positively correlated. This makes sense because the Yen and Nikkei are negatively correlated.
- Oil and Copper are positively correlated to the 10-yr yield, but gold is negatively correlated.
- The Dollar broke out with a surge the last four weeks and the long-term trend is up (this is negative for gold).
- Copper and Aluminum hit new lows this month and remain in long-term downtrends.
- Oil is off its lows, but also remains in a long-term downtrend.
- Gold is testing its August low and in a long-term downtrend.
****************************************
Thanks for tuning in and have a good day!
--Arthur Hill CMT
Plan your Trade and Trade your Plan
*****************************************


