A Market for All Seasons // New Market Theme Added // 52-week Lows Remain High // High-Low Lines Still Rising // QQQ, SPY and IWM Charts Updated // Electronic Payments and Big Tech Rock // AAPL Fires a Warning Shot // PPO Strategy: 5 Signals and 2 Setups /////
A Market for All Seasons
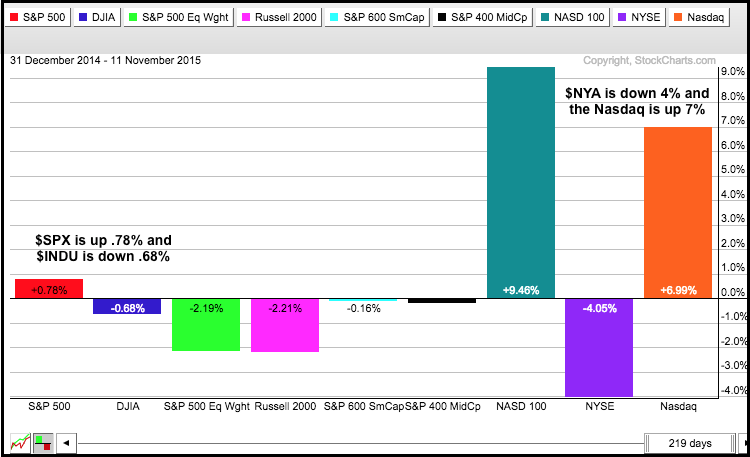
This stock market has something for both bulls and bears. Bulls point to strength in technology, while the bears point to weakness in small-caps. The bulls point to strength in the airlines, while the bears point to weakness in truckers. The bulls highlight the recent surge in the finance sector, while the bearish point to the meltdown in retailers. The broader market does not know what to think and remains as mixed as ever. As the year-to-date PerfChart below shows, the S&P 500 is up a fraction (.78%) and the Dow Industrials is down a fraction (-.68%). Elsewhere, the Nasdaq is up 7% year-to-date and the NY Composite is down 4%. It does not get more split than that. The stock market is dead. Long live the market of stocks, sectors and industry groups. Yes, it is a stock-ETF picker's market.
Adding a New Market Theme
The current market themes are listed below and I will update this list at least once per week. The oldest active theme is at the bottom and the newest at the top. I added a date to the newest as a time stamp of sorts. Be careful with the themes that are not related to price action, such a seasonality and correlation. Why? Because price action trumps seasonality and correlation.
- New lows remain persistently high (12-Nov).
- Retail SPDR (XRT) is trending lower and lagging.
- Home Construction iShares (ITB) is also trending lower and lagging.
- Tech and finance are the strongest equal-weight sectors.
- Energy and materials are the weakest equal-weight sectors.
- Seasonal patterns are bullish for stocks until yearend
- January effect in play until yearend (small-caps historically outperform large-caps).
- Breakout in the 10-yr yield and breakdown in bonds (early November)
- Rising rates positive for Nikkei, banks, brokers and insurance.
- Rising rates negative for Yen, utilities and REITs.
- Dollar breakout (late October) and strong dollar is negative for commodities.
- Oil, NatGas, gold, silver, copper and aluminum in long-term downtrends
- The S&P 500 weekly trend turned up 23-Oct.
- 3 of 4 index High-Low Percent indicators bullish (12-Oct) - $SPX,$SML,$MID,$NDX
- The Nasdaq 100 weekly trend turned up on 9-Oct.
- Zweig breadth thrust (8-Oct).
- The Russell 2000 weekly trend turned down on 21-Aug (and remains down).
- Small-caps have been lagging since July (leading since 27-Oct)
Number of New Lows Remains High
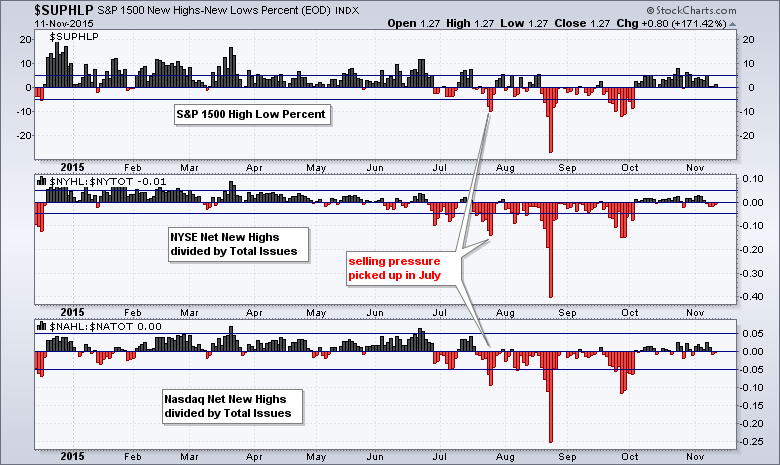
We can see just how split the broader market is by looking through the list of new highs and new lows. In fact, the S&P 500 is around 3% from its all time high, but were still quite a few new lows on Wednesday. New lows outnumbered new highs on the NYSE and the Nasdaq, but new highs edged out new lows for the S&P 1500. The chart below shows S&P 1500 High-Low Percent ($SUPHLP), High-Low Percent for the NYSE ($NYHL:$NYTOT) and High-Low Percent for the Nasdaq ($NAHL:$NATOT). Selling pressure picked up in July when all three broke below the -5% threshold. High-Low Percent for the NYSE and Nasdaq has yet to recover with a move back above +5%, but S&P 1500 High-Low Percent did recover in October. Note that the NYSE and Nasdaq are much broader than the S&P 1500 and they contain some pretty small names. Based on these indicators, the bulls are still muddling along. The trouble starts if all three break below -5%. This would show an expansion of new lows and signal a material increase in selling pressure. I consider this a medium to long term indicator.
High-Low Lines Still Rising
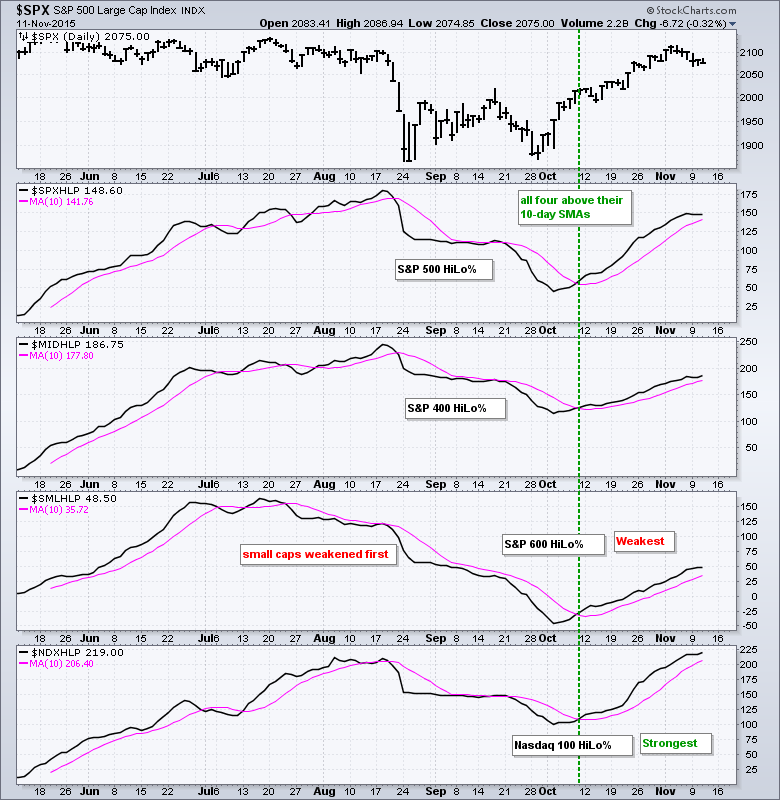
Chartists can also plot High-Low Lines for the S&P 500, S&P MidCap 400, S&P Small-Cap 600 and Nasdaq 100. A High-Low Line is like an AD Line using Net New Highs. The line rises when new highs outnumber new lows and falls when new lows outnumber new highs. All four High-Low Lines turned up in early October and broke above their 10-day SMAs. All four are still rising and I will be watching the 10-day SMAs quite closely. A break below these SMAs would indicate and increase in new lows and this would be bearish. I consider this a short-term indicator that helps define the immediate trend in stocks.
QQQ, SPY and IWM Charts Updated
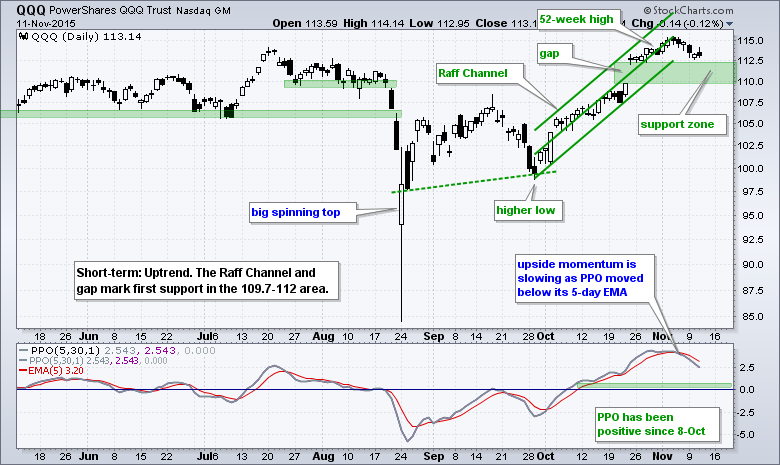
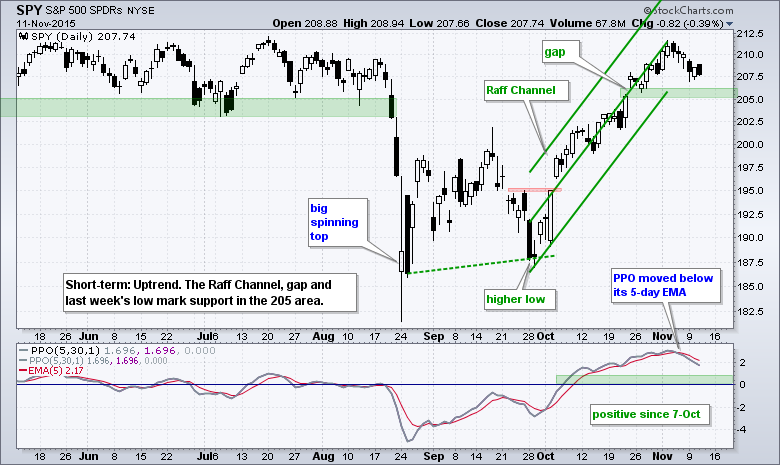
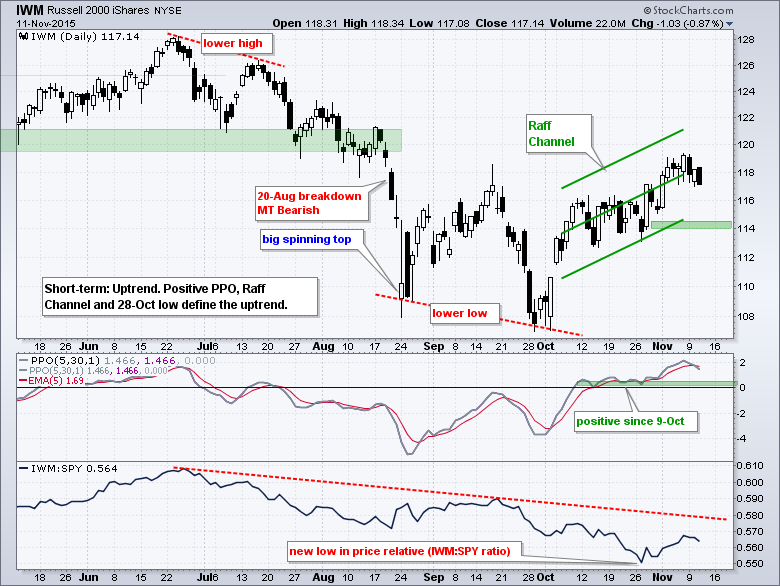
SPY and QQQ remain in short-term uptrends with the late October gaps marking support. IWM showed some relative strength the first week of October, but stalled out this week and fell on Monday and Wednesday. All three remain in short-term uptrends as long as support hold and their short-term PPOs stay positive. Support breaks and downturns in the High-Low Lines would be bearish here.
Electronic Payments and Big Tech Rock
Looking at the new high list, it is hard to be bearish on the Nasdaq 100 when Alphabet, Microsoft, Amazon and Facebook are hitting new highs. Apple is noticeably absent from this list. Elsewhere, I am seeing strength in the big electronic payment processors, Visa and Mastercard. Home Depot and McDonalds are the strongest in the consumer discretionary sector with new highs this month.
New Highs: Alphabet (GOOGL), General Electric (GE), Microsoft (MSFT), Amazon (AMZN), Facebook (FB), Home Depot (HD), McDonalds (MCD), Visa (V), MasterCard (MA), CBOE Holdings (CBOE), Intercontinental Exchange (ICE), Tech Data (TECD) and Ingram Micro (IM).
The new low list is peppered with stocks from the materials sector and littered with retailers. Talk about low expectations for the holiday shopping season. Is America finally shopped out?! Elsewhere, solar yieldcos are in deep trouble, data storage is not the place to be and 3D printing continues to print new lows.
New Lows: IBM, BHP Billiton (BHP), IPI (Intrepid Potasch), Macy's (M), Kohl's (KSS), Nordstrom (JWN), Urban Outfitters (URBN), Gap (GPS), Solar City (SCTY), Sun Edison (SUNE), Western Digital (WDC), Seagate Tech (STX), 3D Printing (DDD), Stratasys (SSYS), FireEye (FEYE) and Archer Daniels Midland (ADM)
AAPL Fires a Warning Shot
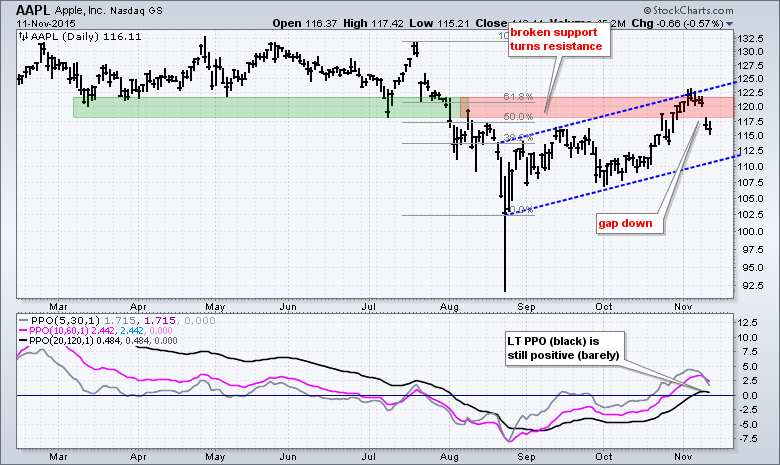
As noted above, Apple is underperforming its other four contemporaries (GOOGL, FB, AMZN and MSFT) by a long shot this year. Apple remains well below its summer high and the other four hit new highs this month. Even though the trend since late August is up, notice that Apple met resistance near broken support and gapped down. This is the first warning shot and the gap is short-term bearish as long as it holds. The PPO (20,120,1) is still positive, but it would not take much to turn it negative again.
PPO Strategy: 5 Signals and 2 Setups
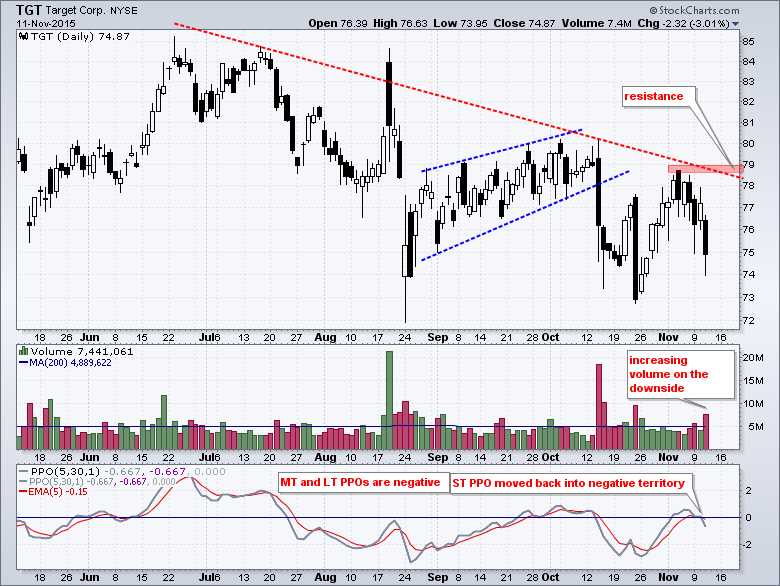
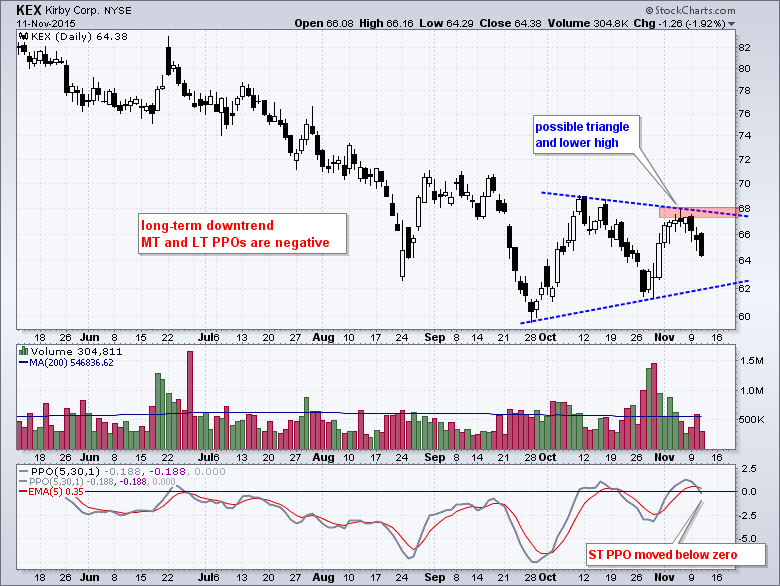
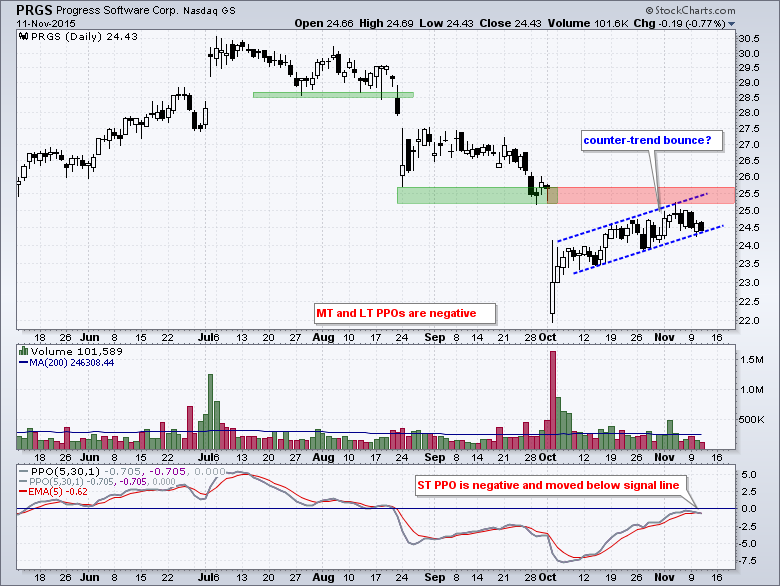
I ran the PPO scans recently and thought I would highlight a few PPO signals (two bullish and three bearish). You can read all about this strategy here. Standard disclaimers apply. You and only you are responsible for your trading and investing decisions.
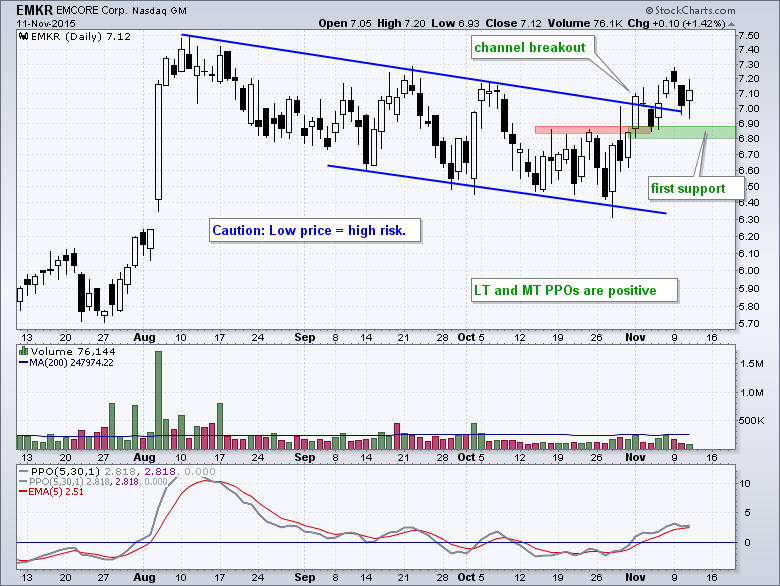
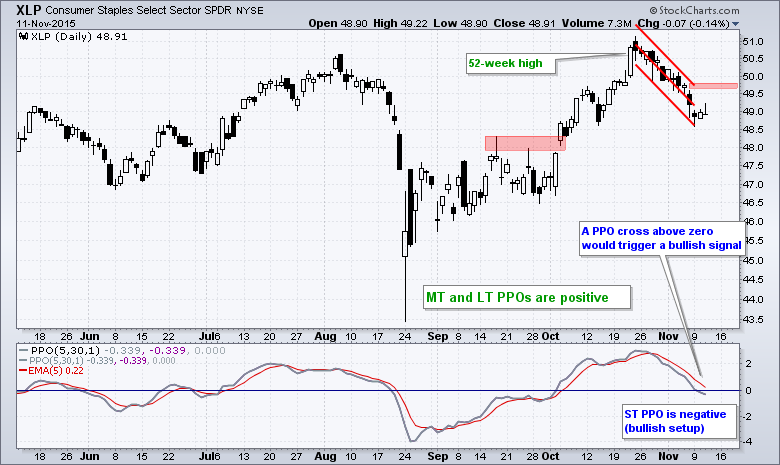
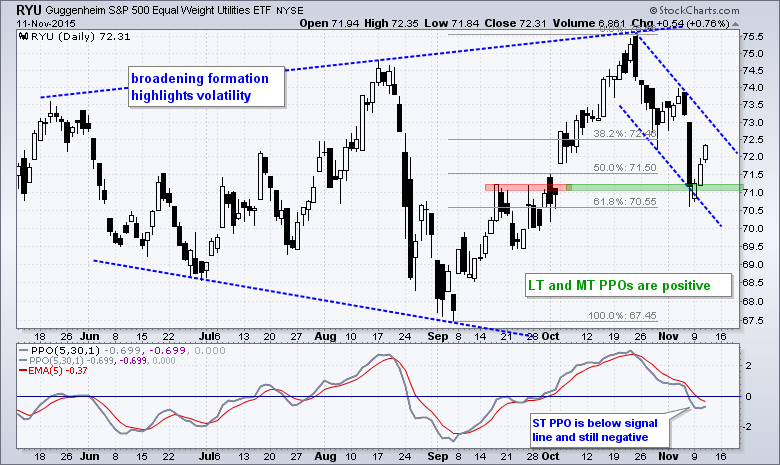
There are also bullish setups working in the EW Utilities ETF (RYU) and Consumer Staples SPDR (XLP). A bullish setup forms when the medium-term and long-term PPOs are positive, and the short-term PPO is negative. A subsequent upturn in the short-term PPO would turn this setup into a signal. I am a bit wary of consumer staples and utilities because they tend to underperform in a rising rate environment.
Here are some other charts of interest in text form. They are more like random thoughts on charts.
- JPM, BAC, C and GS gapped up last week and these gaps are holding so far.
- AIG formed an island reversal in early November and fell sharply this week.
- AXP shows some serious relative weakness and remains in a downtrend.
- UTX formed a high and tight flag.
- INFN has an inverse head-and-shoulders working since mid September.
****************************************
Thanks for tuning in and have a good day!
--Arthur Hill CMT
Plan your Trade and Trade your Plan
*****************************************
