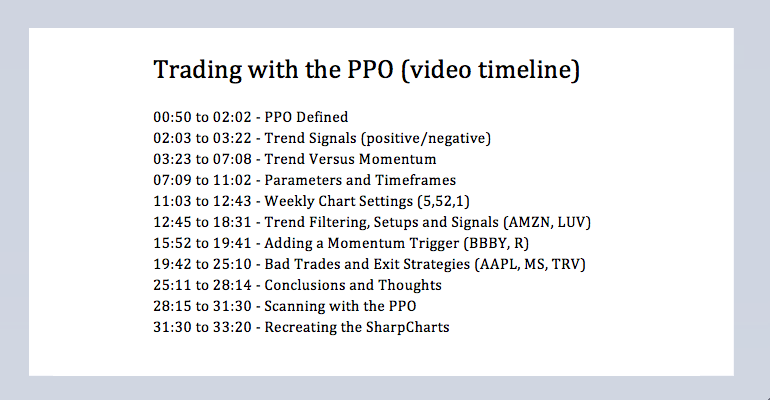
PPO Defined // Trend Signals // Trend and Momentum // Parameters and Timeframes // Weekly Chart Settings // Trend Filtering, Setups and Signals // Adding a Momentum Trigger // Bad Trades and Exit Strategies // Conclusions and Thoughts // Scanning with the PPO // Recreating the SharpCharts ////
****************************************************************************
Trading with the PPO
Table of Contents
- What Exactly is the PPO?
- Trend Signals
- Trend and Momentum
- Parameters and Timeframes
- Weekly Chart Settings
- Trend Filtering, Setups and Signals
- Adding a Momentum Trigger
- Stops and Profits
- Far from Perfect
- Conclusions and other Thoughts
- Scanning with the PPO
- Recreating the SharpCharts
Introduction
The Percentage Price Oscillator (PPO) is a great trading tool because it combines aspects of trend and momentum in one indicator. This article will show exactly how the PPO works, how to use the PPO to define the trend and how to generate signals within the trend. I will then present a trading strategy using three different PPOs. The medium-term and long-term PPOs are used as trend filters, while the short-term PPO is used to generate trend and momentum signals.
What Exactly is the PPO?
The Percentage Price Oscillator (PPO) is based on the difference between two moving averages. As with its cousin, MACD, the PPO is rather unique because it has aspects of both trend and momentum. The exponential moving averages capture the trend aspect, while the difference between these EMAs measures momentum. Because of these two aspects, chartists can use the PPO for trend signals and momentum signals.
In order to use the PPO effectively, chartists must fully understand what the fluctuations and centerline crosses are actually telling us. First, we should understand the difference between a positive and negative PPO. Second, chartists should know what it means when the PPO is rising or falling. Let's start with the formula.
PPO(5,30,1) = {(5-period EMA - 30-period EMA) / 30-period EMA} x 100
The shorter EMA is 5 periods, the longer EMA is 30 periods and the signal line is a 1 period EMA of the PPO, which means there is no signal line. I am basically showing the raw PPO to keep things simple and we will add a signal line later. The PPO is basically the percentage difference between a shorter EMA and a longer EMA.
Trend Signals
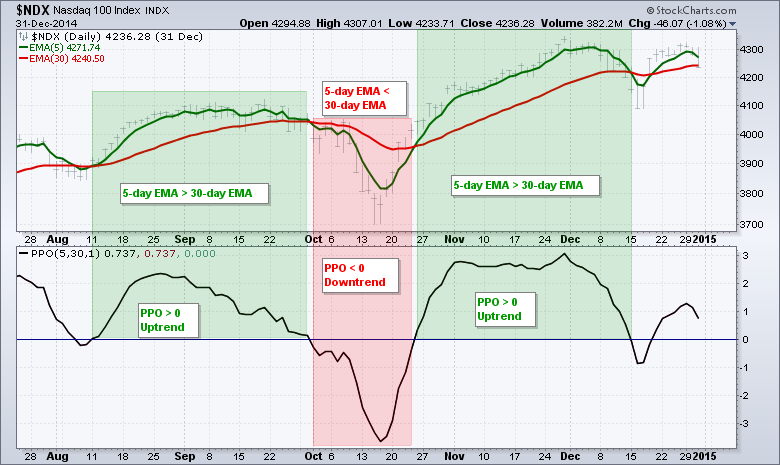
First, the PPO defines the trend with positive and negative readings, which result from the centerline crosses. A bullish trend signal occurs when the PPO crosses above zero, while a bearish trend signal occurs when the PPO crosses below zero. The PPO is positive when the shorter EMA is above the longer EMA (uptrend). This means the 5-day EMA is above the 30-day EMA and the trend is up. The PPO is negative when the shorter EMA is below the longer EMA (downtrend). This means the 5-day EMA is below the 30-day EMA and the trend is down.
Trend and Momentum
The PPO captures the trend with positive and negative readings. Within this trend, the PPO measures momentum as it moves towards the zero line and away from the zero line. Thus the PPO can be positive or negative and it can be rising or falling. This means there are four trend-momentum permutations for the PPO: positive-rising, positive-falling, negative-rising or negative-falling.
A positive and rising PPO means the trend is up and upward momentum is increasing. This is the most bullish combination because its means the 5-day EMA is above the 30-day EMA and it is rising faster than the 30-day EMA. Thus, the distance between the two is increasing and the value of the PPO is becoming more positive.
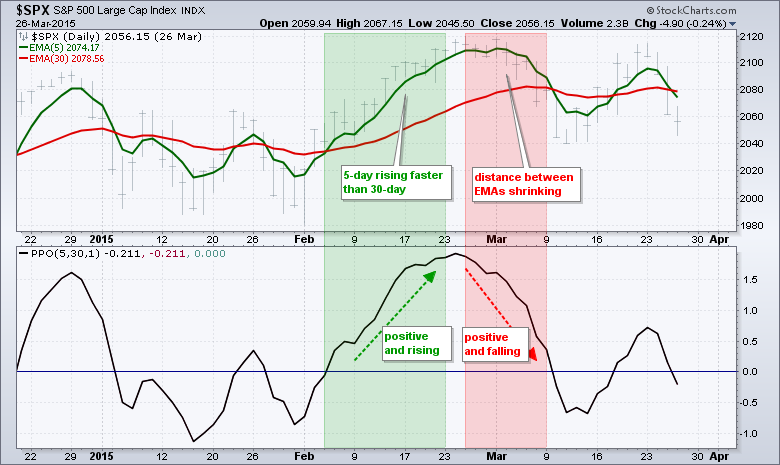
A positive and falling PPO means the trend is up and upward momentum is decreasing. The 5-day EMA is still above the 30-day EMA, but the advance in the 5-day EMA is slowing or the 5-day EMA is turning down. Either way, the distance between the two is decreasing and the value of the PPO is becoming less positive. Keep in mind that the trend is up until the 5-day EMA actually crosses below the 30-day EMA and the PPO turns negative.
A negative and falling PPO means the trend is down and downward momentum is increasing. This is the most bearish combination because the 5-day EMA is below the 30-day EMA and it is falling faster than the 30-day EMA. Thus, the distance between the two is increasing and the value of the PPO is becoming more negative.
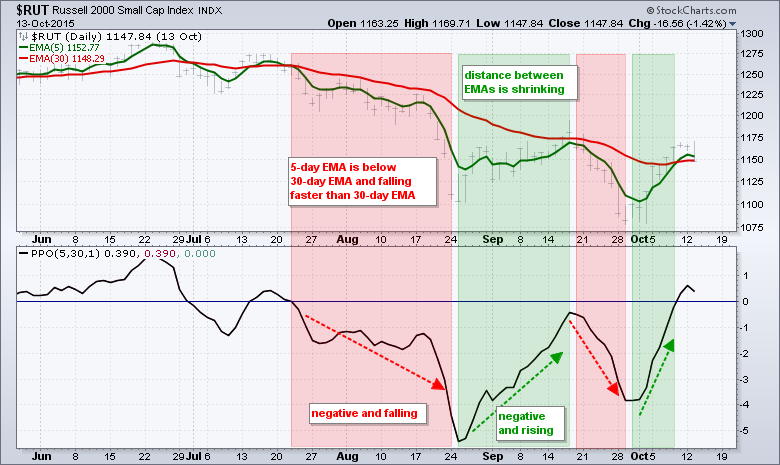
A negative and rising PPO means the trend is down and downward momentum is decreasing. The 5-day EMA is below the 30-day EMA, but the decline in the 5-day EMA is slowing or the 5-day EMA is turning up. Either way, the distance between the two is decreasing and the value of the PPO is becoming less negative. Keep in mind that the trend is down until the 5-day EMA actually crosses above the 30-day EMA.
The examples above used the PPO (5,30,1) on daily charts, but the general principles apply to all settings on all timeframes. There is a shorter EMA, a longer EMA and the PPO reflects the difference between these two EMAs. No matter what the time frame, the trend is up when the shorter EMA is above the longer EMA and the PPO is positive. The trend is down when the shorter EMA is below the longer EMA and the PPO is negative. The distance between these EMAs reflects the momentum within the trend.
Parameters and Timeframes
When it comes to parameters, chartists should first determine the trends they want to capture and then set the PPO parameters accordingly. Even though some parameter optimization is normal, I would recommend against curve-fitting the parameters to produce perfect signals. Market dynamics change and past results do not guarantee future results. It is better to base the parameter settings on a logical timeframe and keep these settings relatively stable.
The two EMAs in the PPO have specific, and complementary, functions. The shorter EMA is designed to smooth price movement and remain relatively sensitive. The longer EMA is designed to smooth price movement and remain relatively stable. Here are some of my preferred settings and the rationale behind them.
Daily PPO(5,30,1): short-term trend. A 5-day EMA captures a week's worth of price action, while the 30-day EMA captures six weeks of price action. The 5-day EMA is sensitive enough to catch short-term price movements and smooth enough to reduce whipsaws. As the nine-month Facebook chart shows, the PPO (5,30,1) produced nine short-term trend signals by crossing the zero line nine times.
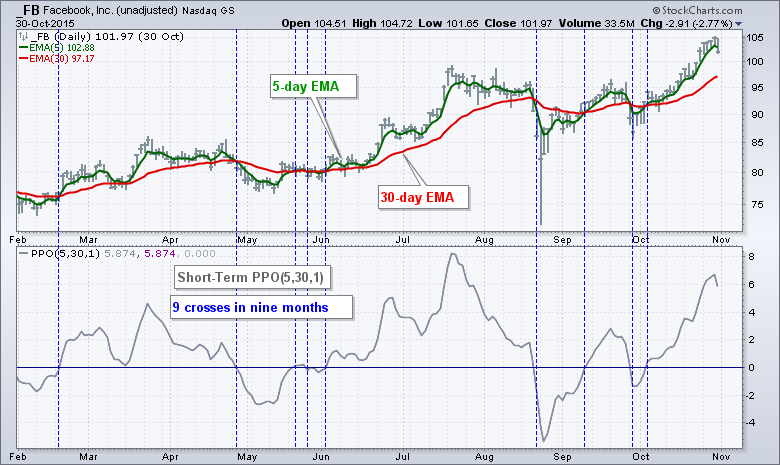
Data note: I am using unadjusted data by preceding the symbol with an underscore (_FB). This just means that dividends are not added back into the price and the historical values do not change. I am using this method purely for illustration purposes because this is how the price data would have looked at the time of the signal. Adjusted data, which accounts for dividends, is a true picture of performance because it reflects the total return (price changes plus dividends).
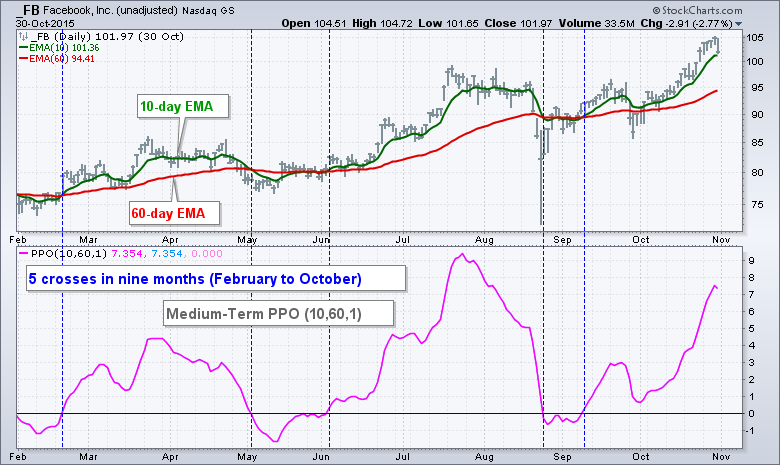
Daily PPO(10,60,1): medium-term trend. A 10-day EMA captures price action for two weeks and a 60-day EMA covers 12 weeks (~3 months). This is a medium-term trend indicator that will produce fewer signals (zero line crossovers) than the PPO (5,30,1). On the nine-month Facebook chart, the PPO (10,60,1) produced five medium-term trend signals as the PPO crossed the zero line five times.
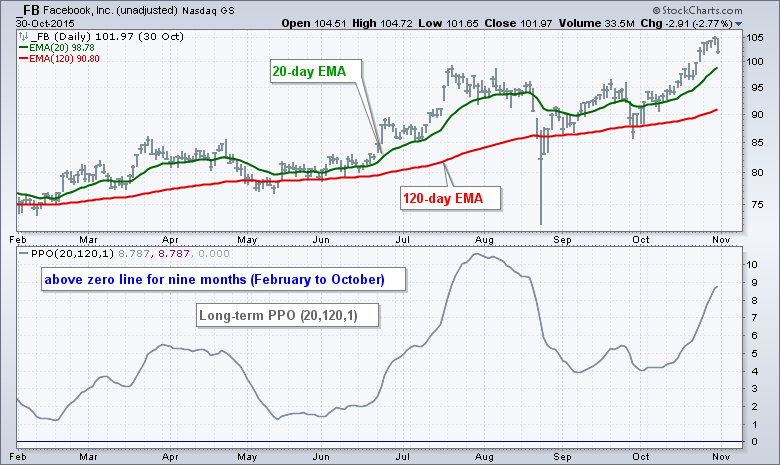
Daily PPO(20,120,1): long-term trend. A 20-day EMA captures price action for about a month and a 120-day EMA represents around six months. This is clearly a longer term indicator designed to capture trends that last two to six months, or longer. The Facebook chart shows a consistent uptrend because the PPO (20,120,1) was positive the entire nine month period.
As the parameters reflect, I like to scale my PPO settings to capture completely different trends. Notice how the PPO settings scale up and down proportionately. The PPO (5,30,1) is half the PPO (10,60,1), which is half the PPO (20,120,1). I also make sure the ratio between the shorter EMA and longer EMA is at least one to five (5:30, 10:60, 20:120). This insures that the shorter EMA remains relatively sensitive and the longer EMA remains relatively stable.
Weekly Chart Settings
The parameter settings, of course, depend on your personal preferences. Long-term may be longer for others and short-term may be shorter. Chartists interested in an even longer perspective could extend one step further with a PPO (40,240,1). Forty days covers almost two months of trading and 240 days covers almost a year. There are around 21 trading days per month and 251 trading days per year. Personally, I think 40 days is too long for the shorter EMA because it reduces the sensitivity too much. As such, I do not extend past 25 days for the shorter EMA.
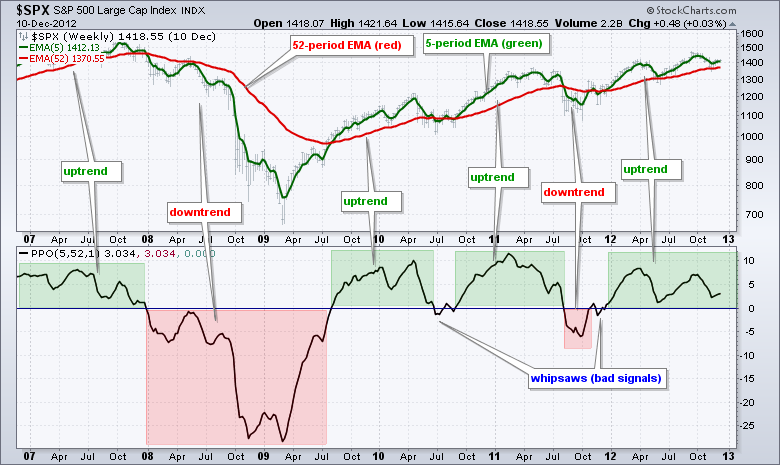
Chartists can also apply the PPO to weekly charts to capture even longer trends. The S&P 500 example with the PPO(5,52,1) shows some pretty good trend following signals and highlights an important aspect of trend following indicators. Namely, trend indicators need a good trend to work and will not work well when price action is trendless (flat). Notice that there were some whipsaws (bad signals) in the summer of 2010 and the autumn of 2011. No indicator is perfect and we must take the bad signals along with the good ones.
Trend Filtering, Setups and Signals
In addition to some basic trend following, the longer term PPOs can be used as trend filters to qualify short-term setups and signals. Trend filters are key to trading in the direction of the bigger trend, which is the dominant force at work. The trend is indeed your friend and the chances for a successful trade increase when trading with the trend. This means there are really only two plausible positions in an uptrend: long or out. Short positions are not an option when the bigger trend is up. Similarly, there are only two plausible positions in a downtrend: short or out.
The medium-term PPO (10,60,1) and long-term PPO (20,120,1) can be used as trend filters. The bigger trend is clearly up when both are positive and this means chartist should only focus on bullish trend signals from the PPO (5,30,1). Bearish signals should be ignored because they run counter to the prevailing trend.
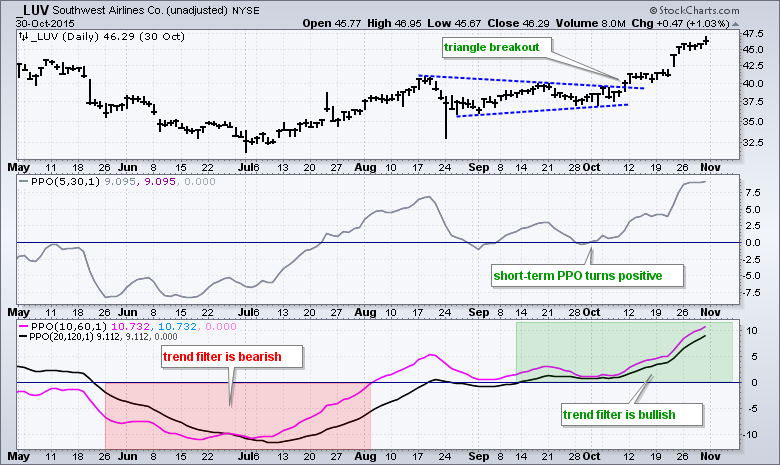
There are two steps to this PPO strategy: the setup and the signal. A bullish setup occurs when the trend filter is bullish and the short-term PPO (5,30,1) moves below zero. Basically, a move into negative territory indicates a short-term pullback within an uptrend. This setup evolves into a bullish trend signal when the short-term PPO crosses back into positive territory. I am calling this a "trend" signal because the PPO turns positive when the 5-day EMA moves above the 30-day EMA.
The example shows Southwest Airlines with the trend filter turning bullish in mid September and a PPO (5,30,1) setup in late September. A bullish trend signal did not trigger until October 1st when the PPO (5,30,1) crossed above the zero line. There was also a triangle breakout on October 9th.
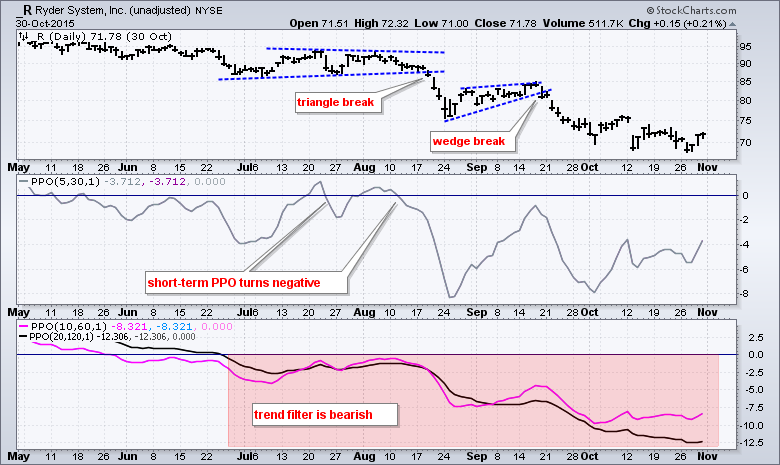
The bigger trend is clearly down when the PPO (20,120,1) and PPO (10,60,1) are negative. This sets the trend filter to bearish and chartists should only focus on bearish setups. The example shows Ryder (R) with a bearish filter in place from late June to October. The PPO (5,30,1) moved above zero twice for two setups. These setups evolved into bearish trend signals when the PPO (5,30,1) turned back down and moved below zero.
Adding a Momentum Trigger
Up to this point, I have focused on the trend signals for the PPO and avoided the momentum signals. The trend signals occur when the PPO turns positive or negative and this signals a cross in the EMAs. Momentum signals, on the other hand, occur when the EMAs converge or diverge, but do not cross. This means you can get a bullish momentum signal without a bullish trend signal, and visa versa. Hence, there are more momentum shifts than trend signals and this means there is more noise with momentum. Personally, I prefer less noise and ignore most momentum signals.
Sometimes, however, the trend filter is bullish, but the uptrend is so strong that the PPO (5,30,1) does not dip into negative territory for a bullish setup. Similarly, sometimes the trend filter is bearish, but the downtrend is so strong that the short-term PPO (5,30,1) does not turn positive for a bearish setup.
Strong trends require more sensitivity in our indicators and this is where momentum comes into play with the PPO signal line. Chartists can increase the number of signals by adding a signal line to the PPO (5,30,1) and looking for short-term upturns or downturns. Simply change the last "1" to a "5" to add a 5-period EMA as the signal line.
Careful. Adding a signal line produces a double-edged sword because it increases the number of signals and this increases the number of whipsaws. Chartist, therefore, should qualify signal line crossovers to weed out the weak signals. The general idea is to focus on signal line crossovers that are close to the zero line.
The example shows Amazon (AMZN) within a strong uptrend from February to July. We know it is strong because the PPO (5,30,5), PPO (10,60,1) and PPO (20,120,1) were positive the entire time. This would have been frustrating because the trend filter was bullish, but the PPO (5,30,5) never dipped into negative territory to set up a bullish signal.
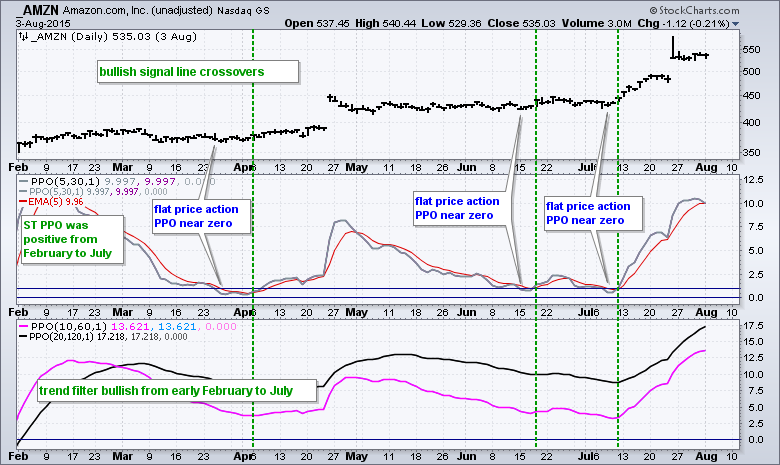
The red line on the PPO (5,30,5) is the 5-period EMA or signal line and the green dotted lines mark qualified bullish crosses. Notice how the PPO moved towards the zero line as price action flattened, but never moved into negative territory. I added a second horizontal line at 1% to quantify a dip towards the zero line. A PPO move below 1% provides the bullish setup and a subsequent signal line crossover triggers the bullish momentum signal.
The next example shows Bed Bath & Beyond (BBBY) with a bearish trend filter from May to August. This trend was quite strong because the short-term PPO (5,30,1) turned positive only once in mid May. Chartists waiting for another positive reading and a bearish setup would have been disappointed in June and July.
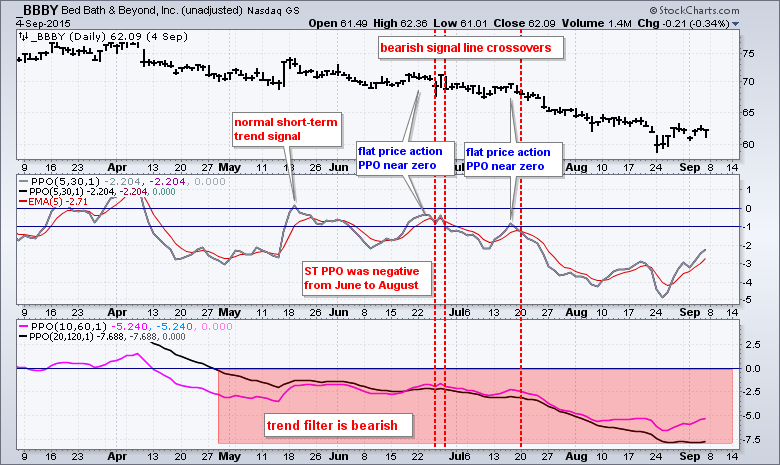
The second horizontal line on the short-term PPO is at -1% to qualify bearish momentum signals. A move above -1% means price action has flattened and the 5-day EMA moved closer to the 30-day EMA. The red line is the 5-period EMA of the short-term PPO. A move above -1% creates the setup and a subsequent break below the signal line is the bearish momentum signal. This means the 5-day EMA is getting further from the 30-day EMA and downside momentum is increasing.
Stops and Profits
Entry is just part of a trading strategy and it is important that traders have a full plan before entering a trade. Among other things, this plan involves position sizing, the initial stop-loss, a potential profit target and a method to trail the stop-loss. I am not going to get too detailed right now because I plan to write a bigger article on stops, profit taking and position sizing. For now, I will suggest that a stop-loss should be based on support or resistance level or a change in the trend.
Support and resistance levels are the first choice for stops. In an uptrend, a stop-loss should be based on a support level and trailed higher when a new support level is established. New support levels usually emerge after prices move above a prior high. I would also suggest adding a small buffer by placing a stop-loss just below the support level. The reverse logic can be applied to a resistance level.
In the absence of clear support or resistance, chartists can look for signs that the current trend has reversed. If the short-term trend is up and one is trading based on the short-term PPO (5,30,1), then a move into negative territory would suggest that the short-term uptrend has reversed. Even though this might be another bullish setup in the making, I would not hold a long position if the PPO (5,30,1) moved into negative territory. This would means the 5-day EMA is above the 30-day EMA and some sort of short-term uptrend is underway.
Bad Trades and Exit Strategies
So far I showed the profitable signals and how this PPO trading strategy works under good circumstances. As with all systems and signals, there will be periods of negative performance and periods when the signals don't work. This is all part of the game.
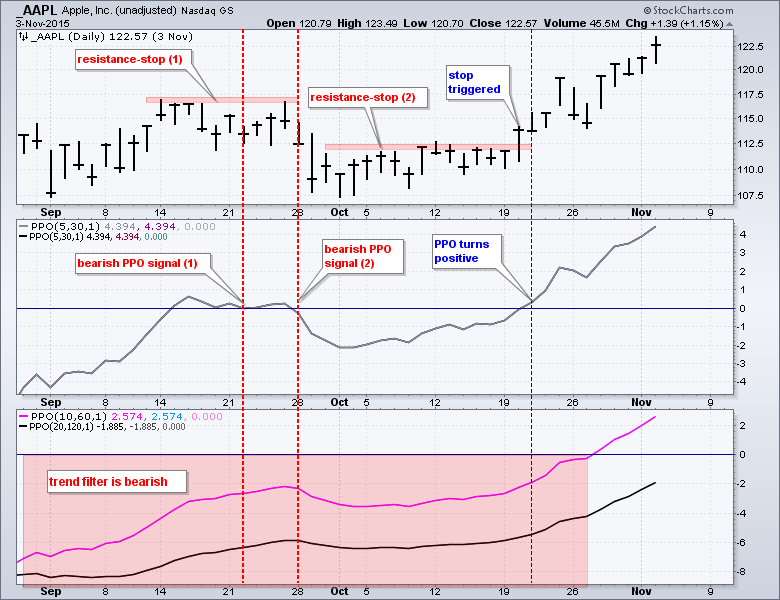
The first bad trade example shows Apple (AAPL) with a bearish trend filter in place during September and two bearish trend signals from the short-term PPO (5,30,1). The September highs were used for the first resistance-stop and the mid October highs were used for the second resistance-stop. AAPL closed above the second resistance-stop with a surge above 112.5 and the short-term PPO crossed back above the zero line the next day. Resistance was broken and the downtrend was reversed to trigger exits.
The second bad example shows Morgan Stanley (MS) with a bullish trend filter from April to July and a bullish trend signal from the short-term PPO (5,30,1). Also notice that MS broke wedge resistance a day earlier and this was when the short-term bullish setup was in play. MS moved above its June high and the signal was looking good. A higher high is usually a sign to raise the support-stop level and I chose the wedge breakout point. A strong breakout should hold and a weak breakout will fold.
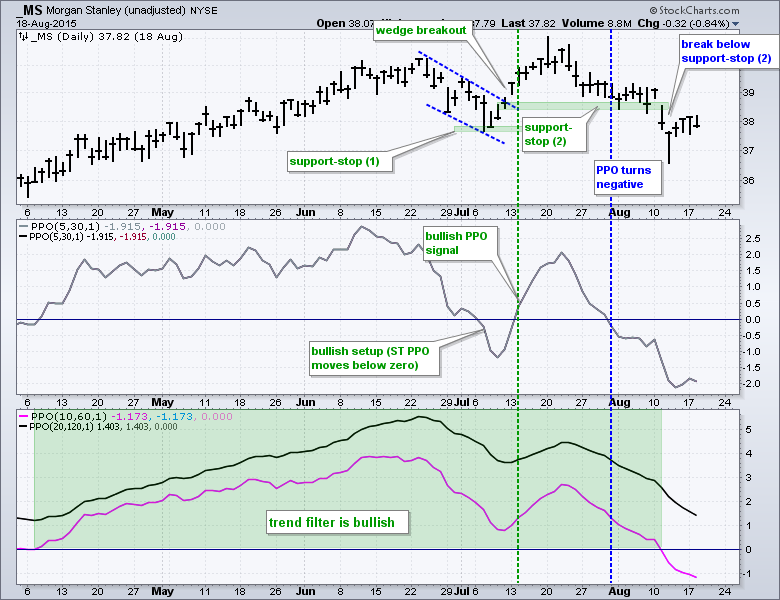
This higher stop was not necessary because the PPO (5,30,1) turned negative in late July and this would have acted as a trend stop. The short-term uptrend reversed and a short-term downtrend took hold. The second support-stop was hit the second week of August, which was just before the August meltdown. It was a bad trade, but it could have been much worst without an exit plan.
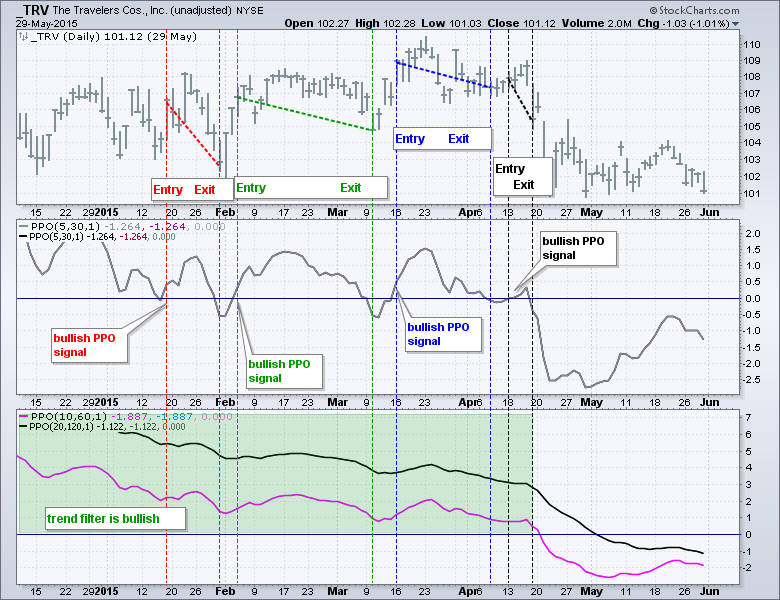
The third example shows Travellers (TRV) with four bad trades in a row from January to April 2015. Such a string would certainly tempt one to quit this system and look elsewhere. The grass, however, is not always greener on the other side. All trading strategies have their drawdowns and this trading strategy will not fit all traders because we are all different.
Conclusions and other Thoughts
The PPO strategy outlined above is a short-term trend-following strategy based on a trend filter and a trend or momentum signal. The aim is to participate in an uptrend by finding entry points after pullbacks or consolidations. Even though bearish setups were also detailed, keep in mind that playing the downside is riskier than playing the upside. Just ask traders who were caught short in early October 2015.
Though not discussed in this article, I would also consider adding a relative performance element to this trading strategy. There will be times when dozens of stocks fit the bullish trading criteria and we must further quantify the results. Adding a relative strength indicator, such as the StockCharts Technical Rank (SCTR), can filter out the weaker securities and help traders focus on the strong. This will further improve the odds for system success.
This trading strategy is designed to fit my trading style and philosophy. We are all individuals and this strategy will not be for everyone. There are, however, some basic building blocks here that can help traders develop their own strategy. First, a trading strategy should have a clear goal. Second, it should be relatively simple with just a few definable rules. Third, it should not be curve-fitted to each market or stock. Fourth, there should be a plan for position sizing to reduce risk. And finally, a trading strategy should have a positive expectancy. I am assuming there will be trends and this strategy can catch enough of these trends to be profitable. There are, of course, not guarantees.
New information: I ran backtests on the PPO using various settings and filters. The results are detailed in a System Trader article. In short, the trend filter for the individual stock did not help the results, but a broad market trend filter did help.
And finally, I cannot emphasise enough that traders should plan their trade and trade their plan. Traders, and investors for that matter, need a strategy and plan in place before they start trading or investing. Trying to "wing" it in the heat of the moment is never a good idea.
Thanks for taking the time to read this. There is a comment section at the bottom. Feel free to send any question or comments regarding this article. The last two sections covering scanning with the PPO and creating SharpCharts with the PPO.
Scanning with the PPO
Chartists can also create scans looking for PPO "setups" and PPO "signals". The bullish setup is present when the trend filter is bullish and the PPO (5,30,1) is negative or below 1%. A bullish signal triggers when the PPO (5,30,1) moves above zero or the PPO (5,30,5) moves above its signal line. Below is sample scan code for the bullish scan. The text after the two forward slashes describes each line. Note that the scan engine ignores text that is preceded by two forward slashes.
[PPO Line(20,120,1) > 0] and // trend filter is bullish
[PPO Line(5,30,5) x PPO Signal(5,30,5)] // ST PPO moved above signal line
[group is SP500] or [group is SP600] or [group is SP400] and
[PPO Line(20,120,1) < 0] and // trend filter is bullish
[PPO Signal(5,30,5) x PPO Line(5,30,5)] // ST PPO
PPO and SharpCharts
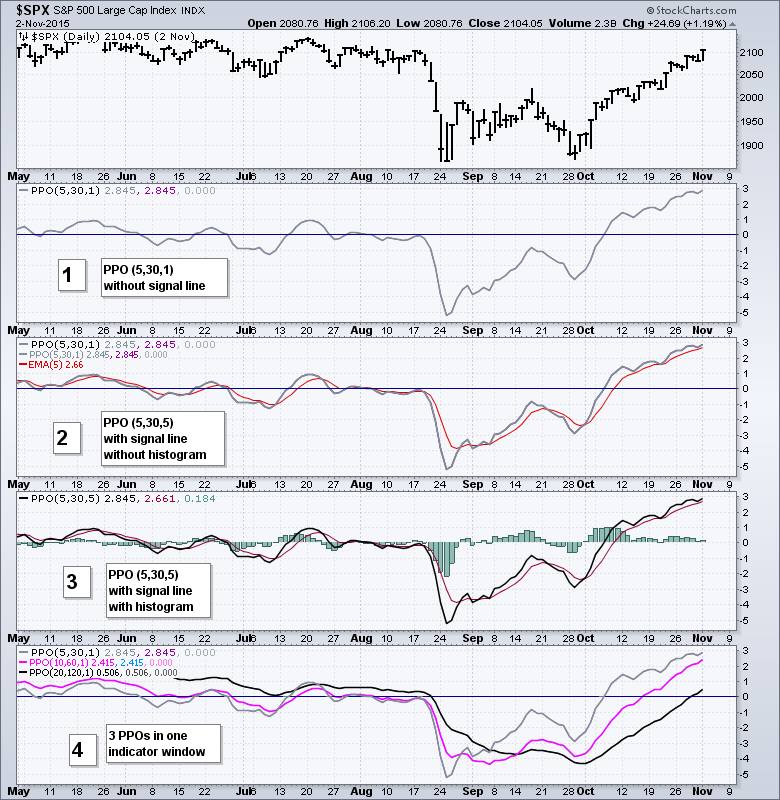
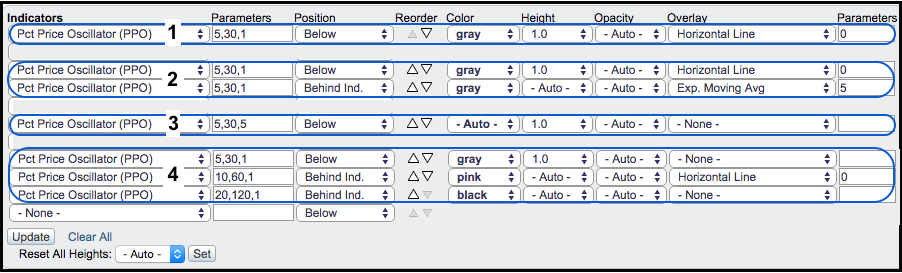
The chart below shows four different SharpChart settings used in this article.
- Number 1 is the simple PPO (5,30,1) without a signal line.
- Number 2 is the PPO (5,30,1) with an added signal line. A 5-period EMA was added as an overlay of the indicator using the "advanced options".
- Number 3 is the PPO (5,30,5) with a signal line and a histogram, which is the difference between the PPO and the signal line. The histogram is positive when the PPO is above the signal line and negative otherwise.
- Number 4 shows how to put all three PPOs in one indicator window. Position the first PPO "below" and then choose "Behind Ind" for the indicator position on the other two PPOs.
****************************************
Thanks for tuning in and have a good day!
--Arthur Hill CMT
Plan your Trade and Trade your Plan
*****************************************


