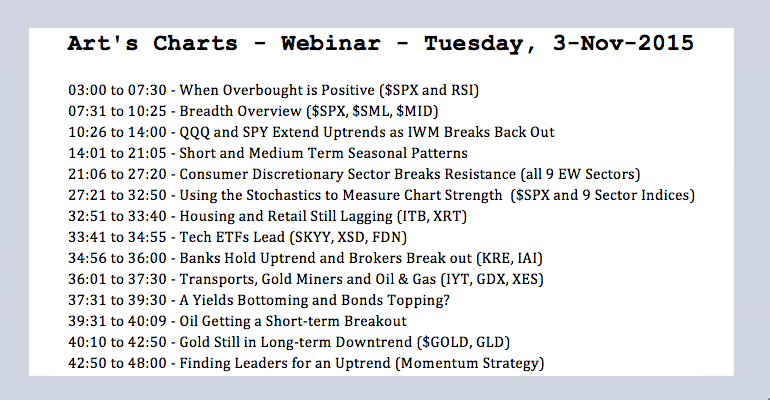
Highlights: AD Line Reflects Broad Market Strength // When Overbought is Positive // QQQ and SPY Extend Uptrends // IWM Breaks Back Out // Short and Medium Term Seasonal Patterns // Consumer Discretionary Sector Breaks Resistance // Housing and Retail Still Lagging // Oil Still Bearish // Webinar Highlights ////
AD Line Reflects Broad Market Strength
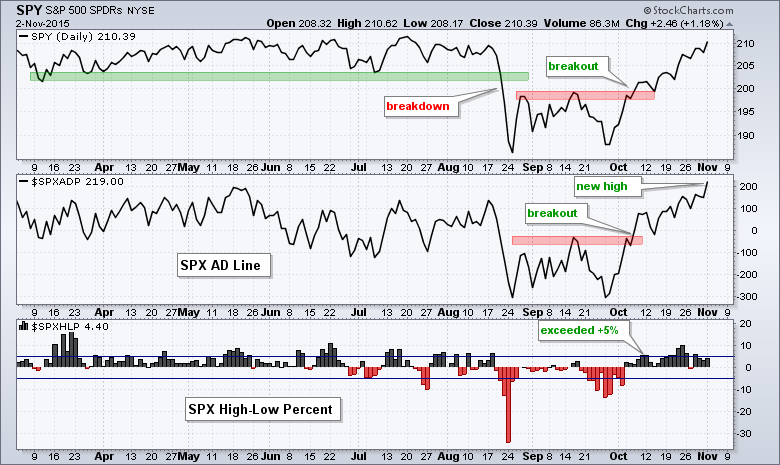
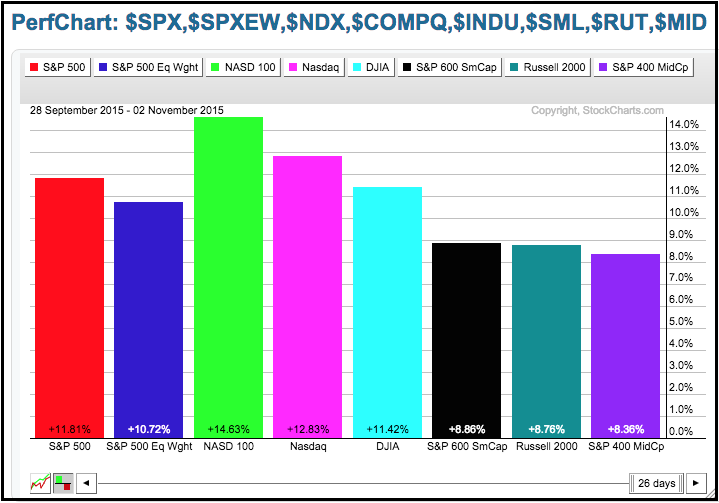
The broad market environment remains bullish for stocks. Note that the Nasdaq 100 hit a new high on Monday, the S&P 500 is within 2% of its all time high and the Dow Industrials is within 3% of its high. Small-caps lagged in October, but this fits with the seasonal patterns over the last twenty years. As detailed below small-caps leadership usually starts in November and extends into December. Elsewhere, the S&P 500 AD Line hit a new high and there are more new 52-week highs than new lows. Yes, I realized High-Low Percent is not that impressive, but the cup is clearly half full as long as new highs outnumber new lows.
When Overbought is Positive
The only negative out there is actually a positive. The broad market indices seem overbought and over extended after sharp advances the last five weeks, but it takes strong buying pressure to become overbought. This is a sign of market strength, not weakness. The S&P 500, S&P 500 EW Index, Nasdaq 100, Nasdaq and Dow Industrials are up more than 10% in five weeks. Admittedly, these are big moves in a short period of time and the market may need to digest its gains in the coming days or weeks. This condition, however, is a short-term issue.
QQQ and SPY Extend Uptrends
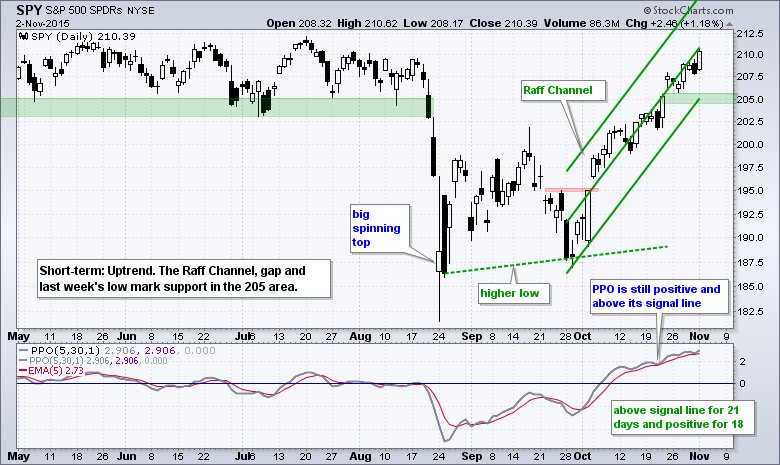
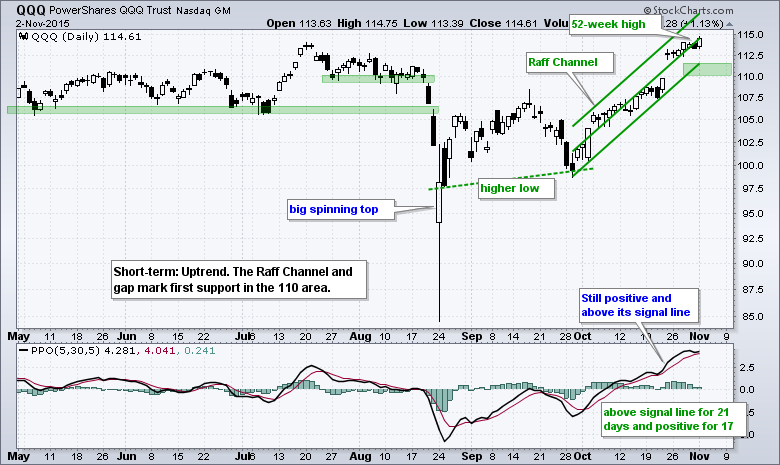
QQQ and SPY hit new highs for the short-term uptrend on Monday so I extended the Raff Regression Channels, which now extend from the late September closing low to Monday's closing high. The lower lines of the Regression channels and the mid October gaps mark the first support levels to watch. Keep in mind that this is just short-term support. While a break would reverse the short-term uptrend, the bigger trends are up and a pullback would be viewed as an opportunity.
IWM Breaks Back Out
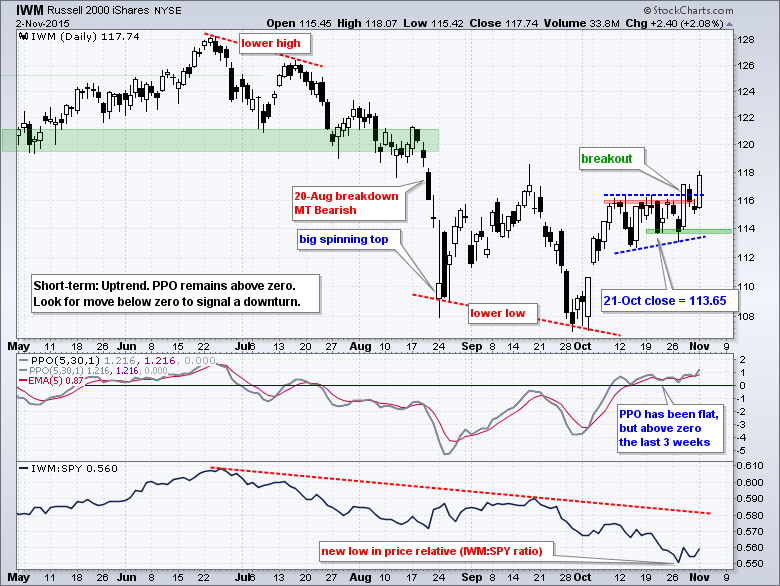
I pointed out the ascending triangle in IWM on October 26th and the ETF promptly fell to 114 the very next day. IWM did, however, hold above the mid October low and surged above short-term resistance two days later. There was a small pullback on Thursday-Friday and then another surge on Monday. Even though the long-term downtrend has yet to reverse, the short-term uptrend is holding and IWM even showed relative strength the last four days.
Short and Medium Term Seasonal Patterns
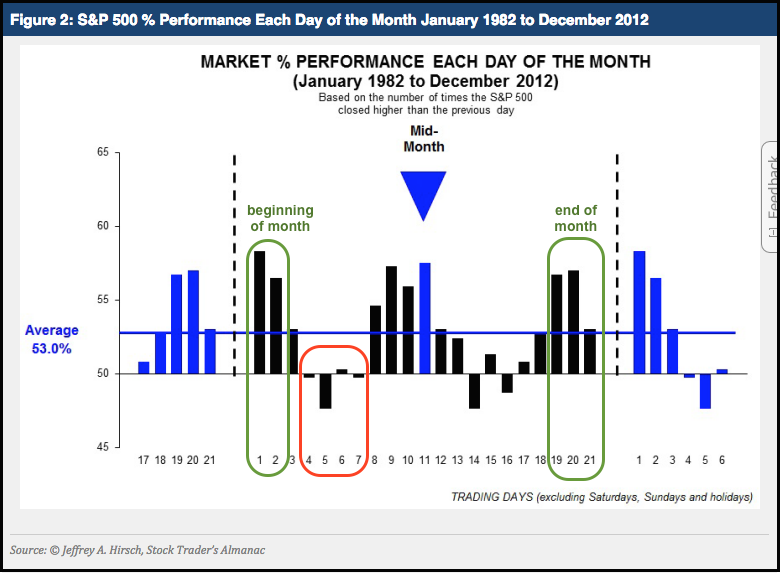
Before hitting some other charts, I would like to review a posting on seasonality from last week. The first is a short-term consideration that could foreshadow a period of softness in the stock market. The chart below comes from Fidelity and Jeffrey Hirsch (Stock Traders Almanac). It shows the performance for each trading day of the month from January to December. Even though the study end in 2012, I think the message is still valid: there is a bullish bias at the beginning, middle and end of the month. The blue line marks the average for all trading days and 53% of all days were up during this 20 year period. Histogram bars above this average show a stronger upward bias. Today is the second trading day of the month and there is an upward bias, but this bias will turn negative in the next few days.
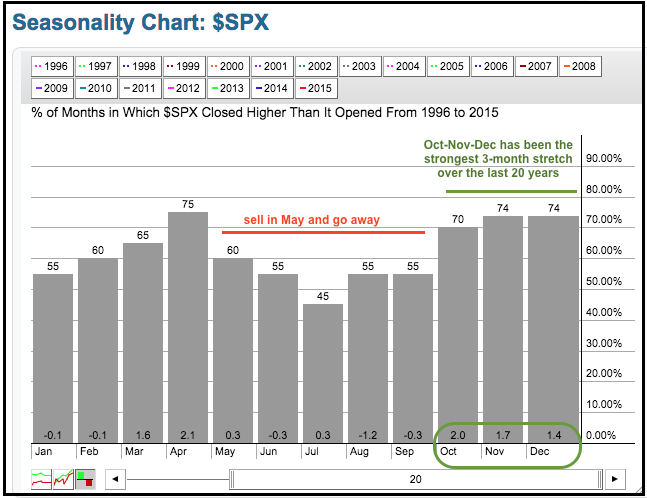
The second item concerns the six month cycle and relative performance in small-caps. These charts were also featured last week, but warrant review because small-caps could perk up soon. First, notice that S&P 500 seasonality runs bullish from October to April (seven months) and bearish from May to September (five months). Thus, the six month cycle is not as evenly divided over the last 20 years. Also notice that November and December are the second and third strongest months for the S&P 500. Even though we could see some short-term weakness, the seasonal patterns and trend suggest a strong finish to 2015.
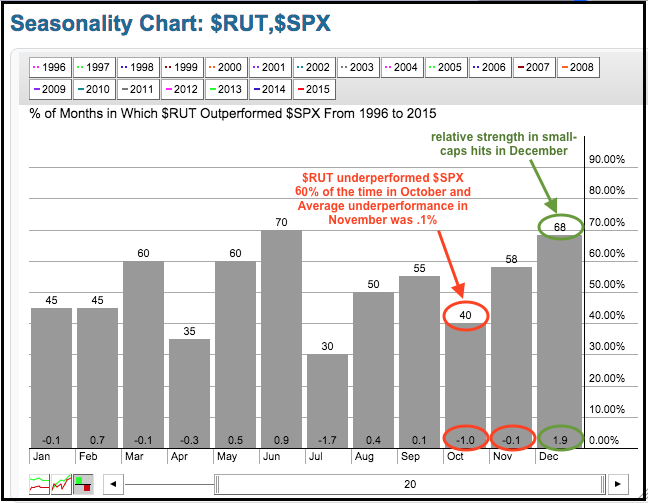
Relative performance in small-caps is the next thing to keep in mind going forward. Notice that the Russell 2000 underperformed the S&P 500 sixty percent of the time in October over the last 20 years. Thus, relative weakness in small-caps should not be that surprising. November is better as the Russell 2000 outperformed 58% of the time. Relative strength really hits in December because the Russell 2000 outperformed 68% of the time. Thus, the season for small-caps is approaching and we should keep an eye on the Russell 2000 iShares (IWM) and S&P SmallCap iShares (IJR).
Consumer Discretionary Sector Breaks Resistance
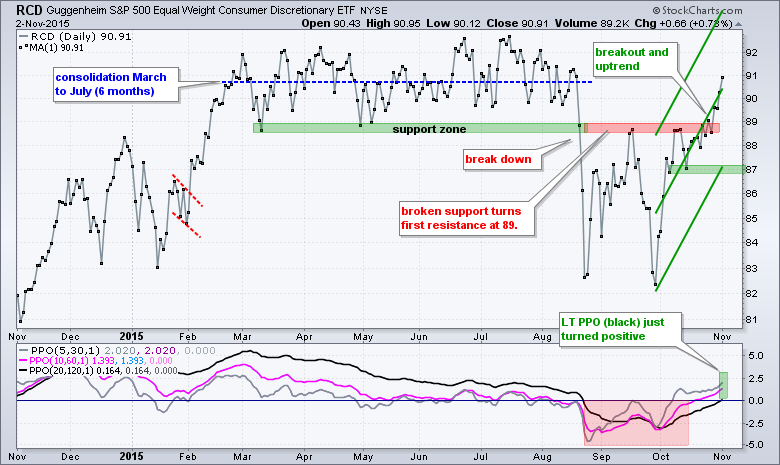
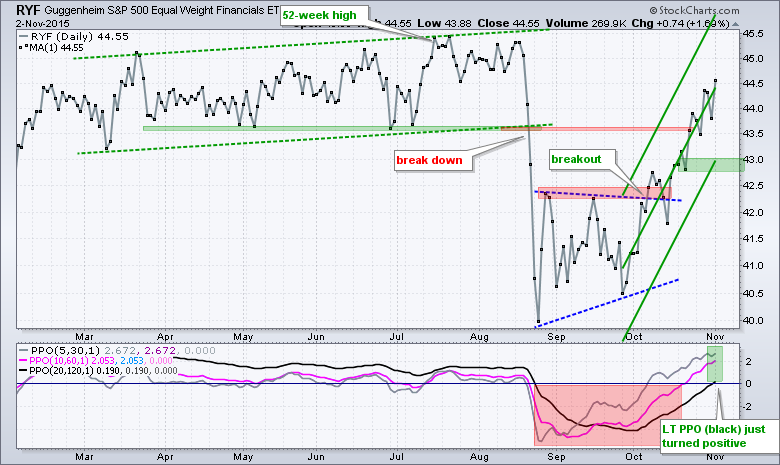
The EW Consumer Discretionary ETF (RCD) and the EW Finance ETF (RYF) continue to improve and this is positive for the broader market. Note that the EW Technology ETF (RYT) and EW Consumer Staples ETF (RHS) are the strongest of the nine equal-weight sectors overall. Add consumer discretionary and finance, and this means four of the nine sectors are strong right now. Moreover, these four sectors account for 54% of the EW S&P 500 ETF (RSP) and this means more than 50% of the market is strong. The first chart shows RCD breaking above 89 last week and surging to 91 on Monday. The Raff Channel and mid October lows mark support in the 87 area. The second chart shows the EW Finance ETF (RYF) with first support in the 43 area.
Housing and Retail Still Lagging
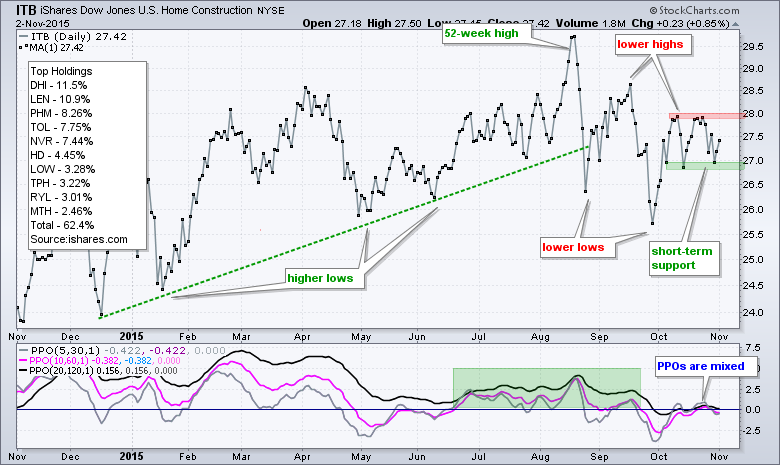
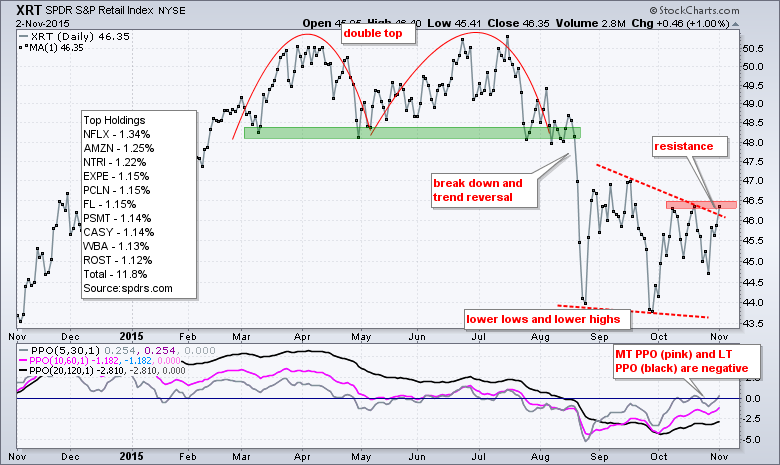
The Home Construction iShares (ITB) and the Retail SPDR (XRT) remain short of breakouts and continue to lag the broader market. ITB is in a downtrend since late August with lower lows and lower highs. The ETF surged to 28 in early October and then consolidated. A breakout at 28 is needed to reverse the downtrend here and put housing back on the bullish radar.
The Retail SPDR (XRT) got a big surge the last four days and is challenging resistance at 46.5. The ETF remains in a downtrend overall and this is the first resistance level to watch for a trend-changing breakout. Note that the medium-term PPO (10,60,1) and long-term PPO (20,120,1) are still negative. Also note that XRT shows relative weakness and has yet to even challenge its mid September high.
Oil Still Bearish
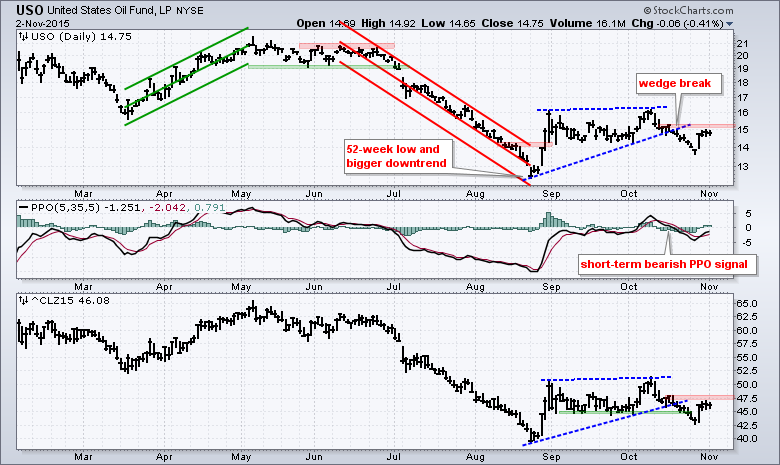
Oil surged last week and then stalled the last three days. Overall, I view the wedge break in mid October as bearish and this break has yet to be proven otherwise. Broken support and the October 16th highs were used to set resistance, and neither broke back above this level. USO needs to close above 15.5 to negate the wedge break and December Crude (^CLZ15) needs to close above 48.
Webinar Highlights
- Bonds and Gold Fall Back after Fed
- 10-YR Treasury Yield gets a little breakout
Click here to register.
****************************************
Thanks for tuning in and have a good day!
--Arthur Hill CMT
Plan your Trade and Trade your Plan
****************************************


