Mister Market is Mixed Up // QQQ Holds the Gap // Short-term PPO Holds for SPY // IWM Holds Support with Engulfing Pattern // %Above Indicators Trigger Bullish Signal // High-Low Indicators Turn Bearish // EW Finance, Technology and Staples are the Leaders // 4 PPO Strategy Charts /////
Mister Market is Mixed Up
The overall market is mixed and this is reflected in the charts for the big three: SPY, QQQ and IWM. We are also seeing mixed signals in the breadth indicators and sector performance is split. First and foremost, note that the long-term trends for SPY and QQQ area up, but the long-term trend for IWM remains down. Despite a downtrend, IWM is showing some medium-term strength and is testing short-term support. QQQ held short-term support and bounced on Monday. SPY broke short-term support and then bounced on Monday. Confused? So is mister market. Let's look at the individual charts.
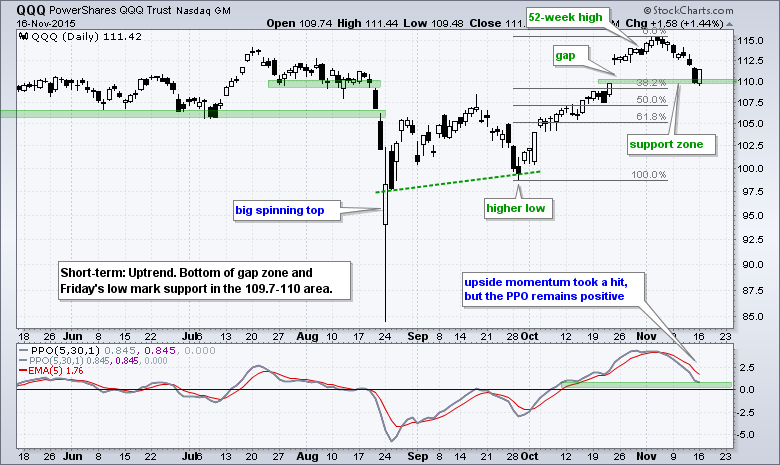
QQQ Holds the Gap
QQQ surged around 16% from the late September low to the early November high. The ETF was certainly entitled to a corrective period after such an advance and then declined around 5% from its high. A 5% decline is indeed substantial, but a 16% advance is even more substantial. The bulls still have the bigger edge. I marked initial support in the 109.7-112 area last week and QQQ closed at the bottom of the gap zone on Friday. The bottom of this support zone held as the ETF bounced on Monday. The indicator window shows the short-term PPO (5,30,1) moving below 1% and nearing the zero line. The short-term trend is still up because the PPO is positive.
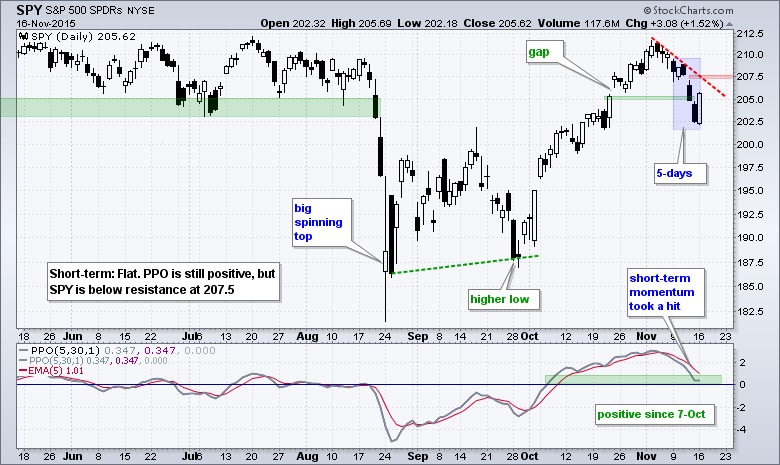
Short-term PPO Holds for SPY
I think it is important to put some objectivity into the analysis process and this is where the Percentage Price Oscillators (PPOs) come into play. The bigger trend is considered up when the PPO (10,60,1) and PPO (20,120,1) are positive. The short-term trend is up when the PPO (5,30,5) is positive. Note that all three PPOs remain positive for SPY. The PPO (5,30,5) fell back towards the zero line as momentum took a hit the last two weeks. This decline means the distance between the 5-day EMA and 30-day EMA narrowed. The 5-day EMA did not cross below the 30-day EMA because the PPO (5,30,5) is still positive. As noted in the PPO strategy article, a bullish setup emerges when the long-term and medium-term PPOs are positive and the short-term PPO moves below 1. This means we have seen a pullback within the bigger uptrend and pullbacks are viewed as opportunities, not threats. A move above the signal line would mark an upturn in momentum and this would be short-term bullish.
IWM Holds Support with Engulfing Pattern
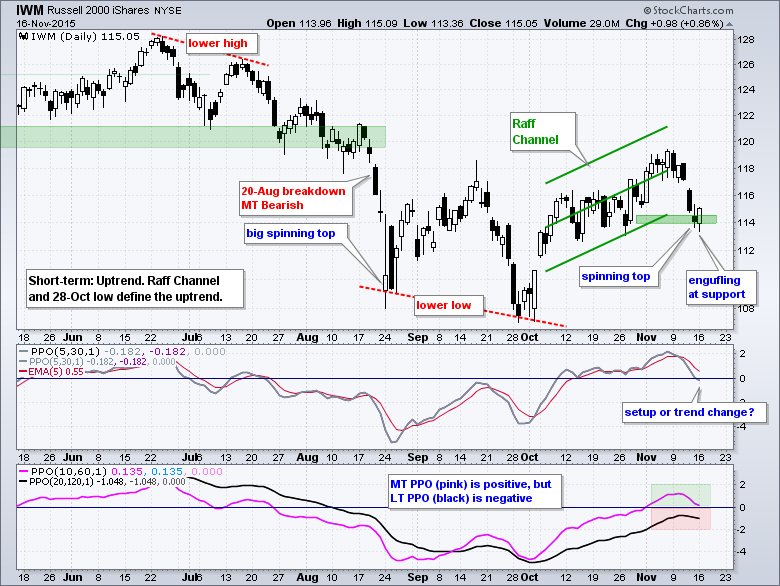
IWM is where it gets interesting, and complicated. The weekly trend indicators are all negative and it would likely take a close above 120 to make a long-term difference. The daily PPO (20,120,1) is also negative, but the medium-term PPO (10,60,1) is positive. Long-term trend reversals often happen in stages. The short-term trend is the first to change, the medium-term trend is the second and the long-term trend is the third. Sometimes the short-term and medium-term trends reverse, but the long-term trend does not and the medium-term reversal fails. This is the stage we are at now with IWM. Either we are in the early stages of a long-term trend reversal (upturn) or this medium-term uptrend is about to reverse down and join the long-term downtrend. A move below zero in the PPO (10,60,1) would be bearish. An upturn and move above zero in the PPO (5,30,5) would be bullish. On the price chart, IWM formed a spinning top at support on Friday and a bullish engulfing on Monday. The falling knife has flattened and may be about to bounce.
%Above Indicators Trigger Bullish Signal
If we are working under the assumption that the October surge reversed the long-term downtrend and the bigger trend is up, then short-term oversold readings in breadth indicators are viewed as opportunities. The chart below shows the percentage of stocks below the 20-day EMA for four major stock indices ($SPX, $MID, $SML, $NDX). All four dipped below 30% to become oversold on Friday and three of the four bounced back above 40% to turn bullish again on Monday. The Nasdaq 100 %Above 20-day EMA (!GT20NDX) was the only one not to turn bullish.
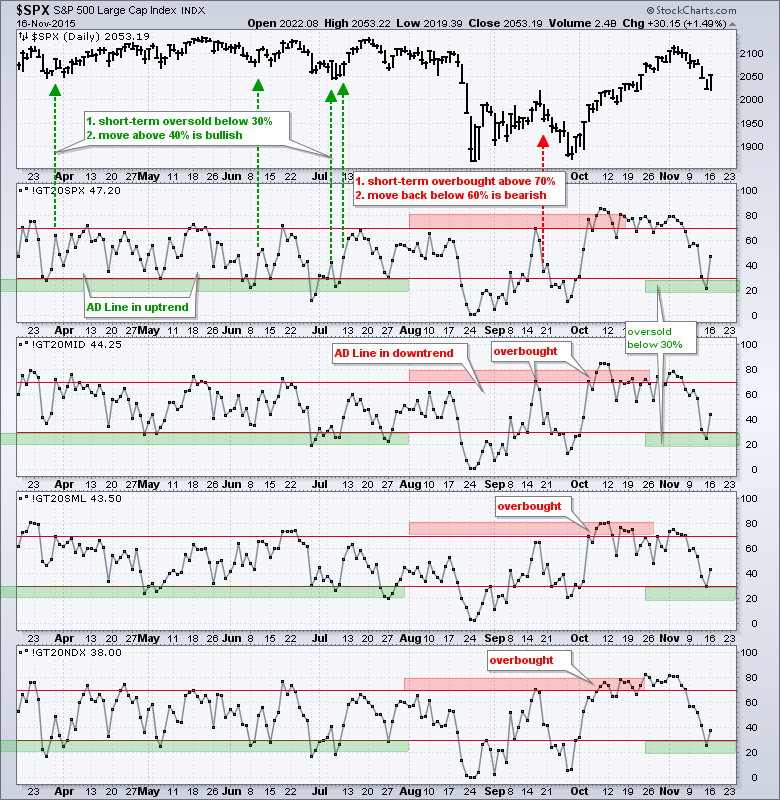
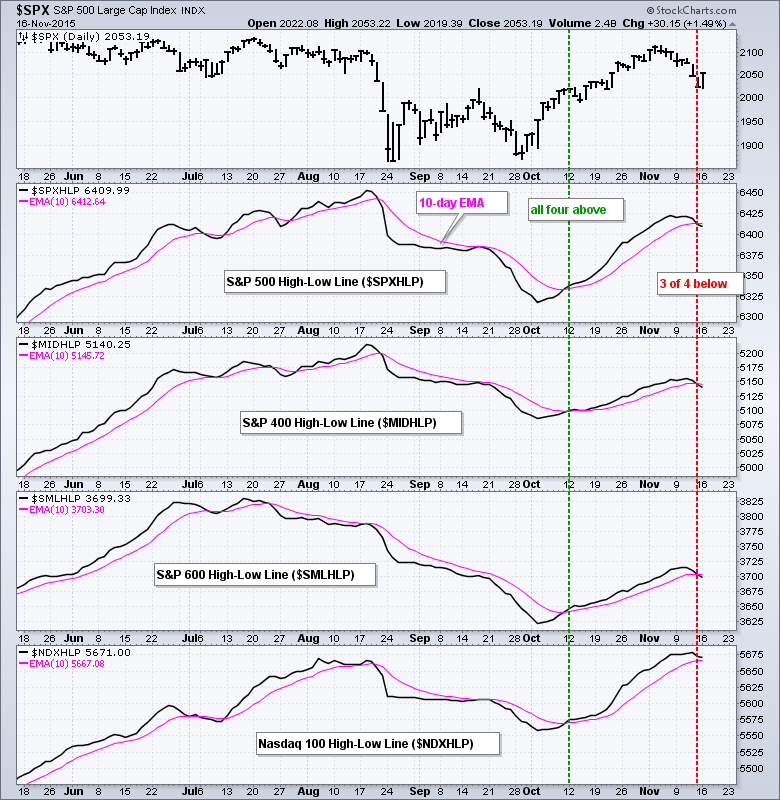
High-Low Indicators Turn Bearish
We did get some bearish signals in the High-Low indicators on Friday. The chart below shows the High-Low Lines for the same four indices. All four turned down last week and broke below their 10-day exponential moving averages over the last two days. I changed from SMAs to EMAs because the High-Low Lines are already quite smooth and the EMAs put more weight on recent data. The High-Low Lines are still close to their EMAs and it would not take much to turn them bullish again.
We also saw an expansion of new lows last week as High-Low Percent dipped below -5% for the S&P 500, S&P MidCap 400 and S&P Small-Cap 600. Nasdaq 100 HiLo% ($NDXHLP) finished at exactly -5% on Friday and has yet to trigger. The stubbornness of new lows is perhaps the biggest challenge facing the bulls right now. This tells us that there are some serious pockets of weakness in the market and this could weigh on the uptrends in the S&P 500 and Nasdaq 100.
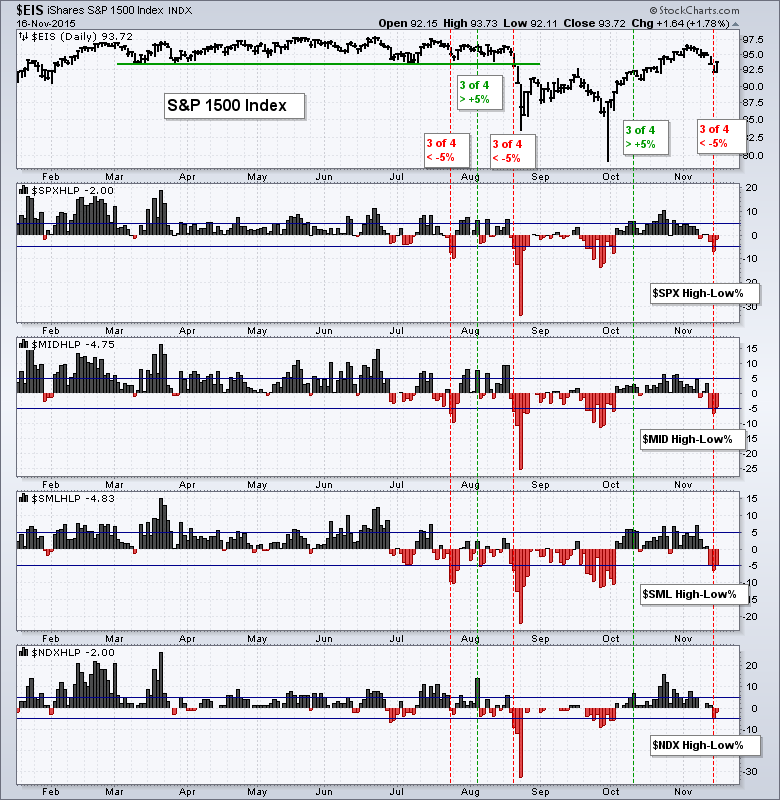
The other problem is that the consumer discretionary sector dominated the new low list last week. By my count, 32 of the 82 new lows (39%) from last week were from the consumer discretionary sector. This is not the sector we want to see leading the new low list. The most new highs came from the finance sector (24 of 50, which is almost 50%). I will show how to do these scans and calculations in today's webinar.
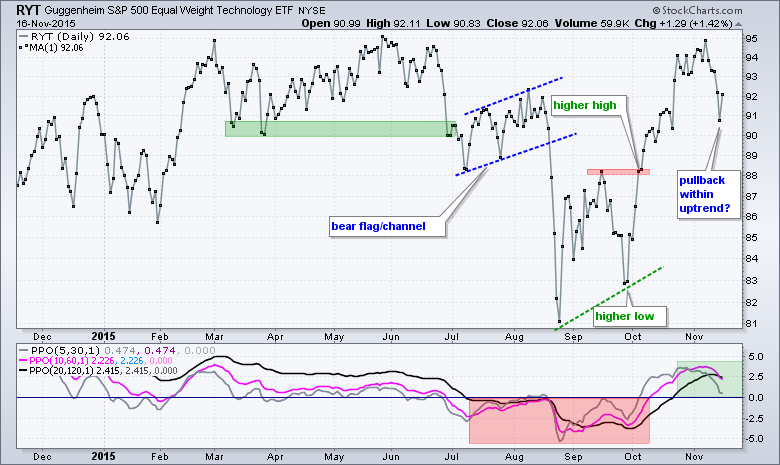
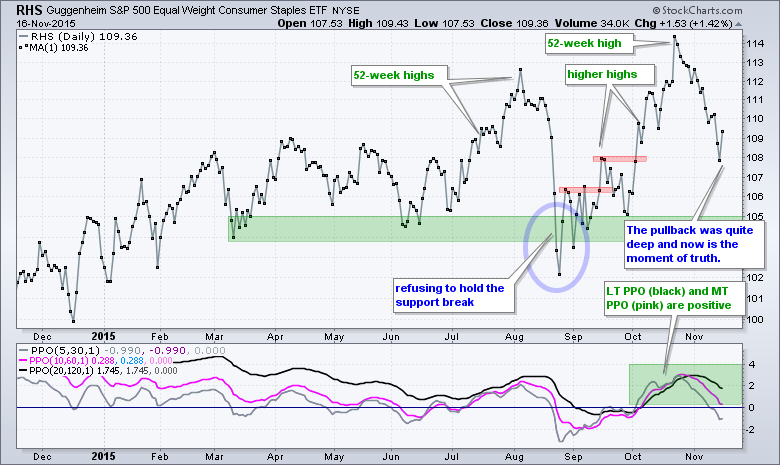
EW Finance, Technology and Staples are the Leaders
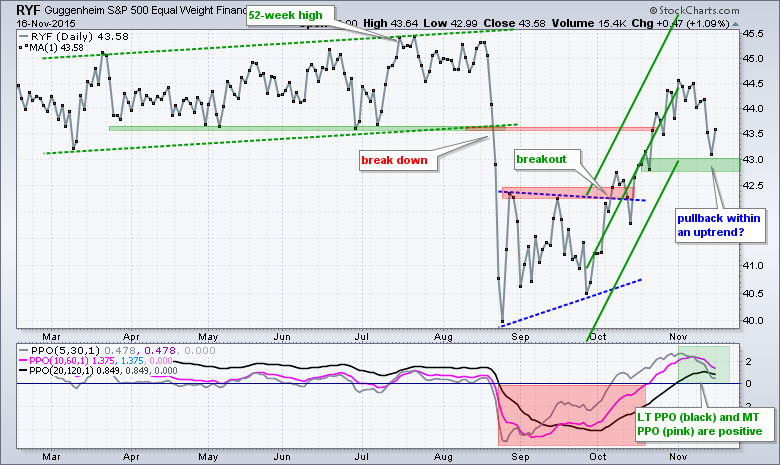
The equal-weight sectors are best used when gauging the strength of the sector as a whole. The sector SPDRs are better for trading because they are more liquid. They are also tilted towards large-cap stocks and large-caps represent the strongest style group right now. The EW Finance ETF (RYF), EW Technology ETF (RYT) and EW Consumer Staples ETF (RHS) are considered the strongest because their medium-term and long-term PPOs are still positive. These are the only three equal-weight sectors where both PPOs are still positive.
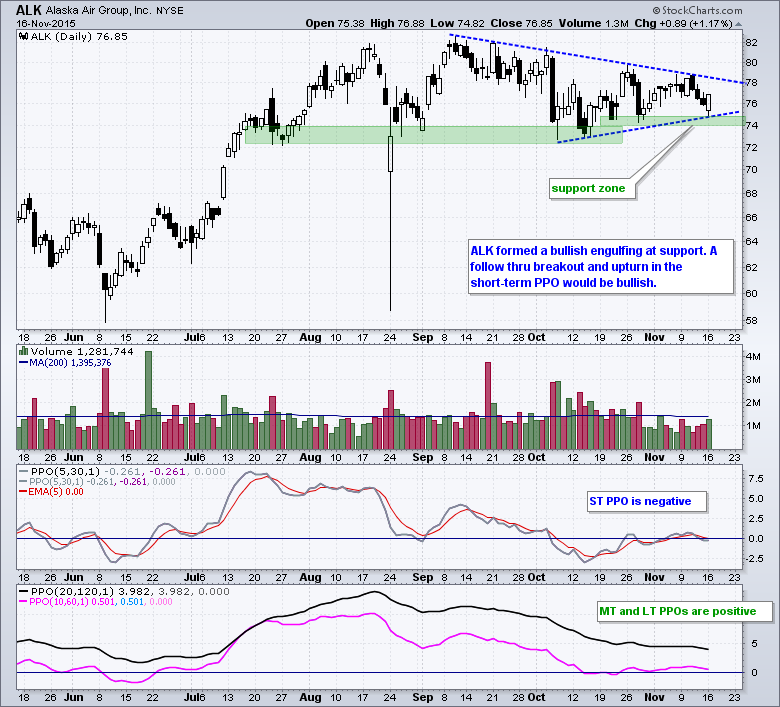
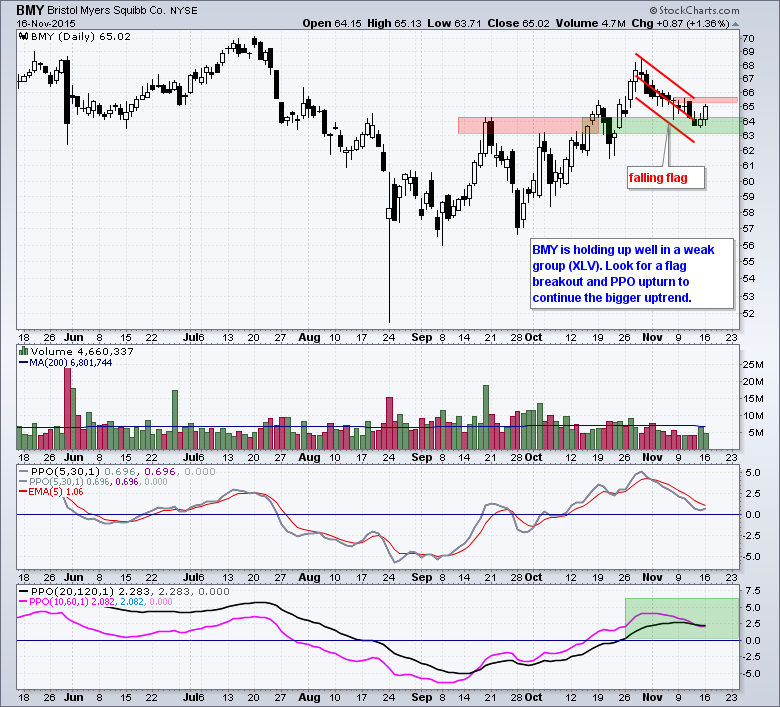
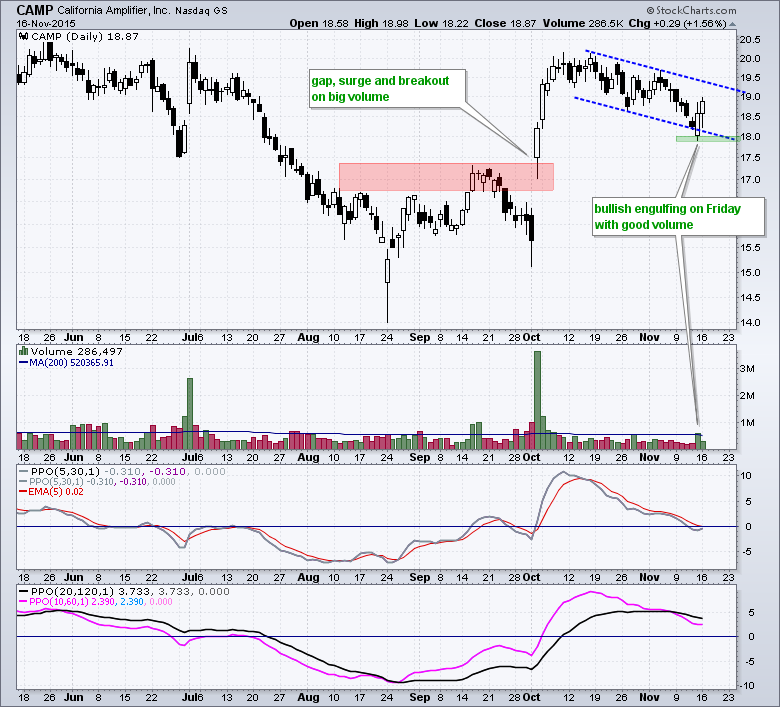
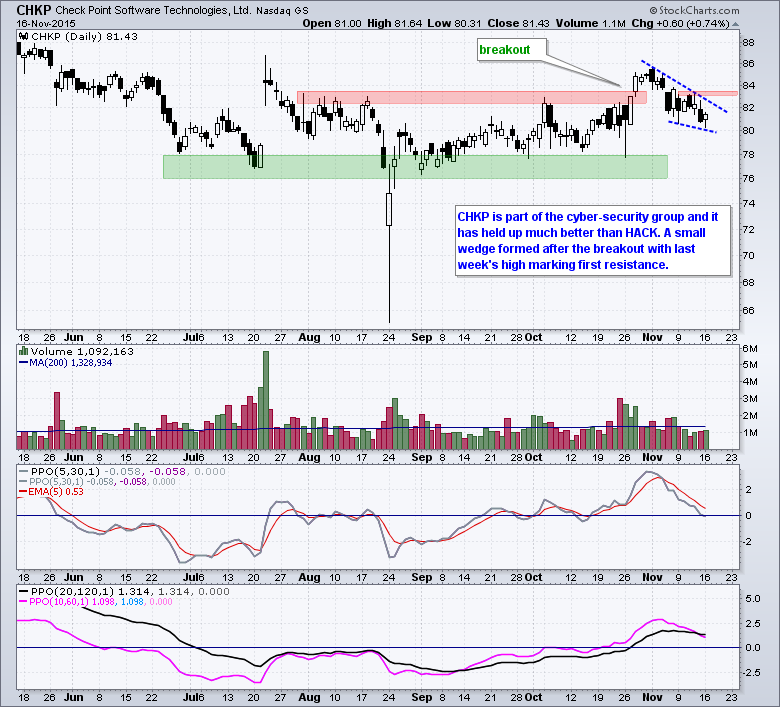
4 PPO Strategy Charts
The next four charts come from the PPO strategy scan, which was detailed in this article. Here are basic criteria. First, the stock is from the S&P 1500 (liquid). Second, the medium-term PPO (10,60,1) and long-term PPO (20,120,1) are positive (uptrend). Third, the short-term PPO (5,30,1) is below 1 and below its 5-period EMA (signal line). Basically, I am looking for pullbacks within an uptrend. These charts show bullish setups that would turn into signals when the PPO (5,30,5) moves above its signal line and-or into positive territory. I do not have percentages on how many are expected to be profitable, but I would guess that it is around 35%. What!? Less than 50% profitable! Yes, this kind of system that makes money by catching a few good trends and cutting losses on the losers. It is the nature of trend following. The system will not work if there are not any decent trends to be caught.
Click here to register for today's webinar, which is at 1PM ET (November 17th).

****************************************
Thanks for tuning in and have a good day!
--Arthur Hill CMT
Plan your Trade and Trade your Plan
*****************************************


