QQQ Continues to Lead // SPY Gets a Breakout // IWM Follows Through on Engulfing Pattern // Long-term Trend Change in Nektar // Uptrends Edge out Downtrends in S&P 1500 // New Lows Edge out New Highs // Market Themes // 5 PPO Setups ////
QQQ Continues to Lead
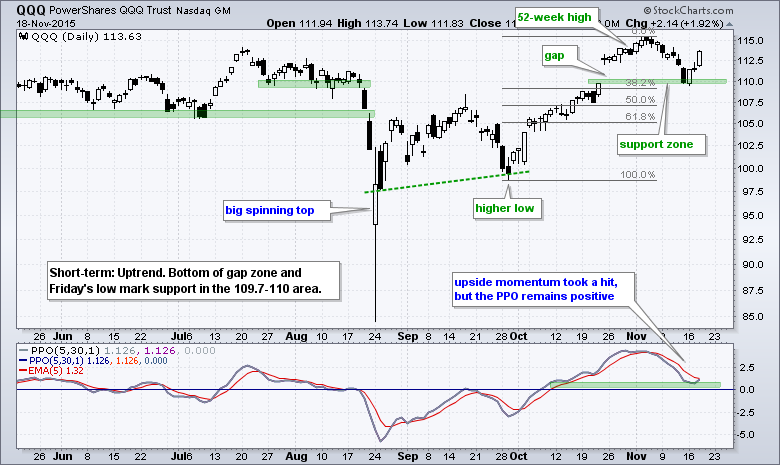
QQQ firmed at support on Monday with a piercing pattern and followed through on Wednesday with a surge above 112.50. The bigger trend was always up with the 52-week high in late October and the decline was viewed as a pullback within this uptrend. The bottom of the support zone held and the PPO (5,30,1) held above zero, which means the 5-day EMA held above the 30-day EMA. The PPO is now turning up and poised to break its signal line (which is the 5-day EMA of the PPO). With QQQ already 3% off its low, a signal line cross would come a little late for a short-term position. In a separate, but related note, Microsoft, Amazon and Google did not dip back into their gap zones and show some serious relative strength in November.
SPY Gets a Breakout
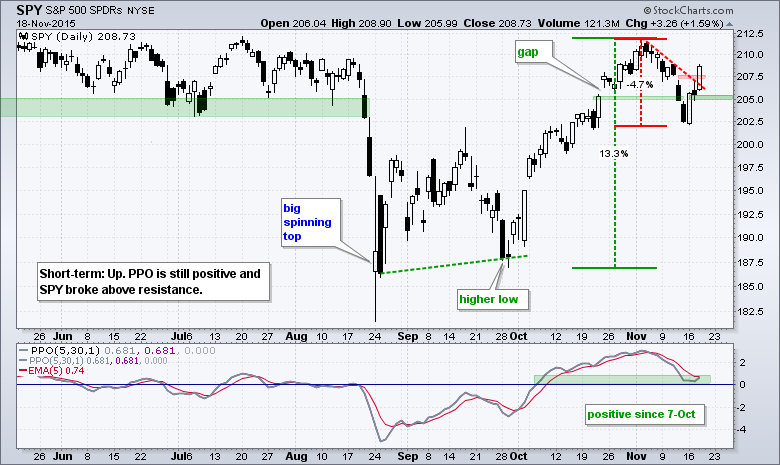
SPY formed a bullish engulfing on Monday, stalled below the November trend line on Tuesday and broke out on Wednesday. The bigger trend was already considered up and the 4.7% decline was considered a correction after a 13% surge. The surge clearly holds more sway than the correction. The PPO (5,30,1) held in positive territory and turned up as well. With this breakout, I will now set support at 205. It is a bit tight, but a strong breakout should hold and a close back below 205 would argue for a reassessment of this short-term breakout.
IWM Follows Through on Engulfing Pattern
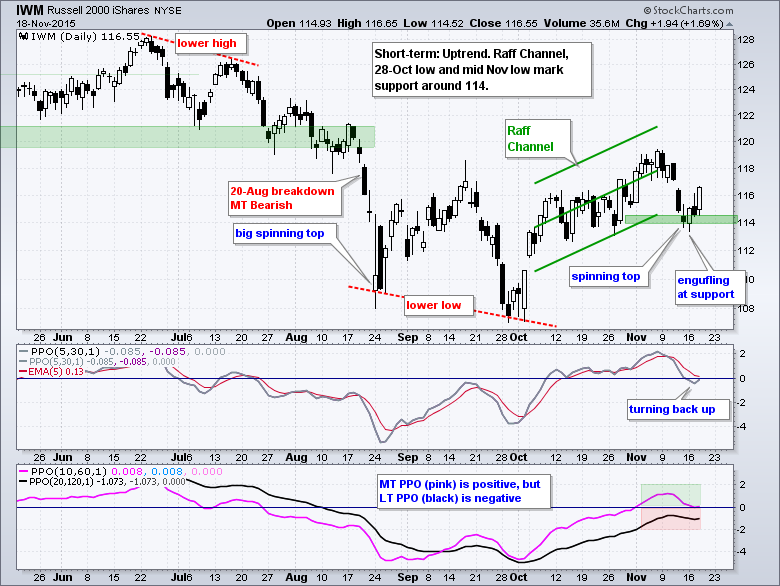
The Russell 2000 iShares (IWM) started showing some relative strength in Friday by forming a spinning top candlestick when SPY and QQQ formed long black candlesticks. IWM then formed a bullish engulfing to affirm support and confirmed the bullish engulfing with a surge above 116. The short-term uptrend has been kept alive with this successful support test. Also notice that the PPO (5,30,1) turned up and is poised to break into positive territory. This bounce also kept the PPO (10,60,1) from turning negative.
Long-term Trend Change in Nektar
Note that I updated the long-term trend article, added a video and provided some scan code. I doubled checked the scan code and did not get a syntax error. If you get a syntax error, it is a good learning experience to go line-by-line and debug. Those looking for a daily scan can simply remove the word "weekly" from each indicator. Feel free to adjust the parameters to suit YOUR analytical preferences.
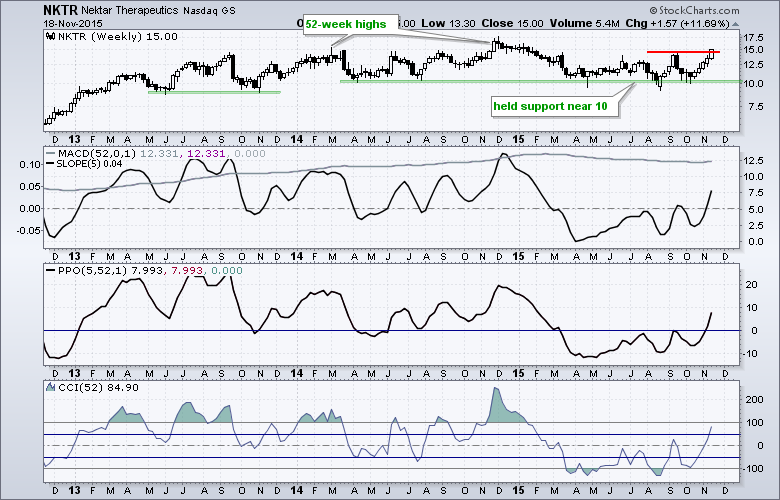
The chart above shows a result from a weekly scan based on Friday's close. As detailed in the article above, an uptrend starts when two of the three indicators turn positive. Nektar Therapeutics broke above its September high this week and all three trend indicators turned positive last week. Notice that there have been several trend signals because the stock has been flat for two and a half years and traded in the 10 to 17 range since December 2013. Sometimes, there is just no substitute for careful analysis of the price chart. The trend was up until November 2014 with higher highs and higher lows. Price action then flattened and the trend indicators turned negative in February-March 2015. The stock, however, did not break support in the 10 area (weekly close). This week's breakout is positive and suggests that the uptrend is resuming.
Uptrends Edge out Downtrends in S&P 1500
Based on the long-term trend indicators above, I scanned the S&P 1500 for uptrends and downtrends, and then broke the results down by sectors. As detailed in the article, the long-term trend is up when two of the three are positive and down when two of the three are negative. The scan returned 748 stocks (50.5%) in uptrends and 733 (49.5%) in downtrends. Some stocks did not make the scan because the look-back period was a year. Regardless, the numbers are quite split and this confirms the bifurcation in the broader market.
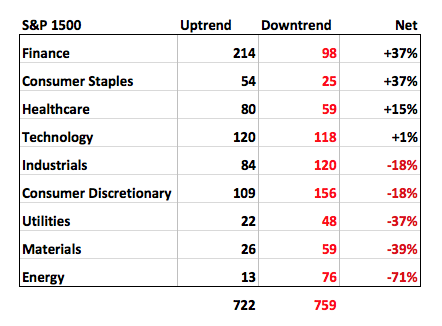
The S&P 1500 includes the S&P 500 (large-caps), the S&P MidCap 400 and the S&P Small-Cap 600. This means the S&P 1500 tilts towards small and mid caps because are the majority. It is a most interesting breakdown. Notice that finance, utilities and consumer staples are the strongest with the most uptrends. The net number is net uptrends ((uptrend - downtrend)/total)). Healthcare is also, surprisingly strong and technology is split. Energy and materials are by far the weakest with far more in downtrends than uptrends. Industrials and consumer discretionary show more downtrends than uptrends. Again the sectors reveal a split market: four with more uptrends, four with more downtrends and one on the fence (technology).
Market Themes
Bifrucation remains the major theme running through the broader market right now. Scanning through the S&P 1500, there were 63 new highs over the last five trading days and 80 new lows. Even though new lows are edging out new highs, there are still enough new highs to keep the market afloat. The number of new lows is obviously weighing on the broader market, but the number of new highs is still a positive force. The finance sector dominates the new high list with 26 (41% of total) and the consumer discretionary sector dominates the new low list with 29 (36% to total). Note that Amazon, Home Depot and Costco are bucking the consumer discretionary trend with new highs this week.
- S&P 1500: New lows (80) edging out new highs (63)
- S&P 1500: Long term uptrends (748) edging out downtrends (733)
- S&P 1500 High-Low Percent dipped below -5% on 13-Nov.
- Retail SPDR (XRT) is trending lower and lagging.
- Home Construction iShares (ITB) firmed, but has yet to break out and reverse.
- Seasonal patterns are bullish for stocks until yearend.
- January effect in play until yearend (small-caps historically outperform large-caps).
- Breakout in the 10-yr yield and breakdown in bonds (early November)
- Rising rates positive for Nikkei, banks, brokers and insurance.
- Rising rates negative for Yen, utilities and REITs.
- Dollar breakout (late October) - strong dollar is negative for commodities.
- Oil, NatGas, gold, silver, copper and aluminum are in long-term downtrends
- The S&P 500 weekly trend turned up 23-Oct.
- The Nasdaq 100 weekly trend turned up on 9-Oct.
- A bullish Zweig breadth thrust on 8-Oct.
- The Russell 2000 weekly trend turned down on 21-Aug (and remains down).
- Small-caps have been lagging since July (but leading since 27-Oct)
5 PPO Setups
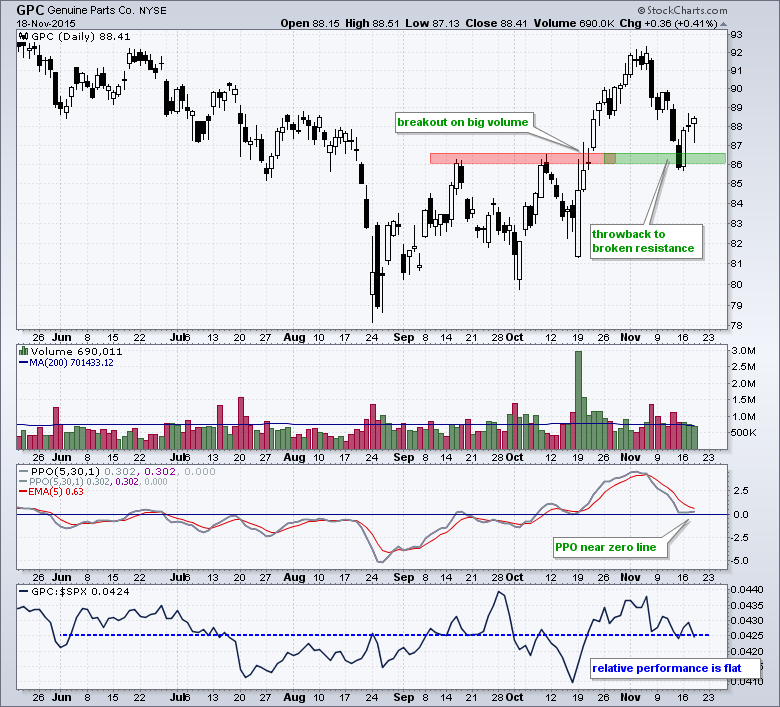
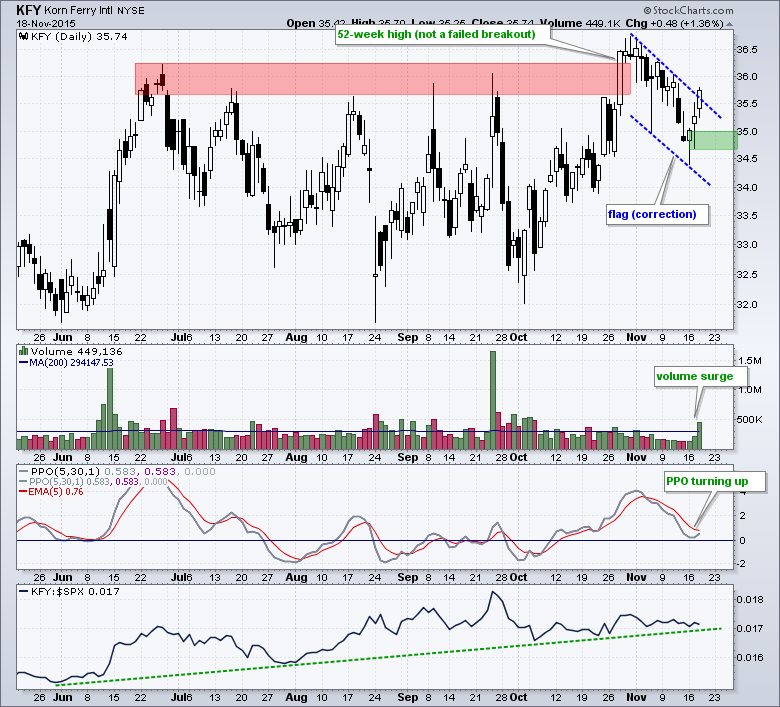
The next group of charts were selected from today's PPO scan, which is based on three criteria and detailed in this article. First, the stock is part of the S&P 1500 (liquid). Second, the PPO (10,60,1) and PPO (20,120,1) are positive (uptrend overall). Third, the PPO (5,30,1) is below 1 and below its 5-period EMA (pullback). Overall, I am looking for corrections within an uptrend. The scan returned 148 stocks and I selected less than 10% as potential candidates. This group was culled even more after looking at the larger charts and indicators. Keep in mind that this scan is the first cut and a visual inspection of the chart provides the second cut. I can quickly scan 148 charts using the CandleGlance option for viewing a ChartList. Check out the video tutorials on how to manage and view ChartLists for more info. The ChartList section is in the bottom half of the page.
****************************************
Thanks for tuning in and have a good day!
--Arthur Hill CMT
Plan your Trade and Trade your Plan
*****************************************


