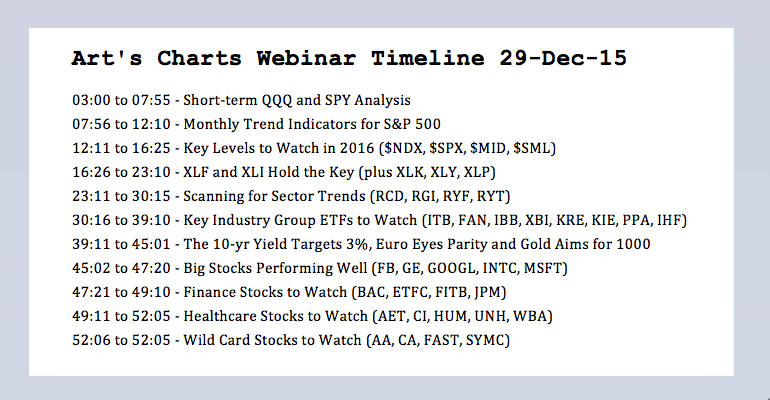
Monthly Trend Indicators for S&P 500 // Key Levels to Watch in 2016 ($NDX, $SPX, $MID, $SML) // The 10-yr Yield Targets 3% // Euro Eyes Parity // Gold Aims for 1000 // Webinar Topics, ETFs and Stocks ////
Today's commentary and webinar will use long-term charts to extrapolate some trends that we may see in 2016. As Yogi Berra says: "It's tough to make predictions, especially about the future". Truth be told, a forecast is just an educated guess. As chartists, we need to continuously re-evaluate the technical picture as new data becomes available. The following charts will consider some trends, signals and levels to watch in 2016. I am not going to cover materials, energy, coal, oil and other groups that remain in strong downtrends because this is not a bottom picking exercise. We will probably see a bounce in oil next year, but I have not idea when that bounce will occur.
Monthly Trend Indicators for S&P 500
I will start with the S&P 500 and some monthly trend indicators, which are very similar to the weekly trend indicators (click here). The PPO (1,12,1) measures the difference between the 1-period EMA and the 12-period EMA. It is positive when the monthly close is above the 12-period EMA and negative otherwise. The 2-period Slope of MACD (12,0,1) measures the slope of a 12-period EMA. It is positive when the slope is rising and negative when the slope is falling. CCI(12) favors an uptrend when positive and a downtrend when negative. The trend is up when two of the three are positive and down when two of the three are negative. Chartists can use these indicators for all types of ETFs (index, sector, industry group, commodity, bond or currency). It is not a perfect system, but it does a pretty good job of defining the long-term trend.
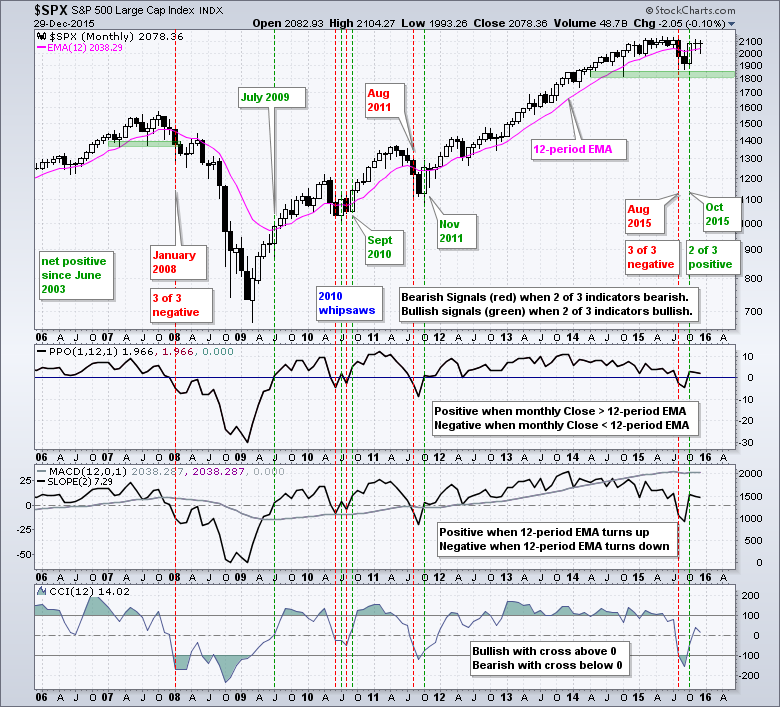
The S&P 500 has triggered 10 signals in 10 years. While this represents an average of one per year, note that there were four signals in 2010 because of some extraordinary volatility. Going back 12 years, this long-term trend system caught three big trends. The indicators were net positive from June 2003 to December 2007, net negative from January 2008 to June 2009 and net positive from November 2011 to July 2015. The indicators went net negative in August 2015 and back to net positive in October 2015. Notice that all three indicators are quite close to zero and it would not take much to push them back into negative territory. It seems that a monthly close below 1990 would be enough to tilt the balance back to the bears.
Bear Markets, Corrections and Pullbacks
While I realize that we cannot define a bear market simply based on the percentage decline, we should keep in mind how far down we are from a recent high. Typically, the financial media defines a bear market as a decline that exceeds 20%. Noise is anything less than 5%, a pullback ranges from 5 to 10 percent and a correction is something between 10 and 20 percent. For reference, note that Josh Brown (www.thereformedbroker) posted a Field Guide to Market Corrections right after the August plunge.
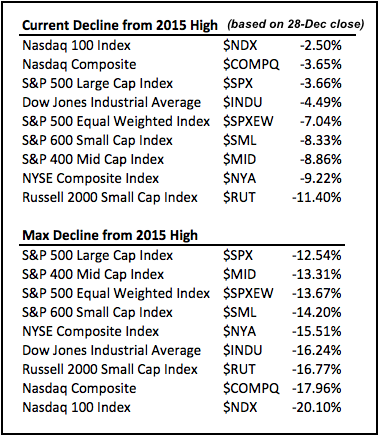
In any case, we can figure out what kind of year it has been by comparing the 2015 high with the current level and the low of the year. The top table shows that the large-cap indices are down less than 5% from this year's high, which was a 52-week high. I do not see how we can be in a bear market when the Dow, S&P 500, Nasdaq 100 and Nasdaq are less than 5% from 52-week highs. At its nadir, the S&P 500 was down around 12.5% in late August. Even though the late August decline seemed drastic, the S&P 500 held above its October 2014 low and was never down more than 15%.
Small-caps, of course, are a different story. Using the Russell 2000 as the benchmark for small-caps, the index is currently around 11.40% from its 2015 high and was down 16.77% at its nadir in August. Again, these declines are not small, but neither are they huge. Note that the Nasdaq 100 and Nasdaq were down the most in late August as both overshot on the downside. I imagine that this was driven by a few large-cap stocks that spiked lower on August 24th and quickly recovered (AAPL, INTC, GILD, FB, TSLA, CMCSA, CELG, COST, SBUX, BIDU, ESRX, KHC)
Key Levels to Watch in 2016
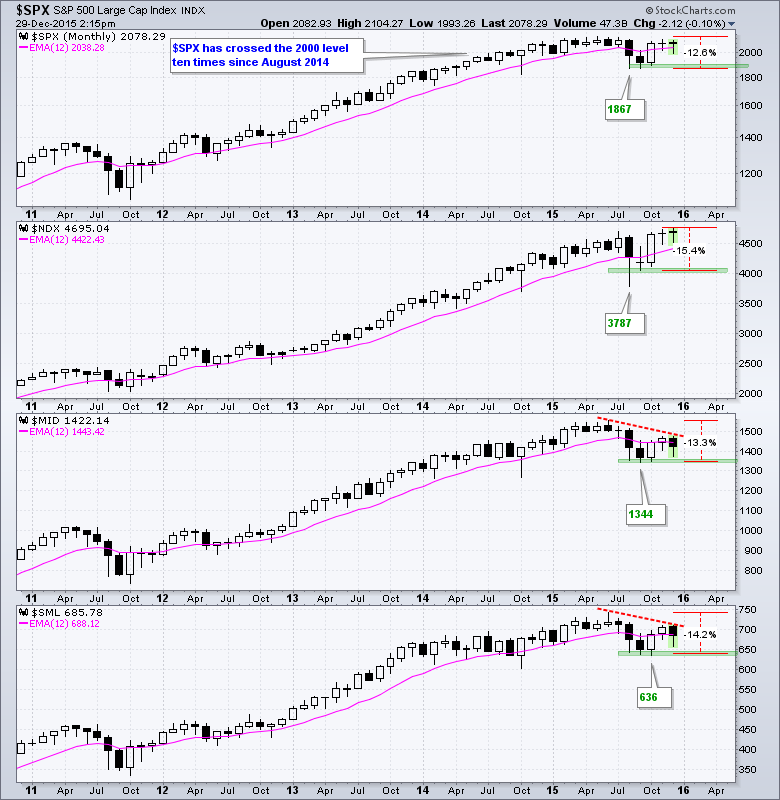
The next chart shows the S&P 500, Nasdaq 100, S&P MidCap 400 and S&P Small-Cap 600 together. A bear market is when the majority of these indices are in long-term downtrends and a downtrend is defined as a lower high and a lower low. These indices fell sharply in August and established reaction lows (troughs) in August-September. The Nasdaq 100 rebounded to a new high and the S&P 500 is close to its high, but the S&P MidCap 400 and S&P Small-Cap 600 fell well short of their prior highs. Even though small-caps and mid-caps are lagging and have lower highs working, large-caps and large-cap techs are holding up quite well. I do not think we can have a true bear market unless the S&P 500 and Nasdaq 100 break down. Thus, I would still have a bullish bias on stocks heading into 2016. Here are the key levels to watch. The bears take over if the S&P 500 closes below 1867 and the Nasdaq 100 closes below 4000. The bull market will expand if the S&P Small-Cap 600 closes above 712 and the S&P MidCap 400 closes above 1475. These closing levels are based on the monthly candles or bars (not daily or weekly).
10-yr Yield Targets 3%
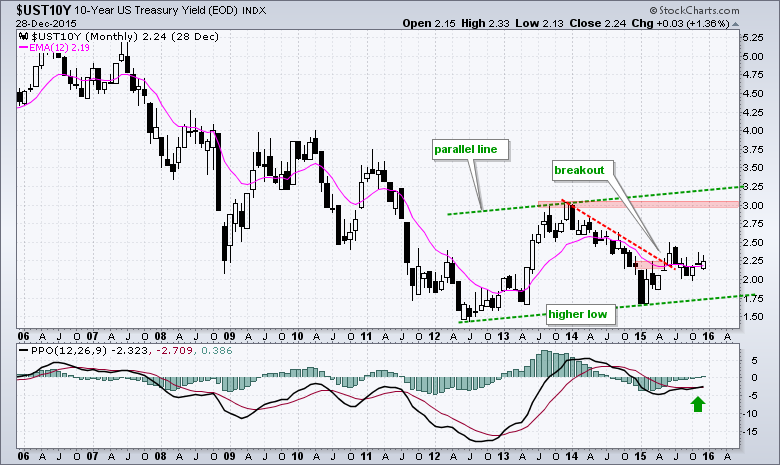
Yes, you read right. This forecast is based on a chart extrapolation using the current trend, as I see it. The 10-YR Treasury Yield ($UST10Y) formed a higher low from mid 2012 to early 2015 and reversed the 2014 downtrend with a breakout near 2.25%. The 2013 highs mark the next target in the 3% area and a parallel channel targets a move above 3%. Monthly MACD moved above its signal line in December and momentum is improving. I would re-evaluate on a close below 1.95%.
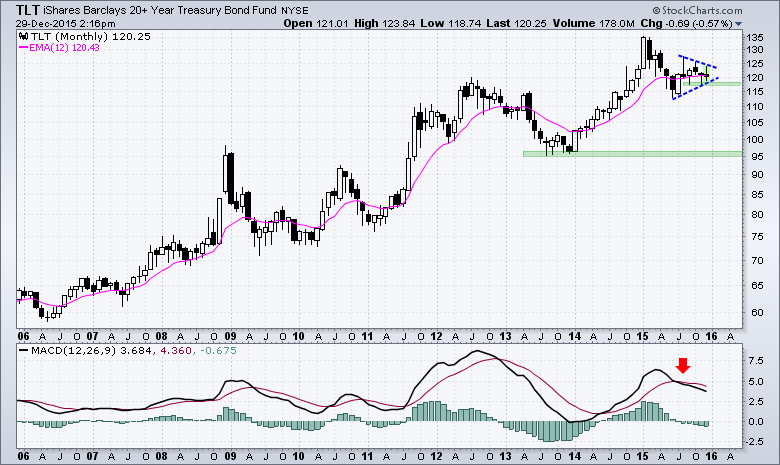
A rise in the 10-yr yield would be quite negative for treasury bonds and the 20+ YR T-Bond ETF (TLT). Technically, TLT is still in an uptrend because it hit a new high in January and remains well above the prior reaction low (95). The ETF fell sharply from February to June and then stalled with a triangle. This could be a mere consolidation or rest after the decline. A move below 117 would break triangle support and target a move towards the 95 area.
Euro Aims for Parity
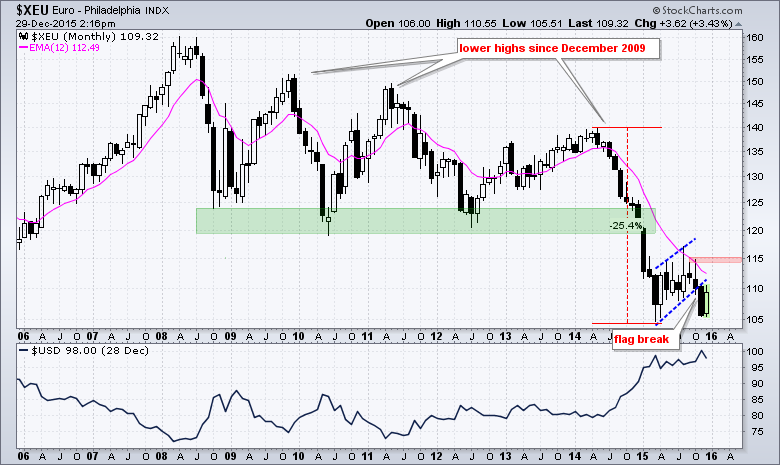
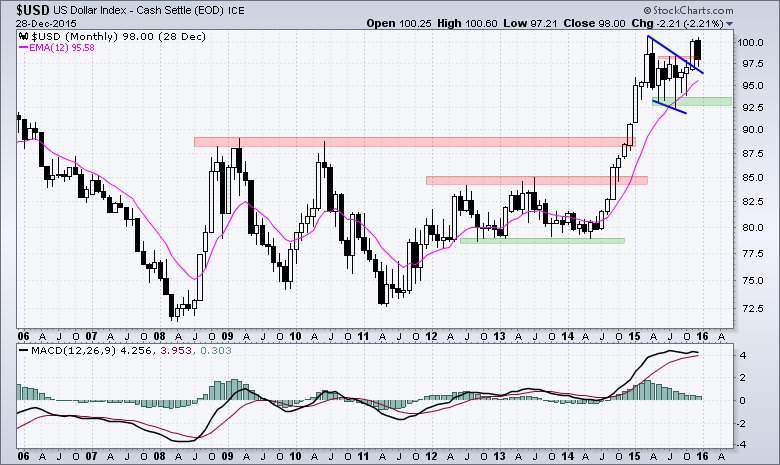
The Euro Index ($XEU) has been in a long-term downtrend for years and I expect a continuation lower after the December flag break. The index became way oversold after a 25% decline in 2014 and bounced with a rising flag in 2015. I consider this a flag because of the candlestick count. It extends seven candlesticks and this makes a relatively small pattern on the overall chart. The flag break signals a continuation of the 2014 decline and projects a move to new lows. The Euro accounts for around 57% of the Dollar Index ($USD) so a bearish forecast for the Euro equates to a bullish forecast for the greenback.
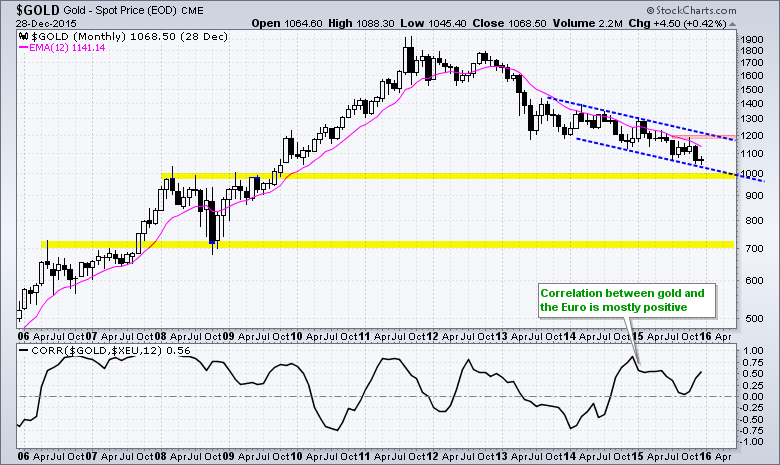
Gold Gravitates toward 1000
This is not much of a forecast because gold is in a long-term downtrend and is currently around 6.5% from 1000. Gold peaked around 1900 in the summer of 2011, stalled into 2012 and broke down in 2013. The decline since 2013 has been rather steady with a clearly defined downtrend. I see nothing but lower lows and lower highs the last two and a half years. The lower trend line extends to the 1000 area mid year and resistance in 2008-2009 marks potential support here. My guess is that we will see an acceleration lower and selling climax before this decline exhausts itself. I would re-evaluation on a close above 1200. By the way, first targeted 1000 Dollar gold in July 2013 in a ChartWatchers article.
Other Webinar Topics
- Finance and Industrials Hold the Key
- Healthcare, Technology and Staples Remain Strong
- Industry Group ETFs to Watch (ITB, FAN, IBB, XBI, KRE, KIE, PPA, IHF)
- Big Stocks Performing Well (FB, GE, GOOGL, INTC, MSFT)
- Finance Stocks to Watch (BAC, ETFC, FITB, JPM)
- Healthcare Stocks to Watch (AET, CI, HUM, UNH, WBA)
- Click here for the webinar recording
Links
PPO Trading Strategy - How to use 3 PPOs to develop a trend-reversion trading strategy.
Long-term Trend Indicators - Using the PPO, EMA Slope and CCI to determine the trend.
ETF Master ChartPack - 300+ ETFs organized in a Master ChartList and in individual groups.
Follow me on Twitter @arthurhill - Keep up with my 140 character commentaries.
****************************************
Thanks for tuning in and have a good day!
--Arthur Hill CMT
Plan your Trade and Trade your Plan
*****************************************


