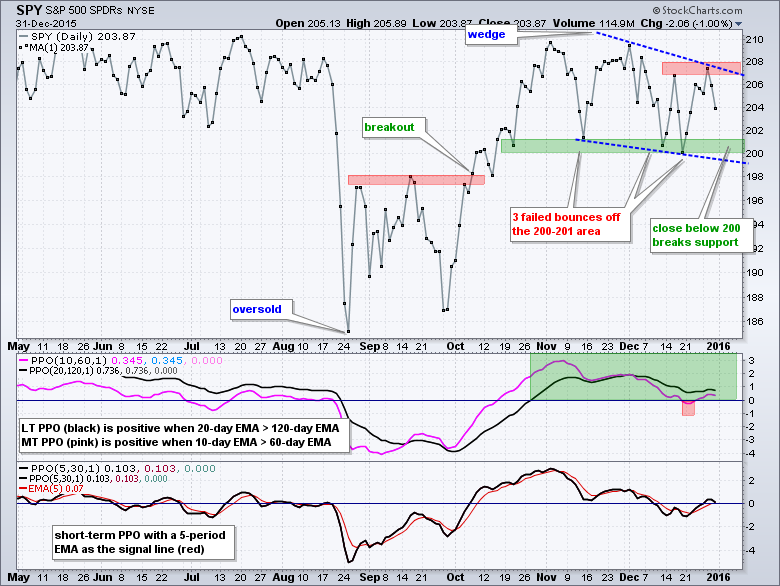
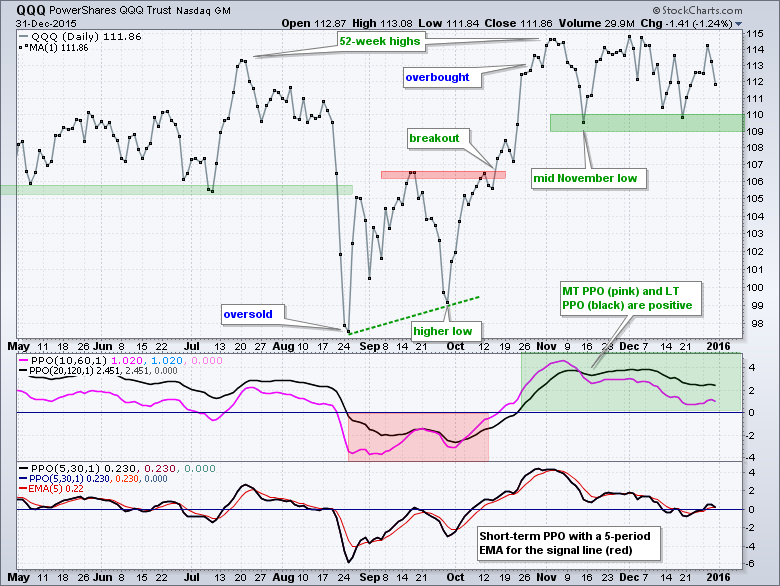
Once again, we have small-caps and mid-caps breaking down and weighing on the market. This is nothing new because the Russell 2000 iShares (IWM) and S&P MidCap SPDR (MDY) have been lagging the S&P 500 SPDR (SPY) and Nasdaq 100 ETF (QQQ) for the last six to nine months. QQQ hit a new high in late November and SPY challenged its summer highs in early November. IWM and MDY, on the other hand, fell well short of their summer highs and formed lower highs in late 2015. These two broke down again in mid December and remain under selling pressure. QQQ and SPY were range bound in November-December and both are setting up for important support tests as we begin 2016. The summary view below is sorted by the StockCharts Technical Rank (SCTR) and shows the one year percentage change for the major index ETFs. Notice that all the small and mid cap ETFs were down last year and the small-cap SCTRs are all below 40.
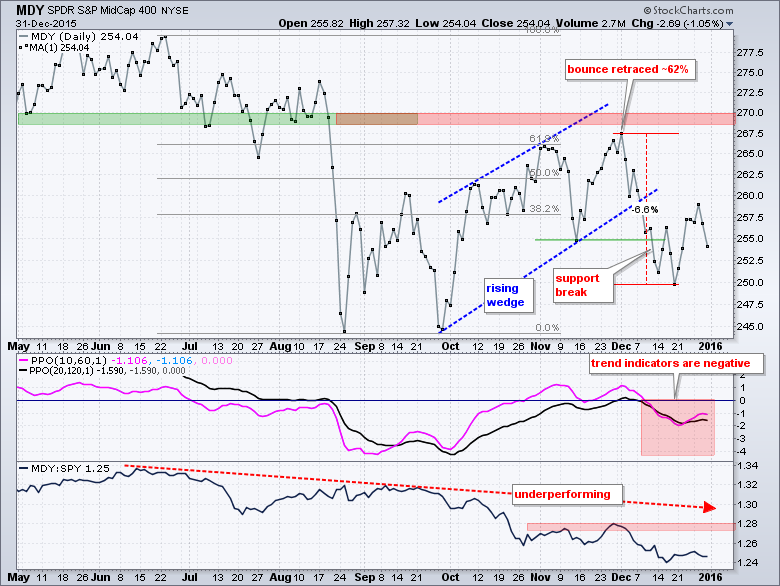
IWM and MDY Break Down
IWM and MDY show a classic bearish sequence unfolding on the price charts. Let's look at IWM first. The ETF broke down with a sharp decline from late June to late September. The big support break around 120 broke the bulls back and started a long-term downtrend. IWM then bounced back to the 120 area with a rising wedge. Notice that this wedge retraced 62% of the prior decline and IWM met resistance near broken support. The rising wedge, 50-62% retracement and return to broken support are typical for counter-trend rallies. This rally ended with a sharp 7.5% decline in early December. There was a bounce back above the support break in late December, but this was not enough to negate the bigger signals.
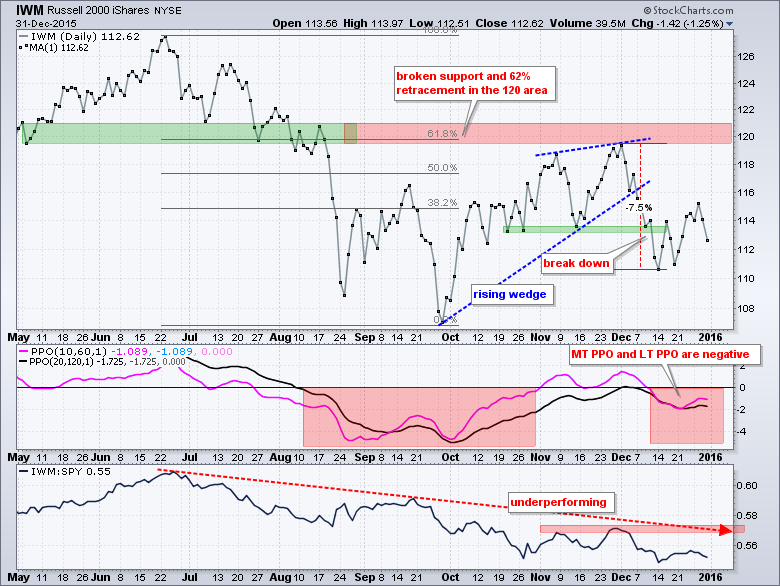
The medium-term PPO (10,60,1) and long-term PPO (20,120,1) turned negative the second week of December and remain negative. Note that the weekly trend indicators turned negative on August 21st and remained negative throughout October, November and December. Relative performance is also negative because the price relative (IWM:SPY ratio) hit a new low in mid December and remains in a strong downtrend. The next chart shows MDY with similar characteristics.
SPY and QQQ Set Up Important Tests
The SPY and QQQ charts are much different than the IWM and MDY charts. First, QQQ and SPY made it back to their summer highs. Second, they are currently above their mid November lows. IWM and MDY closed below their mid November lows with a sharp decline on December 31st. Turning to SPY, the ETF hit resistance from the summer highs and declined with a falling wedge. Notice the lower high in early December and lower low in late December for a two month downtrend. This decline could be a correction after the October surge and breakout, but each bounce off the support zone has failed to trigger an upside breakout. At this point, a close above 208 is needed to trigger a bullish breakout. On the downside, I am watching for a close below 200 to trigger a support break and possibly turn the trend indicators negative. The second chart shows QQQ and a close below 109 would break support.
Links
PPO Trading Strategy - How to use 3 PPOs to develop a trend-reversion trading strategy.
Long-term Trend Indicators - Using the PPO, EMA Slope and CCI to determine the trend.
ETF Master ChartPack - 300+ ETFs organized in a Master ChartList and in individual groups.
Follow me on Twitter @arthurhill - Keep up with my 140 character commentaries.
****************************************
Thanks for tuning in and have a good day!
--Arthur Hill CMT
Plan your Trade and Trade your Plan
*****************************************


