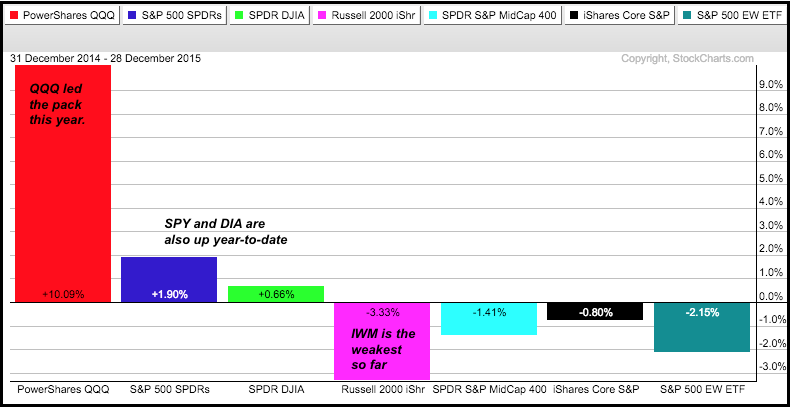
This is just a short update for the Nasdaq 100 ETF (QQQ) and the S&P 500 SPDR (SPY). I will post a 2016 preview later today using monthly charts to extrapolate some bigger trends at work. The daily and weekly trend indicators are bullish for both SPY and QQQ. On the daily charts, the PPO (10,60,1) and PPO (20,120,1) are positive. On the weekly charts, the slope of the 52-week EMA is rising and the PPO(5,52,1) is positive. There are links at the end of this commentary that explain these indicators in detail. These positive indicators suggest that the bigger trends are up for both SPY and QQQ. The Russell 2000 iShares (IWM) tells a different story because the daily and weekly trend indicators are negative. Thus, the song remains the same (hat tip Led Zep). Large-caps and large-cap techs are strong, and small-caps are weak. The PerfChart below shows year-to-date performance for seven major index ETFs and these performance metrics tell the story of 2015. QQQ, SPY and DIA are up, while IWM, MDY, IJR and RSP are down. Large-caps and large-cap techs are relatively strong while small-caps, mid-caps and equal-weights are relatively weak. Note, however, that IWM is down a whopping 3.33% year-to-date. Yes, I am being sarcastic because this is a pretty small decline. For those keeping score at home, IWM was 5.28% in 2014.
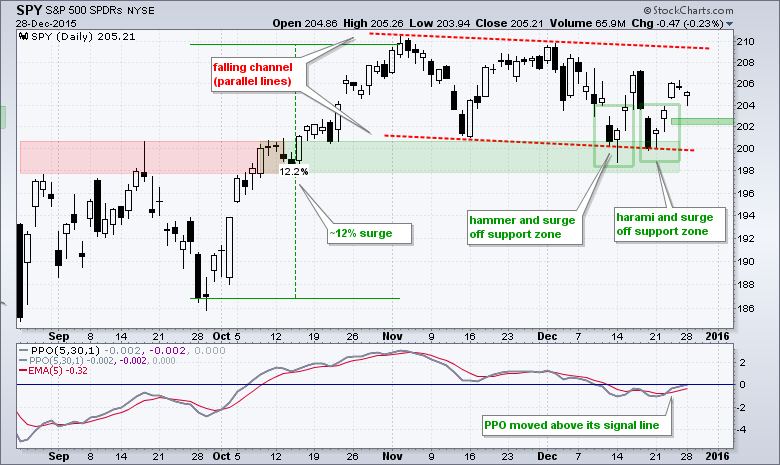
Now let's turn to the short-term situation for SPY. The ETF surged around 12% from late September to early November and then worked its way lower the last two months. This surge triggered a breakout and the broken resistance zone turned into support over the last three weeks. Notice the hammer reversal in mid December and the harami reversal last week. Also notice that the PPO (5,30,1) moved above its 5-day EMA (signal line). Even though the trend since early November is down, this falling channel could be just a correction after the October surge. Medium-term, a break above 210 would signal a continuation of the October surge. Short-term, the harami reversal and upturn in the PPO are bullish. I will mark first support at 202. A break back below this level would negate last week's reversal.
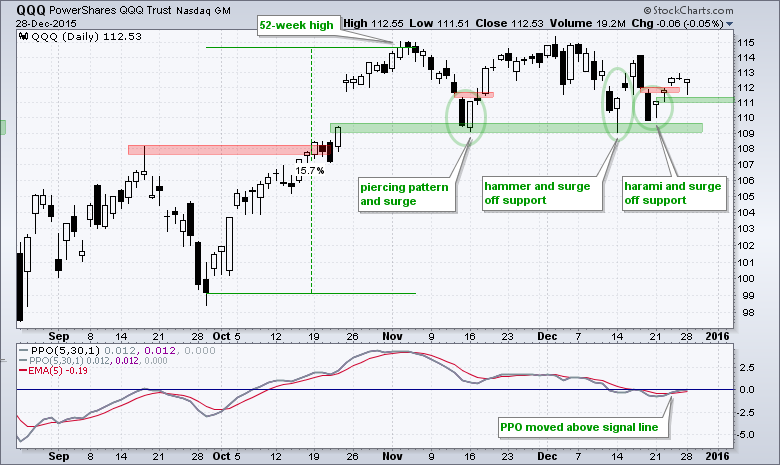
QQQ sports a similar chart. Notice that three candlestick reversals mark support in the 109 area. There was a piercing pattern in mid November, a hammer in mid December and a harami last week. Overall, QQQ surged around 15% and then consolidated with a trading range the last two months. A consolidation after a surge is pretty normal and a breakout at 114.1 would be medium-term bullish. Short-term, the harami and surge are bullish as long as QQQ holds above 111.
Links
PPO Trading Strategy - How to use 3 PPOs to develop a trend-reversion trading strategy.
Long-term Trend Indicators - Using the PPO, EMA Slope and CCI to determine the trend.
ETF Master ChartPack - 300+ ETFs organized in a Master ChartList and in individual groups.
Follow me on Twitter @arthurhill - Keep up with my 140 character commentaries.
****************************************
Thanks for tuning in and have a good day!
--Arthur Hill CMT
Plan your Trade and Trade your Plan
*****************************************


