Monday we saw a perfect storm come together for a short-term bounce. The S&P 500 was short-term oversold after a sharp decline, the index was near support from the mid November low and the seasonal patterns turned bullish on the 10th trading day of December. These items were noted on in Art's Charts before the bell on Monday morning. Well, we got a reversal day on Monday, a gap up on Tuesday and a gain on Wednesday after the Fed. Stocks followed through with a gain on Thursday morning, but selling pressure kicked in and stocks closed very weak. Now what?
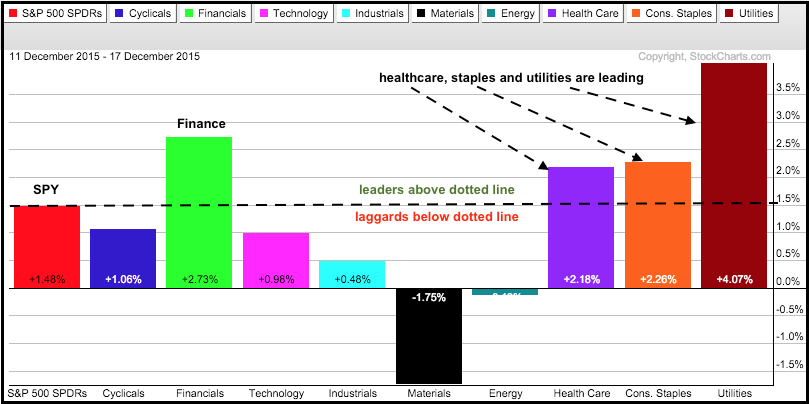
The chart above shows XLY, XLI and XLK lagging this week. Also notice that XLV, XLP and XLU are leading. Except for a big bounce in XLF, it looks like defense is leading offense. The next two charts focus on the S&P 500 SPDR (SPY) and the Nasdaq 100 ETF (QQQ) because these are the strongest of the major index ETFs. The Russell 2000 iShares (IWM), EW S&P 500 ETF (RSP) and S&P MidCap SPDR (MDY) continue to show relative, and absolute, weakness. I am only focusing on the short-term here and will post some longer term analysis later today.
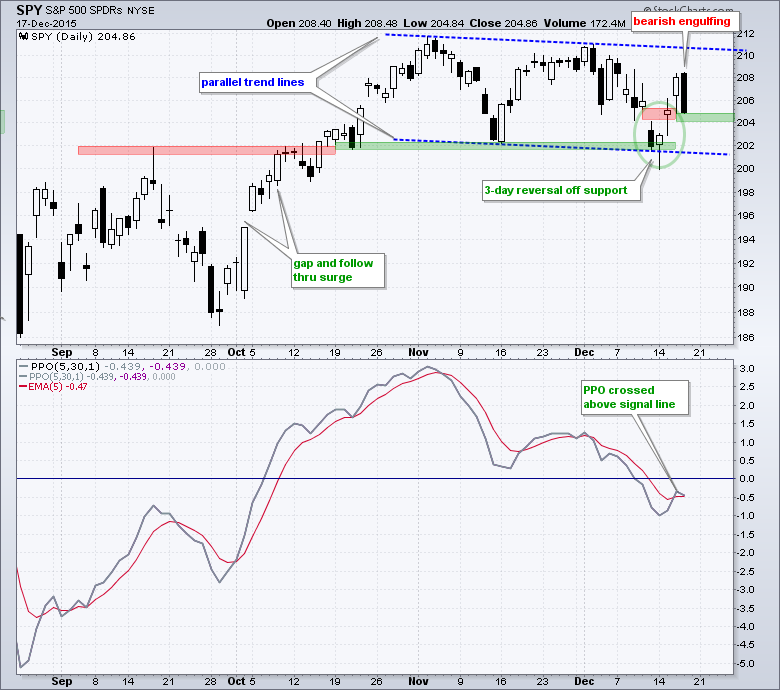
The trend filter was bullish for SPY and QQQ, and the short-term PPOs were in negative territory on Monday. This provided a short-term bullish setup and we got the hammer, gap and surge on Monday, Tuesday and Wednesday. SPY filled last Friday's gap and got a short-term breakout as well. All was looking good until Thursday's failed bounce and long black candlestick. This shows strong selling pressure and casts a dark cloud on the short-term reversal. Note that the candlestick pattern is not a dark cloud, but rather a bearish engulfing. Even though I can mark support at 204 and the PPO is above its signal line, the size of Thursday's reversal is short-term bearish and the PPO is in negative territory. This means the 5-day EMA is still below the 30-day EMA. In short, the three day reversal does not look like it will hold.
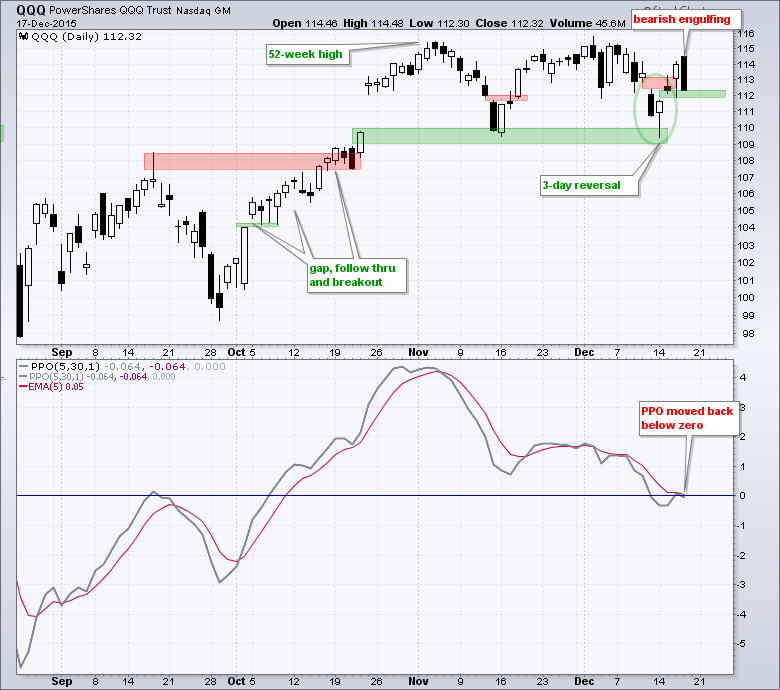
QQQ also forged a 3-day reversal at support and then a big bearish engulfing on Thursday. Wednesday's low marks the last bastion of short-term support at 111.89, but I would not count on it to hold. Notice that the short-term PPO remained below its 5-period EMA and moved back into negative territory on Thursday. This looks like a failed short-term reversal.
Links
PPO Trading Strategy - How to use 3 PPOs to develop a trend-reversion trading strategy.
Long-term Trend Indicators - Using the PPO, EMA Slope and CCI to determine the trend.
ETF Master ChartPack - 300+ ETFs organized in a Master ChartList and in individual groups.
Follow me on Twitter @arthurhill - Keep up with my 140 character commentaries.
****************************************
Thanks for tuning in and have a good day!
--Arthur Hill CMT
Plan your Trade and Trade your Plan
*****************************************


