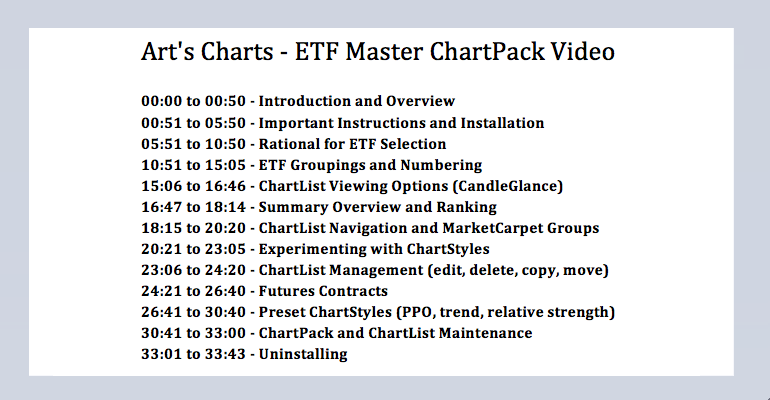
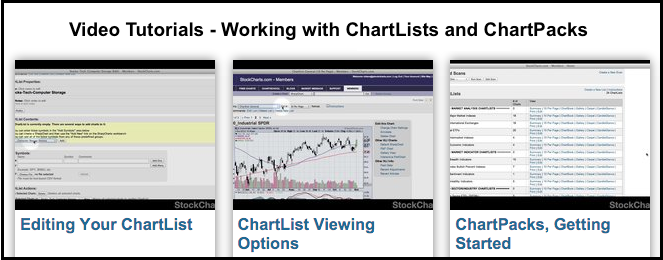
Introduction and Overview
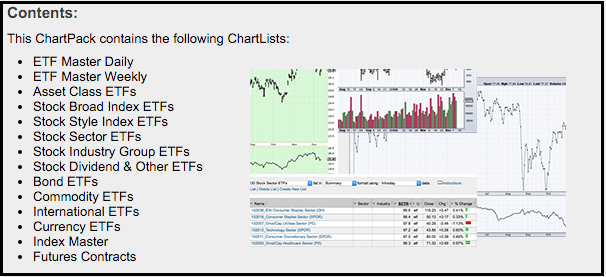
The ETF Master ChartPack contains over 300 ETFs sorted in a logical framework to enhance the analysis process. Using a top-down approach, this ChartPack starts with a ChartList of broad asset class ETFs for a macro overview. The ChartPack then works its way down to the broad stock index ETFs, style index ETFs, sector ETFs and industry group ETFs. Bond, commodity, currency and international ETFs are also included. There is usually a bull market somewhere and this ChartPack makes it easier to separate the wheat from the chaff. Click the yellow image below to install this ChartPack.
 This article explains ChartPack organization, the ETF groupings, the ChartList viewing options and more. Note that the video above goes into great detail on ChartList viewing options, ChartList maintenance and overall ChartPack organization.
Important Instructions and Installation
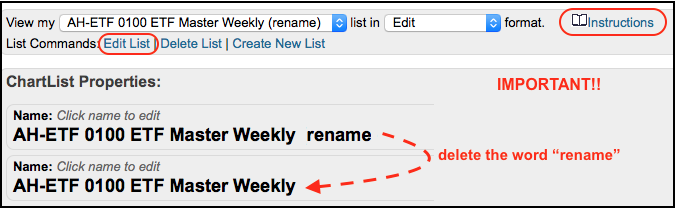
ATTENTION! After installing a ChartPack, users MUST rename any ChartList they wish to preserve. This ChartPack is designed to have two master ChartLists that contain your annotations and notes. ChartPack updates, re-installations or removals are all-or-nothing affairs that affect the entire ChartPack. Chartists simply need to rename these two master lists to separate them from future ChartPack actions. After installing the ChartPack, these two master ChartLists will be at the top and contain the word "rename". I would suggest renaming these lists by removing the word "rename". This will preserve these ChartLists from future overwrites when the ChartPack is updated.
AH-ETF 0100 ETF Master Daily rename ->
AH-ETF 0100 ETF Master Daily
AH-ETF 0100 ETF Master Weekly rename ->
AH-ETF 0100 ETF Master Weekly
Focus, Diversity and Passivity
The ChartLists in this ChartPack are populated with a wide variety of ETFs and indexes, but not ALL ETFs and indexes are included because this would make the list unmanageable. There are over 1500 US-listed ETFs and over 1000 indexes of various sorts. An effort has been made to cull the universe, maintain diversity and reduce duplication. Inverse and leveraged ETFs were excluded on purpose.
The goal of this ChartPack is to provide a diverse list of ETFs that are passively managed, for the most part. The broad stock index ETFs and sector ETFs were easy because these offer clear diversity and passive management. I limited the number of broad stock and sector ETFs to reduce duplication. We do not need three market-cap weighted technology sector ETFs or five market-cap weighted broad market ETFs.
The industry group ETFs were picked to offer a broad cross-section of industry groups within the stock market. Some of these industry group ETFs use active management, but they still reflect the industry group quite well. In particular, any PowerShares ETF with the word "dynamic" employs some active management. The PowerShares Dynamic Media ETF (PBS) is based on the NYSE Dynamic Media Intellidex Index, which uses smart beta to select components.
I included some ETFs with low volume because we can still use these for ranking, tracking and analysis. ETFs are not just for trading. Chartists can use ETFs to find sectors and industry groups that are showing relative strength and in uptrends. We can then use this information to look for stocks that fit that industry group or sector profile.
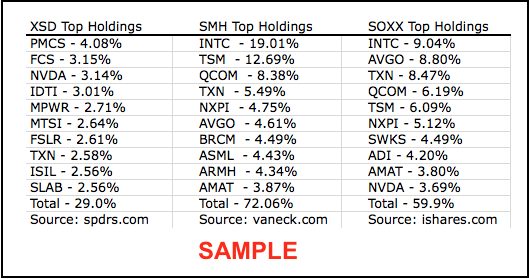
There is sometimes more than one industry group ETF. For example, I listed the Semiconductor ETF (SMH), the Semiconductor iShares (SOXX) and the Semiconductor SPDR (XSD). Feel free to delete one or two. And, of course, feel free to add an ETF, or two or three. SMH and SOXX are weighted by market-cap more or less. XSD, on the other hand, is equally weighted and is a better representation for the industry group as a whole. Note that most industry group SPDRs are equally weighted, but the sector SPDRs are still weighted by market cap. Other industry group SPDRs include the Retail SPDR (XRT), the SPDR Aerospace & Defense ETF (XAR) and the Pharmaceuticals SPDR (XPH).
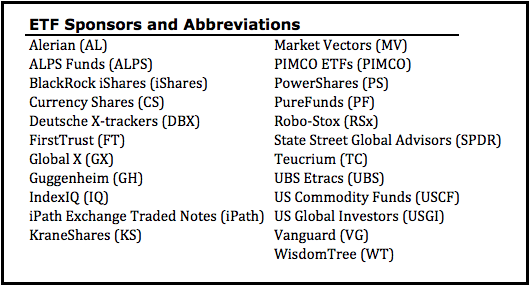
ETF Sponsors
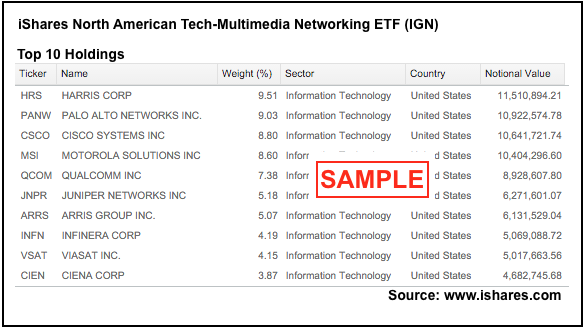
The list below shows over twenty ETFs sponsors with links to their websites. The abbreviations are shown in parenthesis and these are used to identify the sponsor for each ETF in the ChartPack. Chartists can go directly to the sponsor website to find a list of current components. For example, simply go to ishares.com to find the holdings for the Networking iShares (IGN). Alternative, you can Google "ishares ign holdings" with parenthesis to find the holdings via the iShares website.
ETF Groupings
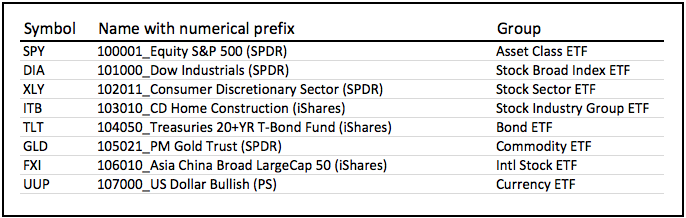
The ETF groupings are maintained in each Master ChartList and in individual ChartLists. I created separate ChartLists to make it easy to focus on a specific group, which is handy for running scans, viewing in summary format and experimenting with various ChartStyles. The name of the ETF starts with a number to group similar ETFs together.
The sorting does not stop at these big groups. The industry group ETFs associated with the technology sectors are grouped together and commodity ETFs associated with energy are grouped.
The name of the ETF was shortened to tell us exactly what we need to know. This is followed by an abbreviation for the sponsor in parenthesis. A full list of ETF sponsors and web links can be found further down in this article. The paragraphs below expand on the various groupings and the rationale.
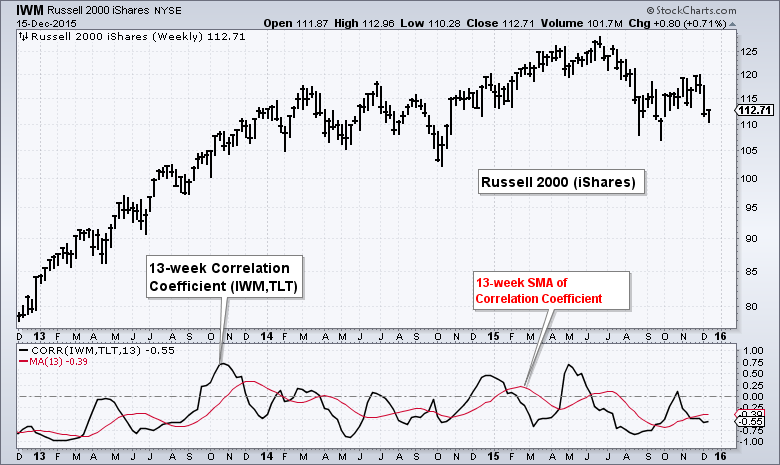
Asset Class ETFs: a group of ETFs that represent different asset classes (stocks, bonds, commodities, REITs and alternative investments). This list is an effort to find ETFs with low or negative correlations. It is also a great way to get a macro view for stocks, commodities, bonds and select currencies. The example below shows the Russell 2000 iShares (IWM) with a mostly negative correlation to the 20+ YR T-Bond ETF (TLT).
Stock Broad Index ETFs: A dozen broad stock index ETFs such as SPY, DIA, QQQ and IWM. There are surely a few dozen more, but adding more would be redundant. This group is designed to capture the Dow, the Nasdaqs, small-caps, mid-caps, large-caps, equal-weights and micro-caps.
Stock Style Index ETFs: This group captures the value-growth divide for large-caps, small-caps and mid-caps.
Stock Sector ETFs: This group shows the market-cap weighted sector SPDRs, the equal-weight sectors and the small-cap sectors. There are 9 sectors in each group and 27 in total. The sorting order is designed to place the key sectors at the top. Thus, the consumer discretionary, technology, finance and industrials sectors are the top four.
Stock Industry Group ETFs: This group is sorted by sector to keep the finance-related ETFs, the technology-related ETFs and other related industry groups together. The Metals & Mining SPDR (XME), Gold Miners ETF (GDX) and Copper Miners ETF (COPX) are grouped together.
Stock Dividend & Other ETFs: This motley crew consists of high yield stock ETFs, a preferred stock ETF, a pair of low volatility ETFs and a momentum ETF. Some of these are actively managed so their components are subject to change based on market conditions. Chartists can consider adding these to the industry group ETFs because it is such a small group.
The rest of the ETF groupings are pretty self-explanatory: Bond ETFs, Commodity ETFs, International Stock ETFs, International Bond ETFs and Currency ETFs.
ChartList Viewing Options
A focused ChartList makes it easy to analyze and compare ETFs in the same group. For example, chartists can view all the sector ETF charts in one table, all the industry group ETF charts in a MarketCarpet or all the commodity ETFs as CandleGlance charts. A wide array of ChartList viewing options make this possible.
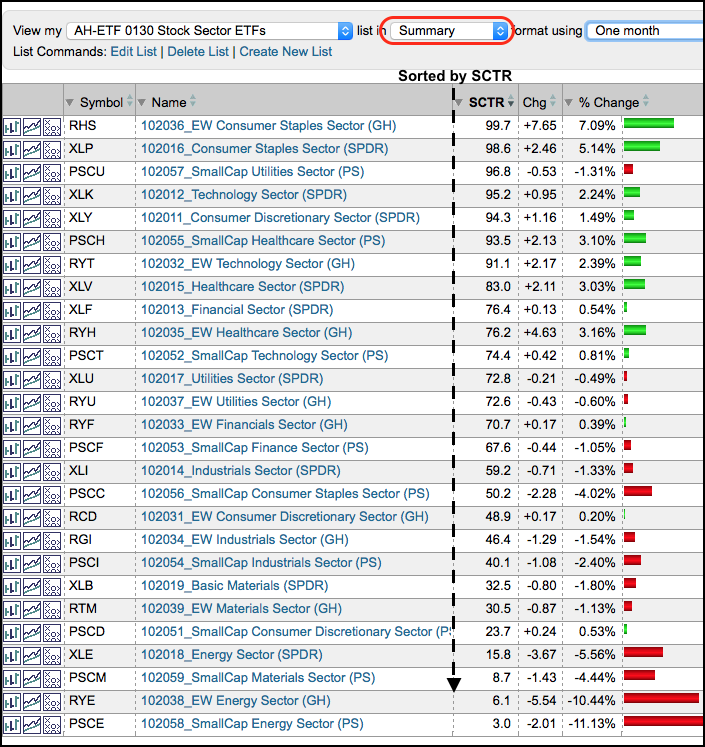
The example above shows the 27 sector ETFs in summary format, which is a viewing option. Chartists can sort any column by simply clicking the column heading. In this example, I sorted by SCTR to rank relative performance. ETFs with the highest StockCharts Technical Rank (SCTR) are at the top and ETFs with the lowest SCTR are at the bottom.
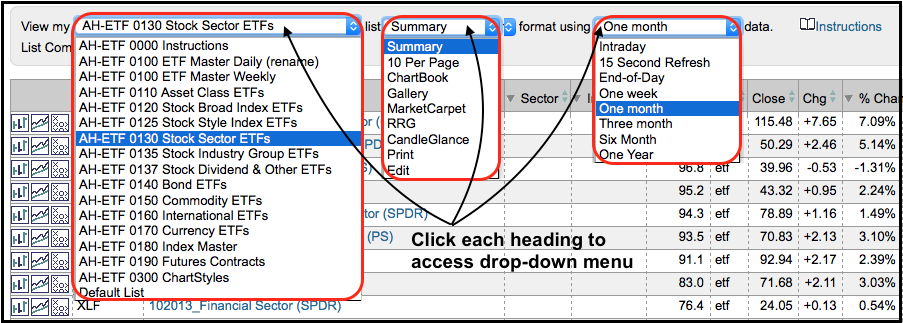
Changes are easy with the drop-down menus at the top. Chartists can navigate between ChartLists using the menu in the upper left. Viewing options can be changed to CandleGlance, MarketCarpet or RRG using the middle menu. Chartists can change the timeframe using the menu on the right. The various viewing options are covered in more detail in the video.
ChartStyles and Indicators
The ChartStyles are very basic and users can change these to their preferred ChartStyles. Here are the highlights:
- The asset class ETFs use a simple bar chart and the Correlation Coefficient indicators to find non-correlated assets..
- The broad index, sector, industry group, bond and international ETFs use a simple bar chart and the price relative to compare performance against the S&P 500 SPDR.
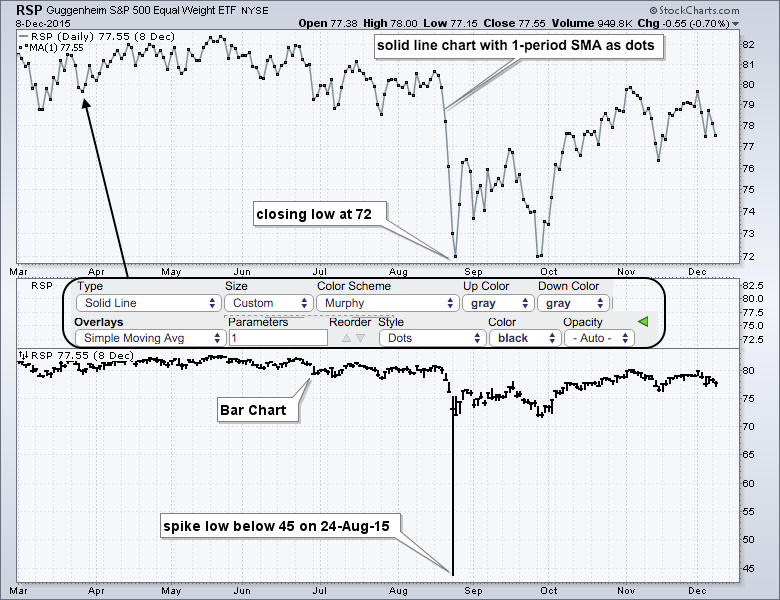
- The EW S&P 500 ETF (RSP) chart is a solid line with dots because the spike low on August 24, 2015, skewed the chart (see example below)
- The commodity ETFs have a bar chart with the Commodity Tracking ETF (DBC) in the indicator window for reference.
- The currency ETF charts are green with the US Dollar ETF (UUP) in the indicator window for reference.
- The futures contracts show volume in the indicator so Chartists can determine the most active contract, which is the one you want to follow.
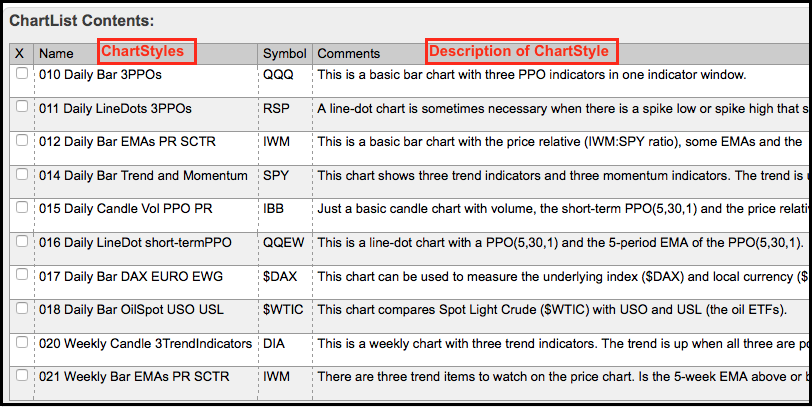
The last ChartList in the ChartPack (AH-ETF 0300 ChartStyles) contains ten different ChartStyles that I use on a regular basis. Chartists can read about these different ChartStyles and their indicators in the comments section, which is visible in ChartList "edit" mode or when viewing as "10 per page". The line-dot chart is available here as are a few variations of the Percentage Price Oscillator (PPO) charts.
Final Thoughts and Installation Link
An organized list of charts is the first step to the analysis process and the first step towards successful trading or investing. This ChartPack offers a structure that chartists can use to maintain their ChartLists and build further. It takes a little work, but putting some effort into ChartList maintenance will pay off in the long run. Good organization saves time and time is money.
Some ChartList management topics are covered in detail in the corresponding video. These include renaming a ChartList, copying items, deleting items and renaming items. You can also learn more about managing ChartLists in our video tutorials.
 Click the yellow image below to install this ChartPack.
  Please send any comments or suggestions via the feedback form at the bottom.
****************************************
Thanks for tuning in and have a good day!
--Arthur Hill CMT
Plan your Trade and Trade your Plan
*****************************************


