S&P 500 equal-weight Holds Break // Nifty 50 Versus the Rest // Major Indices are Net Bearish // Sector Balance Favors the Bears // Finance Weakens after Lower High // Healthcare Holds Up after Lower High // Treasuries Hold Support and Uptrend // Dollar Holds its Breakout // Gold Stalls within Downtrend // Oil Hits Another New Low // Friday Food for Thought ////
Weighing the Evidence
The bulk of the evidence is bearish for stocks, but there are still some pockets of strength that could keep the S&P 500 range bound. We are still seeing the large-cap/small-cap split as small-caps continue to underperform and show relative weakness. Mid-caps are also showing relative weakness. Large-caps and large-cap techs are holding up better, but SPY and QQQ filled Tuesday's gaps and are retesting the mid November lows. There are some broad market forces at work right now and these are negative (net bearish). Broad market conditions are the single most important factor when trading or investing. Market-cap, sector and industry are, of course, also important, but these can be trumped by broad market conditions, which are currently bearish. Treasury bonds are the most obvious alternative to equities and the key T-bond ETFs are holding their uptrends.
S&P 500 equal-weight Holds Break
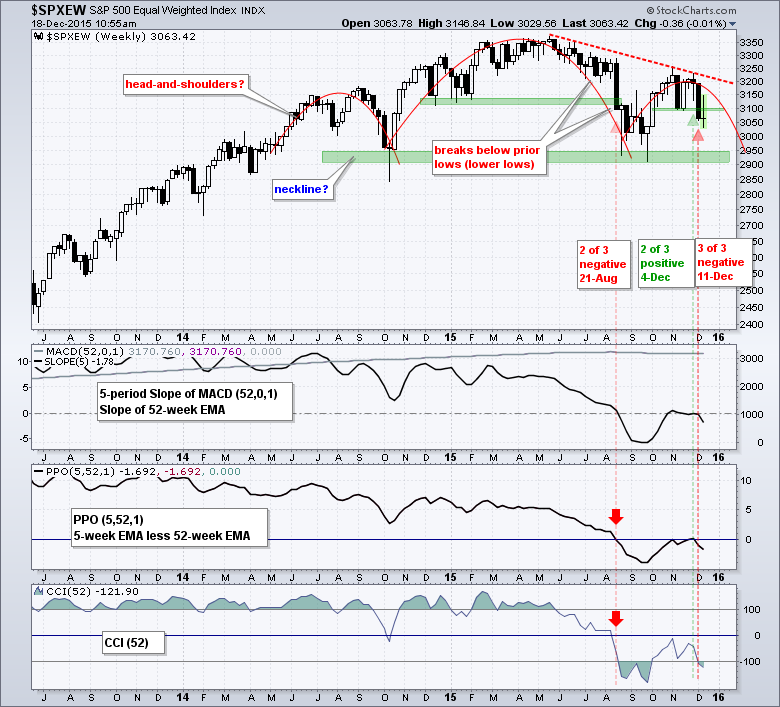
The S&P 500 Equal-Weight Index ($SPXEW) broke below its mid November low last week and made an attempt to recover the support break this week. So far, it is too little too late. The three trend indicators turned negative on December 11th (last Friday) and remain negative. Moreover, the October-November bounce formed a lower high and looks like a counter-trend bounce. In other words, the decline from 3400 to 2950 (May to September) looks like the dominant move and the bounce back to 3250 looks like a corrective bounce within a bigger downtrend. This two month upswing reversed with last week's break down. Overall, it looks like a large head-and-shoulders pattern is taking shape with neckline support in the 2900-2950 area. As noted last week, this pattern is really not that significant because the trend is already down and support levels are not important in a downtrend. Why? Because a trend in motion stays in motion and support levels are not expected to hold. The S&P 500 equal-weight represents the "average" stock in the stock market and this is negative overall.
Nifty 50 Versus the Rest
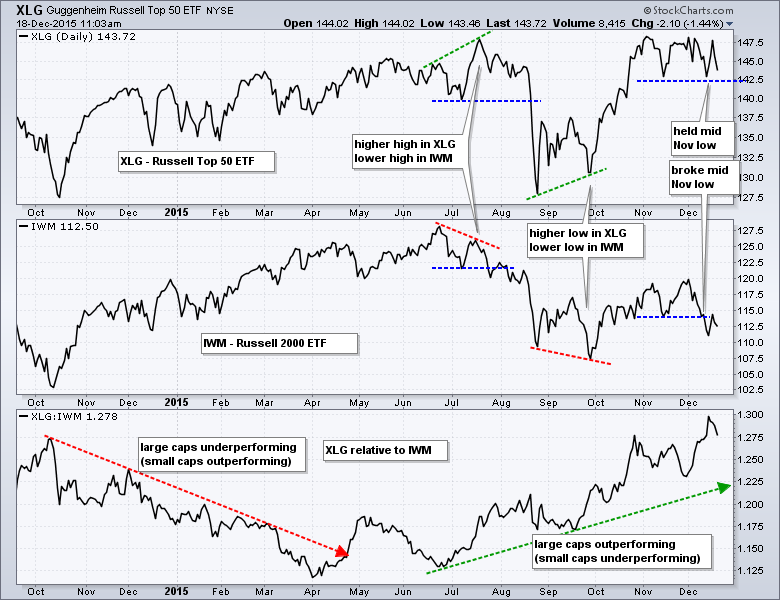
The S&P 500 represents large-caps because it is weighted by market cap. Note that the top 50 stocks account for around 48% of the index and their market cap ranges from 87.26 billion (Schlumberger) to 606 billion (Apple). The other 450 stocks account for around 52% of the index and have market caps ranging from 87.23 billion to 1.58 billion (Consol Energy). Note that 135 stocks (27%) in the S&P 500 have market caps below 10 billion. Many of these stocks would qualify for the S&P MidCap 400 and S&P Small-Cap 600. $MID has a maximum market cap of 11.3 billon and $SML has a maximum market cap of 4.5 billion. Thus, we can assume that the nifty-fifty of the S&P 500 are driving the index and keeping it afloat. By the way, there is an ETF for the nifty-fifty: Guggenheim Russell Top 50 ETF (XLG). The chart below shows XLG, the Russell 2000 iShares and the XLG:IWM ratio. XLG has been leading since late June and continues to lead. Most recently, IWM broke below its mid November low and XLG remains above this benchmark low.
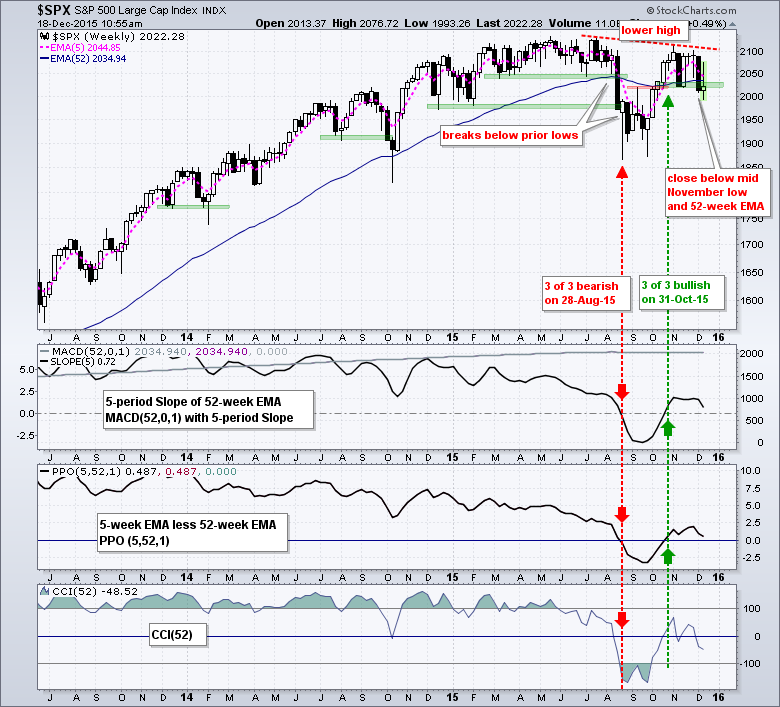
The next chart shows the S&P 500 and the trend indicators are net positive (2 of 3). The price chart, however, does not look as positive. The 5-period Slope of the 52-week EMA and the PPO(5,52,1) are based on exponential moving averages and this produces lag. Both of these lagging indicators are still positive. CCI(52) does not have this lag factor and it dipped below zero last week. On the price chart, the S&P 500 formed a lower high in November and broke below the mid November low last week. The index is attempting to firm above 2000 this week, but weakness in the broader market may ultimately pull it down.
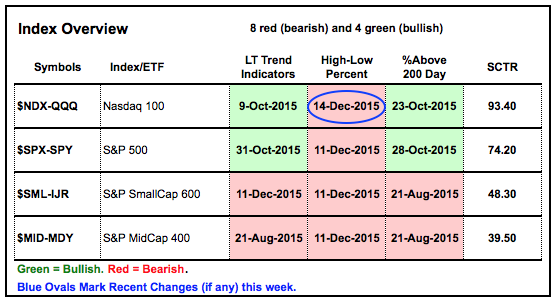
Major Indices are Net Bearish
The table below shows trend and indicator scoring for four major indexes. There are 12 red-green boxes and the SCTR in the last column. 7 of 12 were red last week and 8 of 12 are red this week (75%). Nasdaq 100 High-Low Percent turned bearish this week when the indicator moved below -5%. Note that High-Low Percent hit -9% or lower for all four indices on Monday and this was the deepest dip since late September. This means new lows expanded this week and we are likely to see another dip on Friday. The Nasdaq 100 %Above 200-day EMA (!GT200NDX) and S&P 500 %Above 200-day EMA (!GT200SPX) are still green because they have yet to break below 40%. As of Thursday's close, 48% of S&P 500 stocks are above their 200-day EMA and 52% of Nasdaq 100 stocks. Index High-Low Percent Chart - Sector %Above 200-day EMA Chart
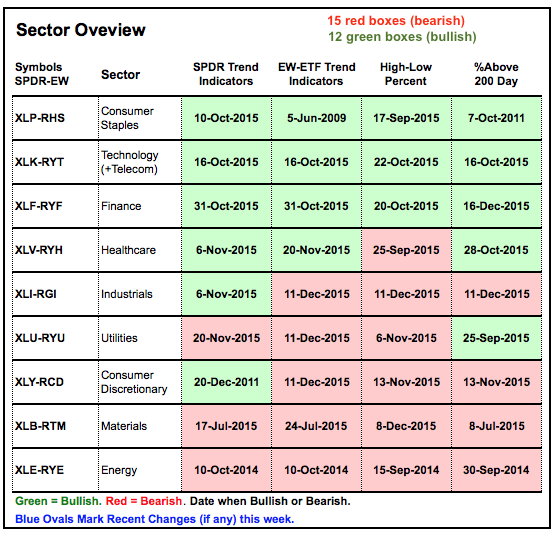
Sector Balance Favors the Bears
The next table shows the trend and breadth indicators for the nine sectors. Note that the trend indicators are shown for the market-cap weighted sector SPDRs and the equal-weight sector ETFs. Six of the nine sector SPDRs are still in uptrends and this confirms the preference for large-caps. In contrast, five of the nine equal-weight sector ETFs are in long-term downtrends because at least 2 of the 3 trend indicators are negative. Note that this trend determination is completely based on the indicators. The chart interpretations may be different. Excluding the large-cap SPDRs, there are 15 red boxes (bearish) and 12 green boxes (bullish). This means the majority of indicators are bearish (red). Technology, consumer staples, finance and healthcare are still net bullish. The rest of the sectors are net bearish. Sector High-Low Percent Chart - Sector %Above 200-day EMA Chart
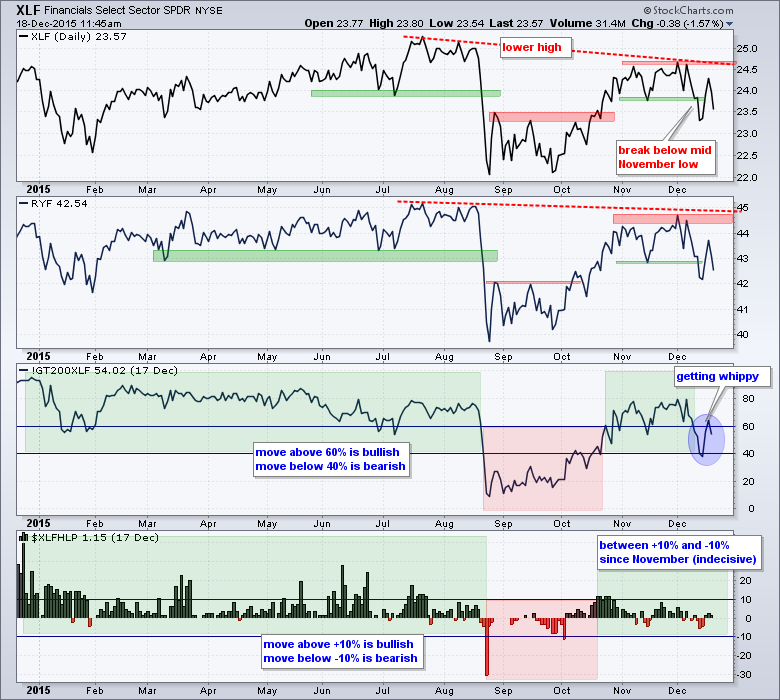
Finance Weakens after Lower High
The next chart shows the Finance SPDR (XLF) with the EW Finance ETF (RYF), the Finance %Above 200-day EMA (!GT200XLF) and Finance HiLo% ($XLFHLP). Both XLF and RYF broke below their mid November lows last week and formed lower highs from July to December. The ETF bounced earlier this week, but gave most of it back on Thursday-Friday and the support breaks remain in play. The %Above 200-day EMA moved below 40% to turn bearish last week, but surged above 60% to turn bullish again this week. This whipsaw is likely because many finance stocks are near their 200-day EMAs. This also means that it would not take much to trigger a downside cross below 40%. High-Low Percent triggered bullish with a move above +10% in late October and has yet to trigger bearish, which would require a move below -10%. Technically, the breadth indicators are still positive, but the price charts are negative until a break above the early December high.
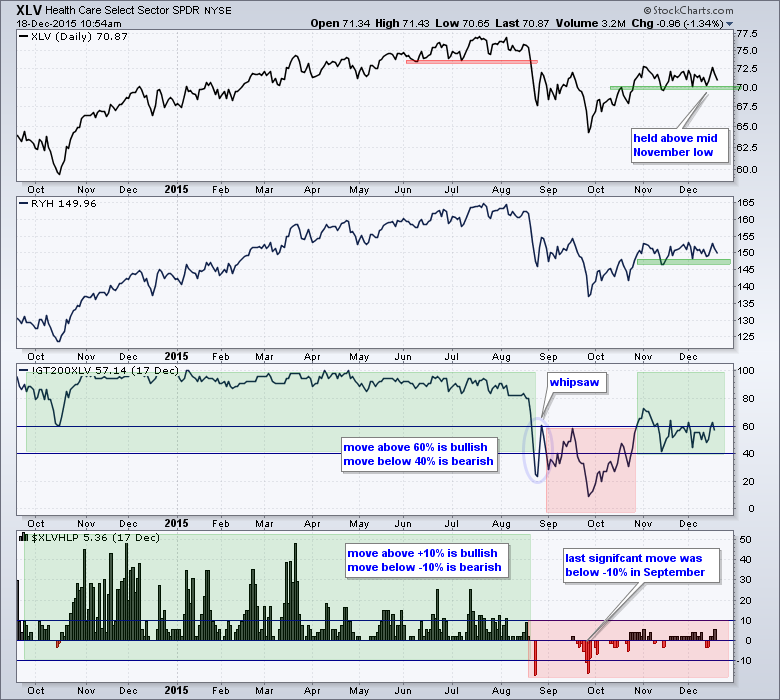
Healthcare Holds Up after Lower High
Chart XX shows the HealthCare SPDR (XLV) with the EW Healthcare ETF (RYH), the Healthcare %Above 200-day EMA (!GT200XLV) and Healthcare HiLo% ($XLVHLP). XLV and RYH remain well below their summer highs, but these two held up well in December because they did not break their mid November lows. This is relative "chart" strength. A break below these lows, of course, would be bearish and call for a reassessment. The breadth indicators are split with %Above the 200-day net bullish since the move above 60% in late October and High-Low Percent net bearish with the move below -10% in late September. A move above +10% is needed to put this indicator back in bull mode.
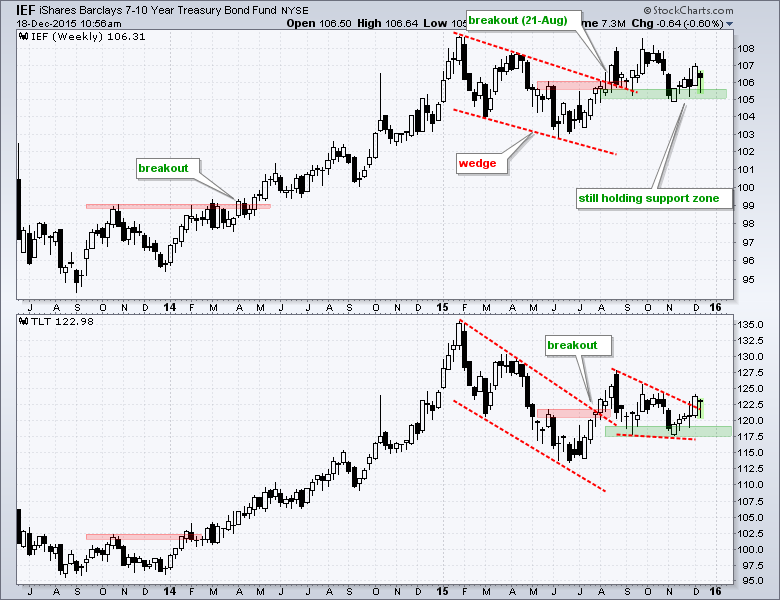
Treasuries Hold Support and Uptrend
I am showing both the 7-10 YR T-Bond ETF (IEF) and the 20+ YR T-Bond ETF (TLT) to get a grip on Treasuries. Both are in uptrends with the August-November lows marking support zones. These uptrends started with the August breakout, which coincided with the August breakdown in stocks. IEF and TLT turned choppy after the breakouts and bounced off support the last six weeks. These bounces affirm support and keep the uptrend in Treasuries alive.
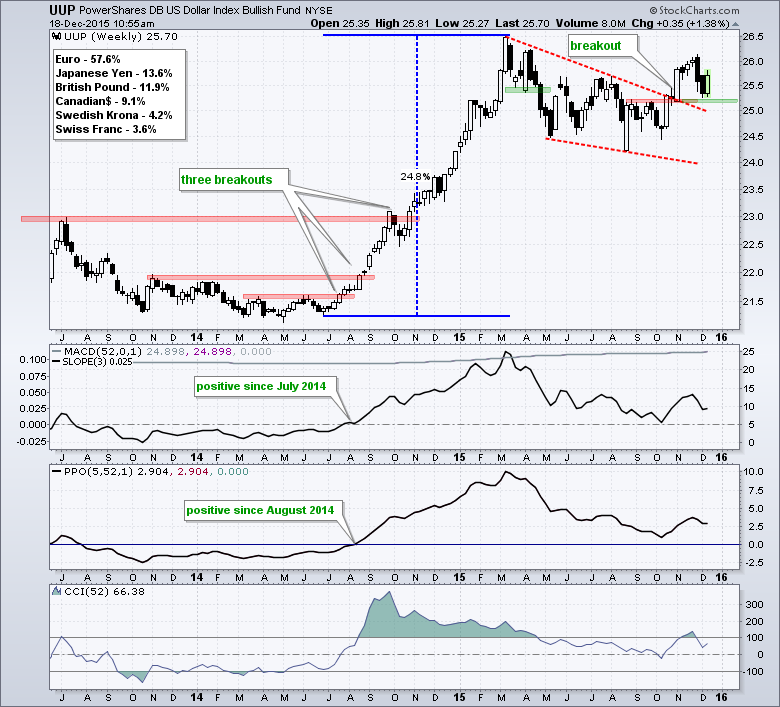
Dollar Holds its Breakout
The US Dollar ETF (UUP) broke wedge resistance with a surge in October and then fell back towards the breakout in late November-early December. The ETF was entitled to a pullback after this breakout surge and UUP found support just above the breakout zone. This week's long white candlestick affirms support just above 25 and keeps the bigger uptrend alive for the greenback. Continued strength in the Dollar could weigh on oil and gold.
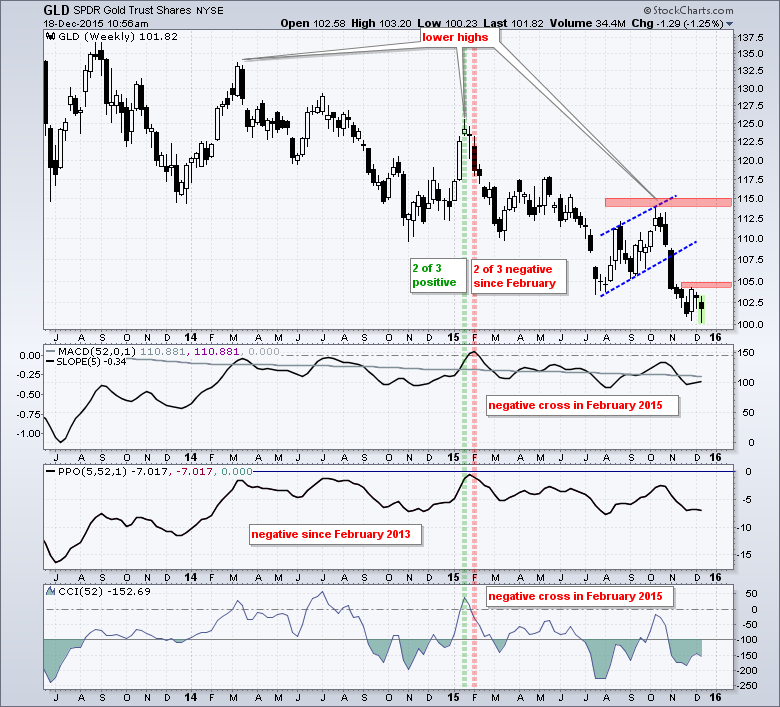
Gold Stalls within Downtrend
The Gold SPDR (GLD) formed an inside week last week, which is also known as a harami. These candlesticks signal indecision that can sometimes foreshadow a reversal, but there was no follow through with a break above 105. Instead, GLD moved to a new low for the move and extended its bigger downtrend. All three trend indicators remain negative and have been net-bearish since February. This bigger downtrend is still the dominant force on the gold chart.
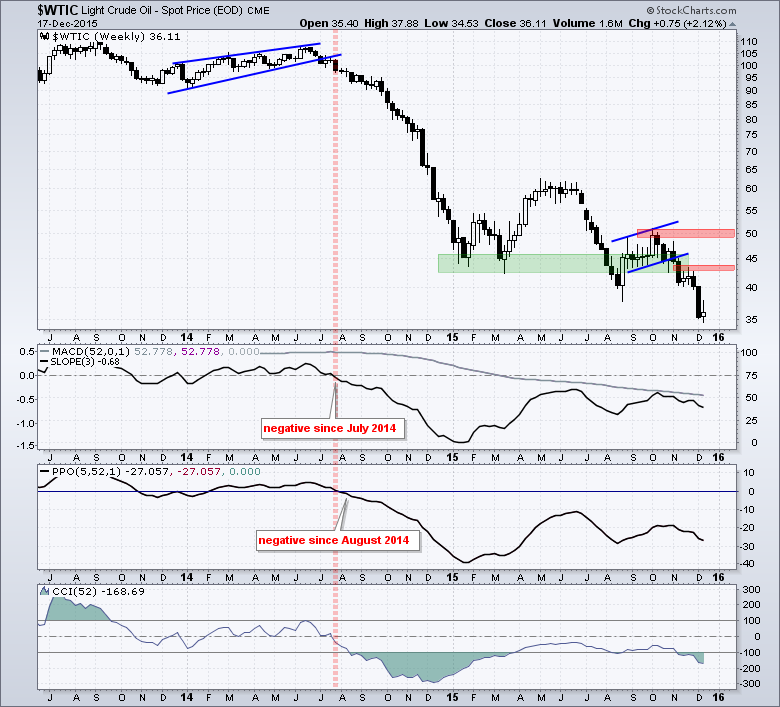
Oil Hits Another New Low
Oil Firmed in the mid 30s this week, but the overall trend remains down and the most we can expect is an oversold bounce. The trend indicators have been negative since August 2014 and oil broke to new lows in August and again in December. The only positive here is that oil looks oversold. Broken support and the mid November high mark first resistance in the 43-44 area. Key resistance remains in the 50 area.
Friday Food for Thought
Gary Antonacci explains why Dual Momentum outperforms. Note that dual momentum is a strategy that utilizes price momentum and relative performance momentum.
Here is a paper from Ned Davis: Compounding Returns and Making the Trend Your Friend. It is from April, but the lessons are timeless and Ned Davis Research puts out some great stuff (institutions only).
And speaking of Ned Davis Research, Mark Hulbert writes that Stocks are More Overvalued Now than in 2000 or 2007. This is based on information from NDR.
BusinessInsider profiles the fastest growing gym in America, just in time for January. It is a match made in heaven with $10 memberships, pizza, bagels and candy.
Links
PPO Trading Strategy - How to use 3 PPOs to develop a trend-reversion trading strategy.
Long-term Trend Indicators - Using the PPO, EMA Slope and CCI to determine the trend.
ETF Master ChartPack - 300+ ETFs organized in a Master ChartList and in individual groups.
Follow me on Twitter @arthurhill - Keep up with my 140 character commentaries.
****************************************
Thanks for tuning in and have a good day!
--Arthur Hill CMT
Plan your Trade and Trade your Plan
*****************************************


