Was it that Bad last Week? // E-mini Continues Battle with 2K // QQQ Holds above Support Zone // Five Reasons for Relative Strength in QQQ // Healthcare Still Holding Up // Biotech iShares Holds Gap // Five Strong Biotechs and One at Support // Best Wishes.... ////
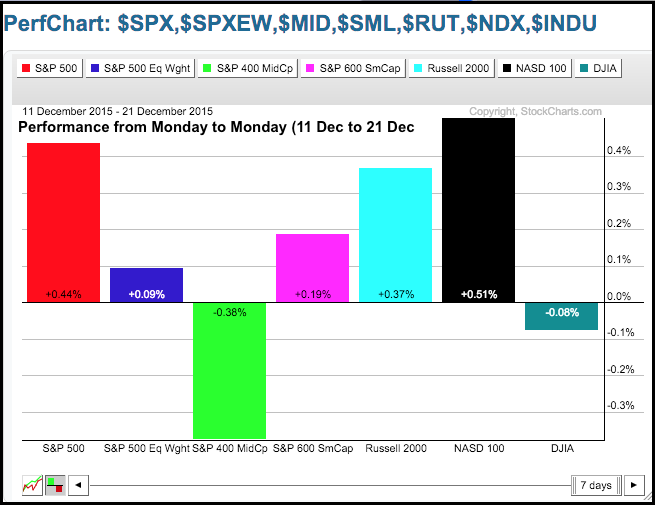
Was it that Bad last Week?
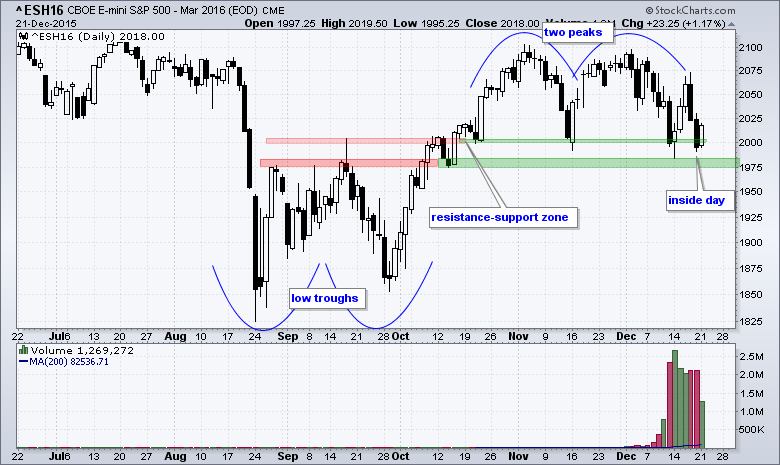
E-mini Continues Battle with 2K
After a sharp decline on Thursday-Friday, stocks firmed on Monday with an inside day. In fact, the current setup looks almost exactly the same as last week's setup. SPY and QQQ because short-term oversold and then firmed at support. Note that the weekly trend indicators for SPY and QQQ are still net positive. The daily trend indicators are both positive for QQQ, but mixed for SPY. On the daily charts, the long-term PPO (20,120,1) is still positive, but the medium-term PPO (10,60,1) dipped into negative territory. Again, I will turn to the March E-mini for some insight on the S&P 500. There are mirror images from August to December - two troughs versus two peaks. The 1975-2000 area marked resistance and this area now marks support. A close or even a dip below 1975 would suggest that large-caps are joining mid-caps and small-caps with a break down. As long as this support zone holds, we could see a bounce off support and firming is the first step. Notice that the E-mini formed an inside day on Monday.
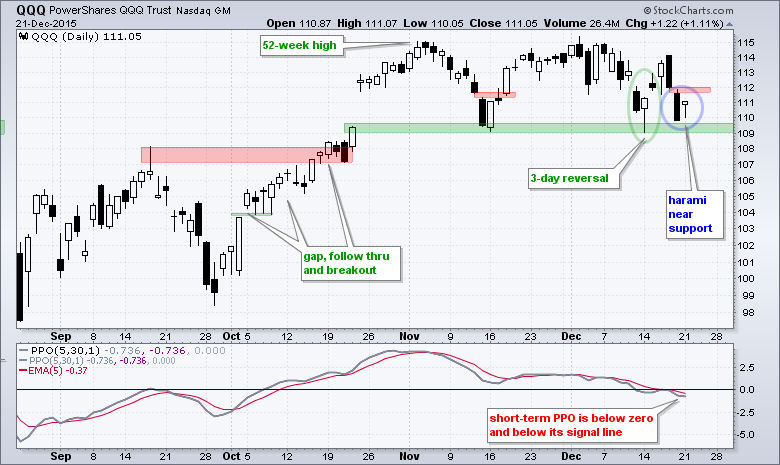
QQQ Holds above Support Zone
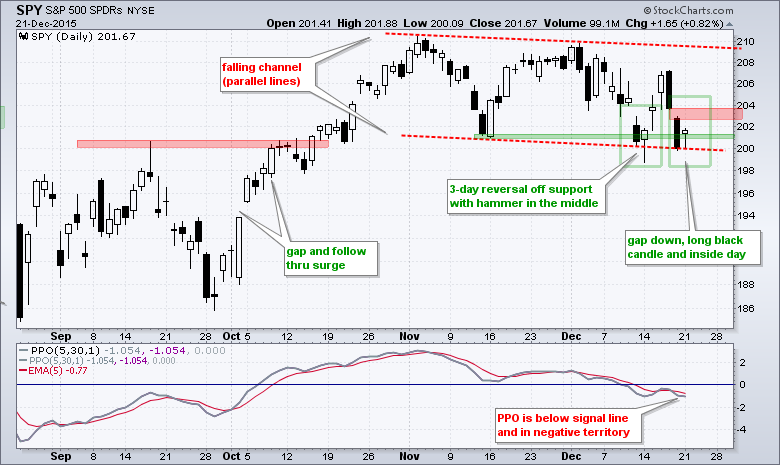
Turning to SPY, we can see a battle royal brewing at the 201 area - which marks the mid November low. First, there is a downtrend present with a lower high in early December and lower low in mid December (falling channel). Short-term, SPY formed a bearish engulfing Thursday, gapped down on Friday and continued down to form a long black candlestick. A harami then formed on Friday-Monday as the ETF immediately firmed. We saw a three candlestick reversal last Friday-Monday-Tuesday and a similar setup is brewing now - for those wishing to trade into Christmas. Personally, I will hold off and enjoy some more hot buttered rum. It is not some much the setup, but rather the desire to wind down during the holiday period. There will be plenty of opportunities in 2016.
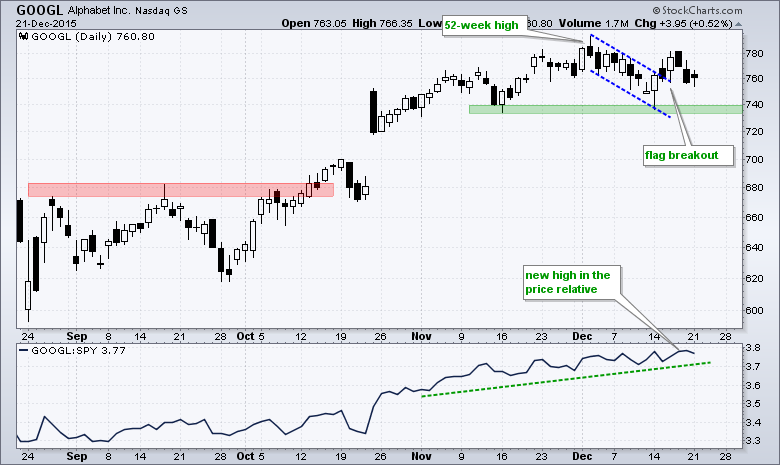
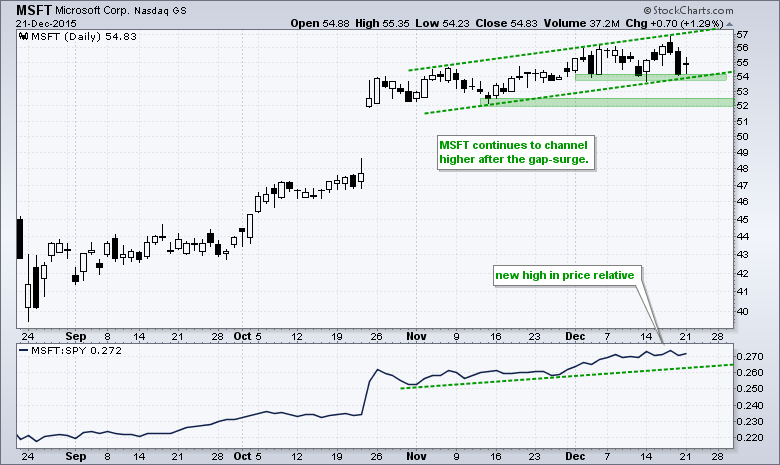
Five Reasons for Relative Strength in QQQ
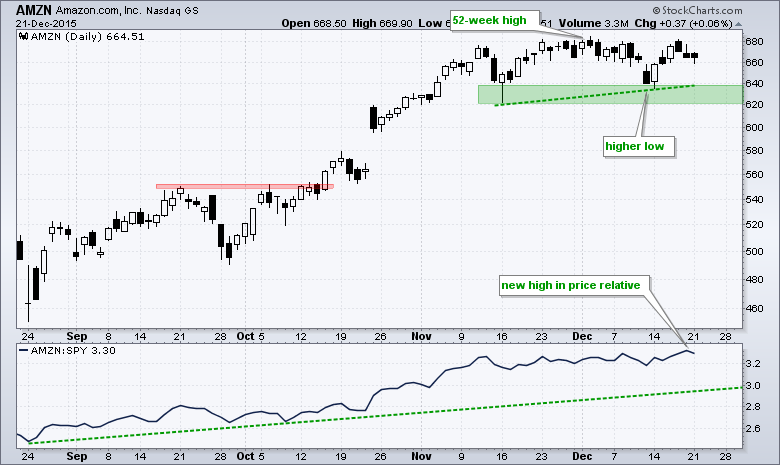
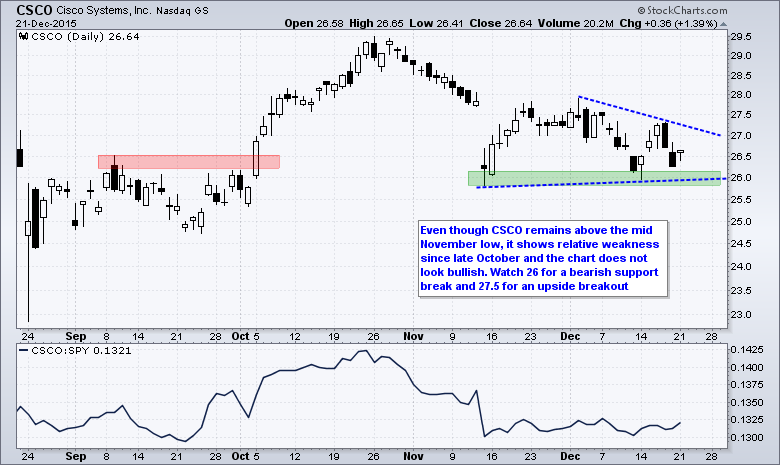
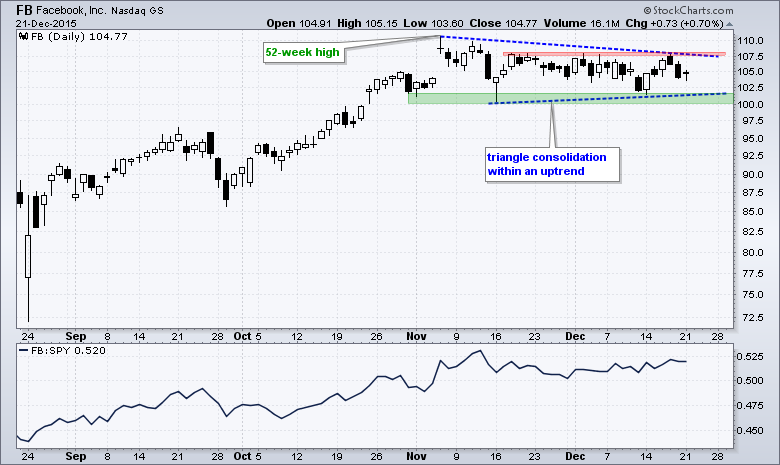
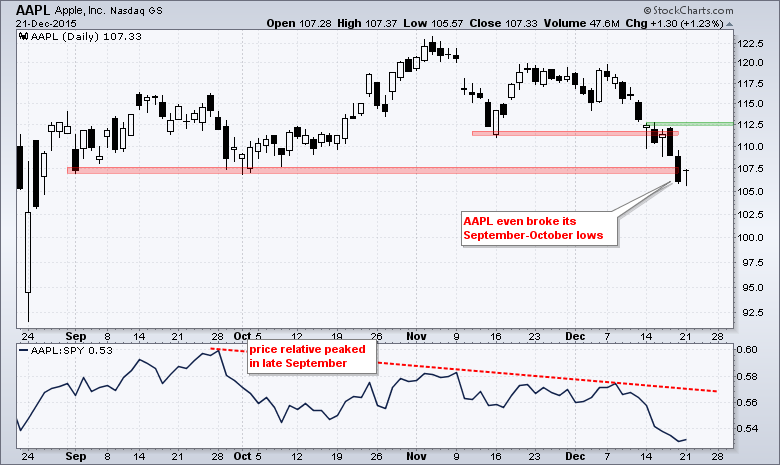
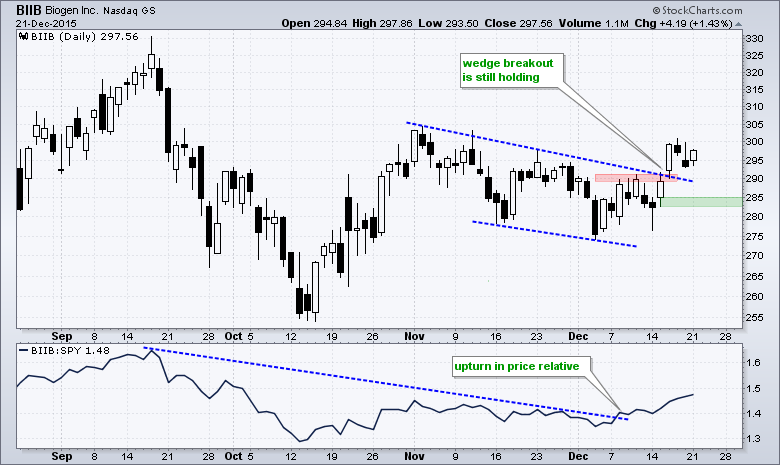
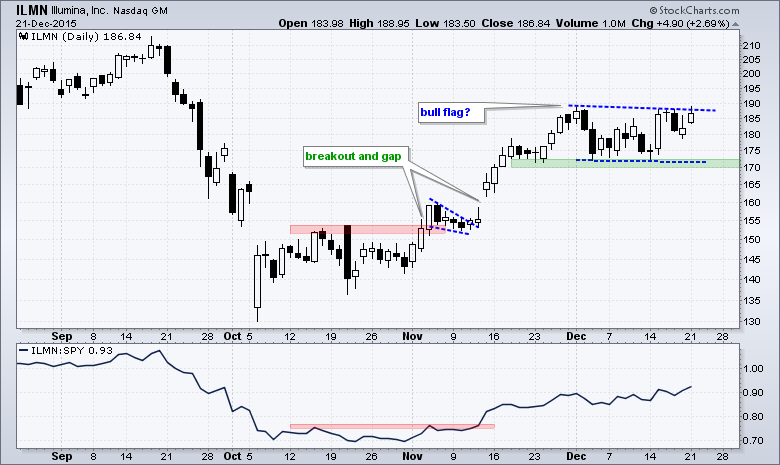
The mid November low marks a benchmark low that chartists can use to gauge relative strength or relative weakness based on the price charts. ETFs and stocks that held the mid November lows show relative chart strength. ETFs and stocks that broke these lows show relative chart weakness. Six of the top ten holdings for QQQ held above the intraday low in mid November. These include GOOGL, MSFT, AMZN, FB, AMGN and CSCO. Together, these six stocks account for around 32% of QQQ. Watch these six leaders for clues on large-cap techs (QQQ and Nasdaq 100). The tide will clearly turn down if the majority of these six break their mid November lows. The next seven charts show the stock with the price relative and some annotations, which should be self-explanatory. I threw in Apple because it accounts for 11.41% of QQQ and shows relative chart weakness. While five of these charts are still bullish, AAPL is clearly bearish and counters some of this strength.

Healthcare Still Holding Up
The HealthCare SPDR is still one of the stronger sectors right now. This relative strength is mostly because the sector held up well in November and December. Of the nine sector SPDRs, only the Technology SPDR (XLK), Consumer Staples SPDR (XLP) and Consumer Discretionary SPDR (XLY) are above their 200-day SMAs. The same is true for the equal-weight sector ETFs. The HealthCare SPDR (XLV) and the EW Healthcare ETF (RYH) are both between their 50-day SMAs and 200-day SMAs, which means it could be a moment-of-truth. The 50-day SMAs are rising and the 200-day SMAs are flat. Upside breaks above last week's high would be quite bullish for both. The chart shows XLV with a surge in October and a triangle the last two months. A break above triangle resistance would signal a continuation of the October surge. Keep in mind that triangles can break the other way as well so a break below support at 69 would be bearish (Hat tip to D.G.).
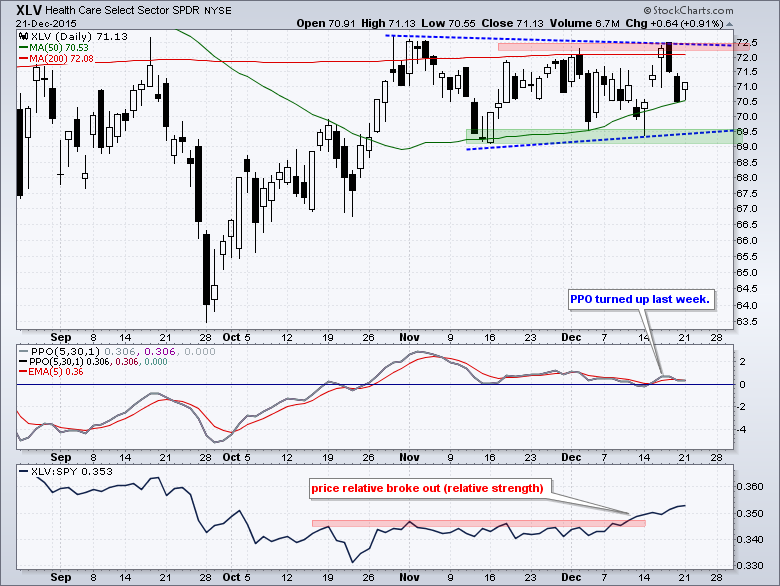
Note that I do not use moving averages to mark support or resistance. Instead, I use them as reference points for price action and determine the direction of the moving average. An uptrend is favored when price is above the moving average and the moving average is rising. A downtrend is favored when price is below the moving average and the moving average is falling. Stocks and ETFs above their 50-day and 200-day SMAs show relative strength, while stocks and ETFs below these moving averages show relative weakness.
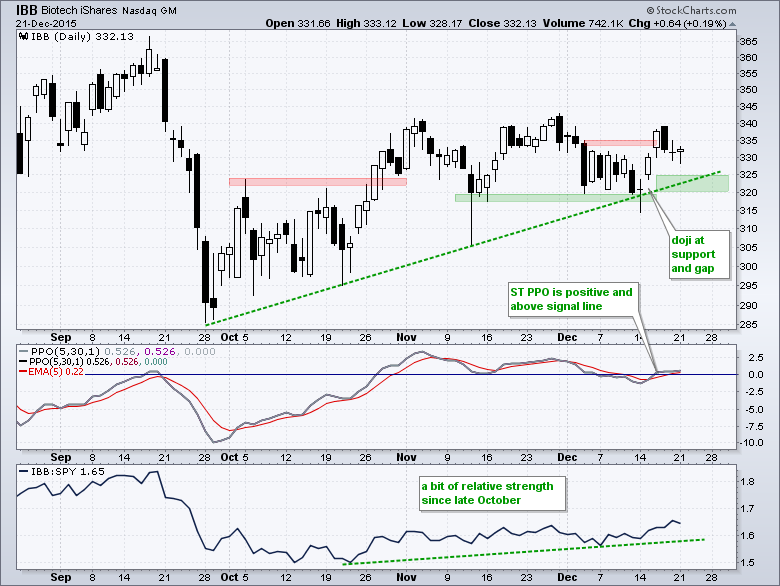
Biotech iShares Holds Gap
I highlighted the Biotech iShares (IBB) and several biotechs last week, and some continue to perform well. As with most groups, there are pockets of strength and pockets of weakness. The PerfChart below shows the performance for the top ten holdings since the end of October. For reference, SPY is down 2.43% over this period and IBB is up 2.05%. The top ten holdings are mixed with five up and five down. As with the broader market, this is not a rally that lifted all boats. Instead, it is a selective advance that favors stock picking.
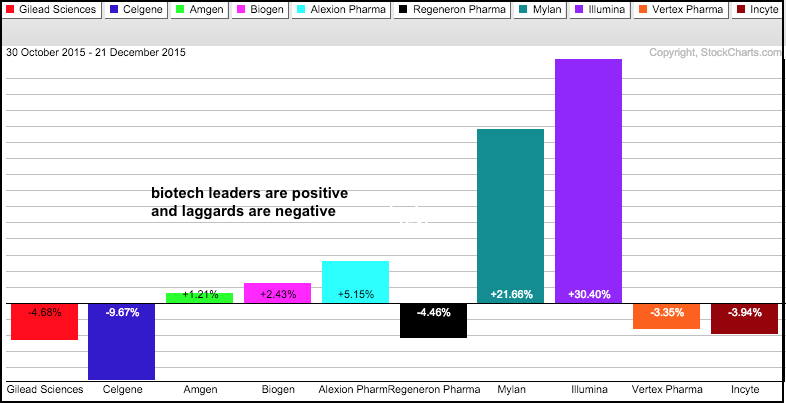
The next chart shows IBB holding support in the 317 area and gapping up last week. While the broader market fell sharply last Thursday-Friday, IBB fell Thursday and firmed on Friday. The gap is holding and IBB is showing some relative strength this late October.
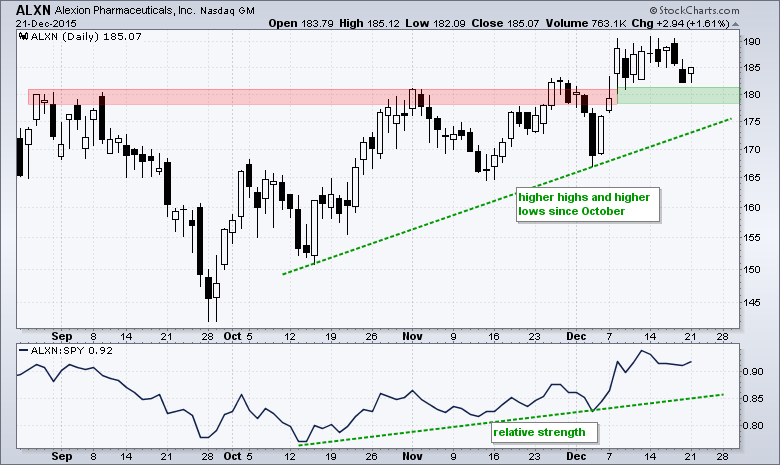
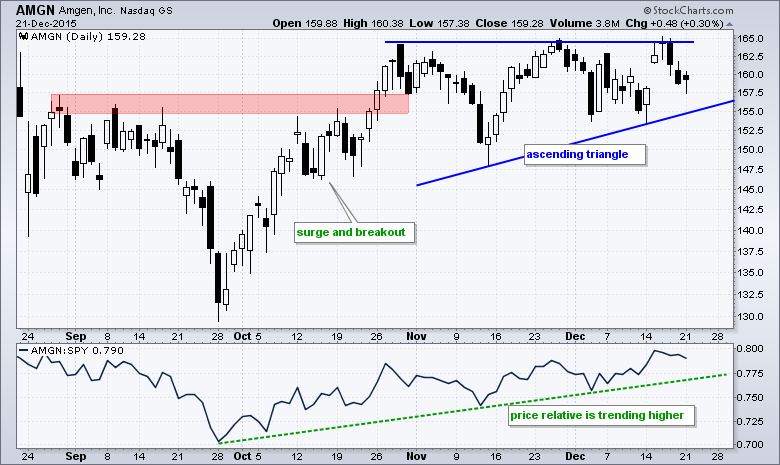
Five Strong Biotechs and One at Support
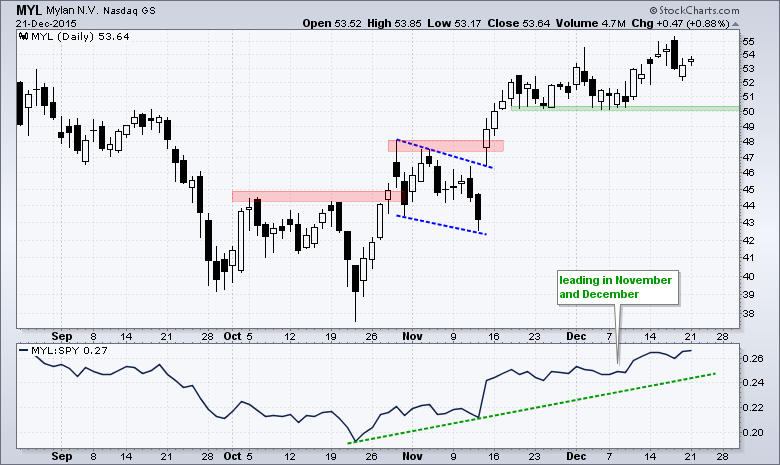
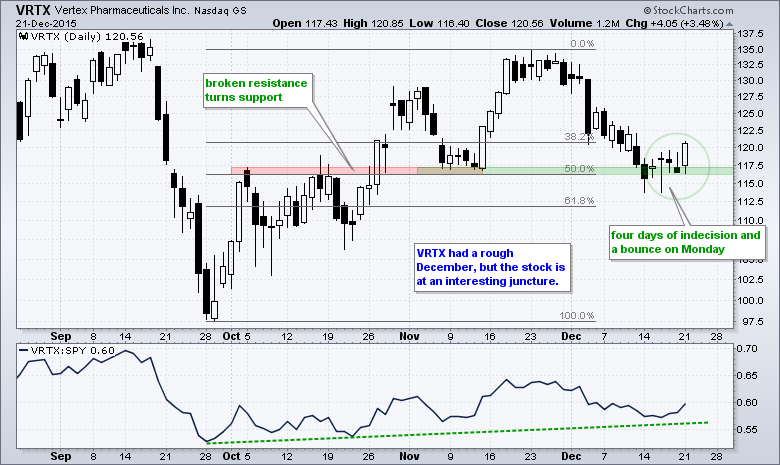
The next charts show five biotech stocks showing relative strength in November and December. The sixth stock, Vertex, fell in December and does not show relative strength, but the stock is at an interesting chart juncture. Keep in mind that biotech stocks have above average risk. Chartists should consider these within the context of a diversified portfolio and employ some sort of position sizing technique to mitigate risk. By the way, I will be posting a detailed article on position sizing in January.
Best Wishes....
I will write the Don't Ignore This Chart blog on Wednesday and take off on Thursday. The next Art's Charts will be on Tuesday, December 28th. I will then look at some monthly charts and attempt to extrapolate some long-term trends for 2016. Notice that I did not use the terms "predict" or "forecast"! In any case, I wish you all a very Merry Christmas and happy holiday season!

Links
PPO Trading Strategy - How to use 3 PPOs to develop a trend-reversion trading strategy.
Long-term Trend Indicators - Using the PPO, EMA Slope and CCI to determine the trend.
ETF Master ChartPack - 300+ ETFs organized in a Master ChartList and in individual groups.
Follow me on Twitter @arthurhill - Keep up with my 140 character commentaries.
****************************************
Thanks for tuning in and have a good day!
--Arthur Hill CMT
Plan your Trade and Trade your Plan
*****************************************


