Small and Mid Caps Come Alive // Bullish Continuation Pattern for SPY // Utilities and Energy Look Vulnerable // Housing Gets a Breakout as Retail Rebounds // Cloud and Internet Continue to Lead // Regional Banks and Insurance Power Finance Sector // Current Market Themes ////
Market Overview
While we still have some day-to-day noise and the summer highs to consider as resistance for the S&P 500, not much has changed over the past week. Well, my waistline did change as I fattened up for the long winter. As far as the markets are concerned, the S&P 500 and Nasdaq 100 remain in uptrends that began with the October reversals. Small caps came alive in the second half of November, but none of the weekly trend indicators for the Russell 2000 turned positive. Even though the stock market as a whole remains bifurcated with sizable pockets of weakness, the pockets of strength still appear to outweigh the pockets of weakness. Elsewhere, oil, copper, silver and gold remain in strong downtrends, and the Dollar remains in a strong uptrend. Commodities are providing a great mental exercise for technical analysts. Forgot about calling a bottom and respect the ongoing trend, which is the dominant force. Bonds are a tougher call because Treasuries are benefitting from persistent weakness in commodities (disinflation). The 20+ YR T-Bond ETF (TLT) bounced over the last two weeks, but I think the bigger trend is down.
Small and Mid Caps Come Alive
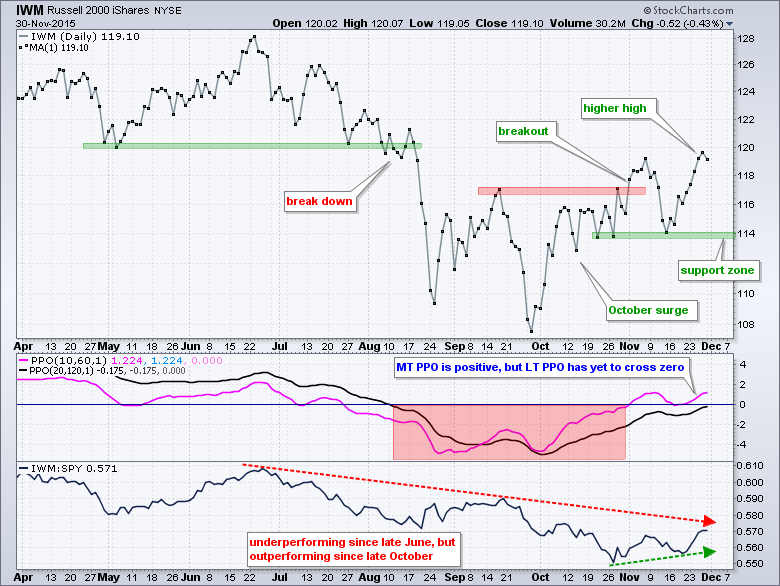
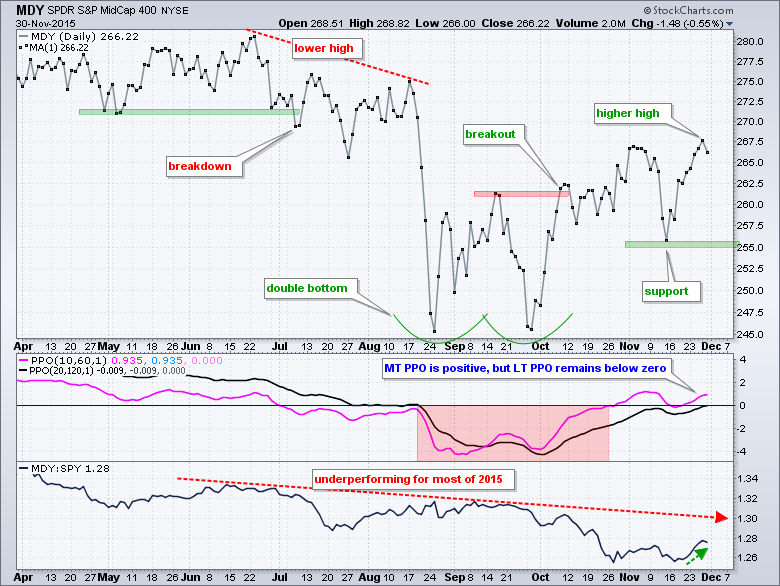
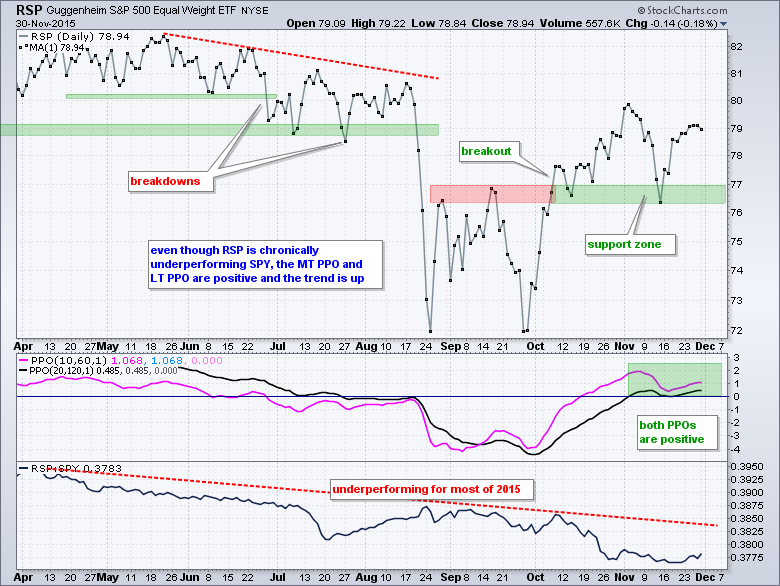
The Russell 2000 iShares (IWM) and S&P MidCap SPDR (MDY) came alive in the second half of November, but both are still underperforming SPY in 2015. The EW S&P 500 ETF (RSP) has been underperforming for most of 2015 and remained relatively weak in November. The "little three", as I am calling these non large-cap ETFs, are lagging on the longer timeframe because they remain well below their summer highs and their price relatives are in downtrends. The S&P 500 SPDR (SPY) is back near its summer highs and the Nasdaq 100 ETF (QQQ) actually exceeded its summer highs. I will have more on the 'big two" in the next section. Even though the little three are lagging over the last six months, note that IWM and MDY exceeded their early November highs and led over the last few weeks. RSP is still lagging badly, but the medium-term PPO (10,60,1) and long-term PPO (20,120,1) are both positive. The surge in the second half of November comes on the heels of the big October advance. This amounts to some bullish follow through and keeps me net bullish on stocks. Chartists can use the mid November lows to set a line-in-the-sand. Failure to hold recent gains and a close below these mid November closing lows would warrant a reassessment. You can read all about the PPO, settings and signals in this article.
Bullish Continuation Pattern for SPY
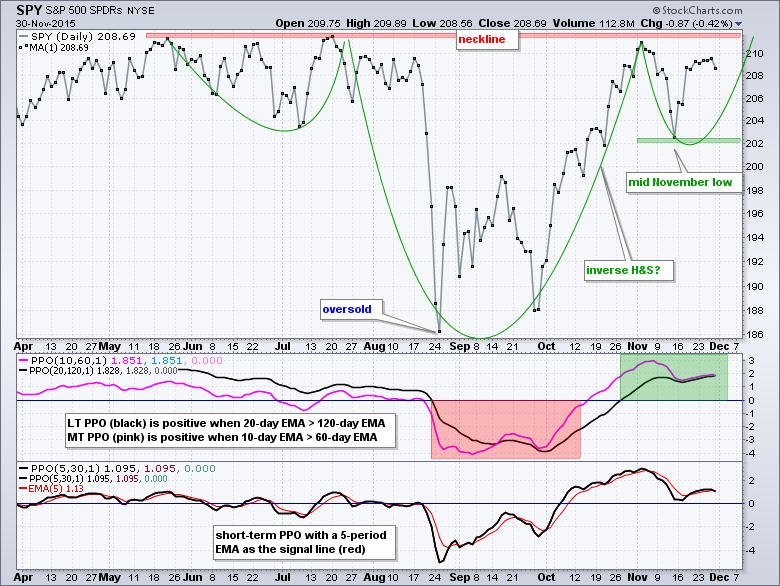
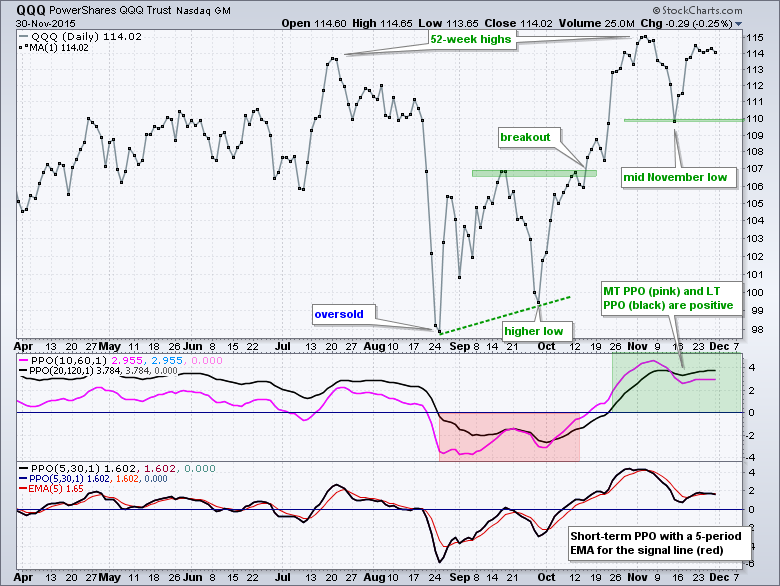
QQQ and SPY led the October surge as QQQ hit a new high and SPY challenged its summer highs. Both pulled back in early November and then bounced over the past week. SPY could be forming an inverse head-and-shoulders pattern with the summer highs marking neckline resistance. Note that this inverse H&S pattern is a bullish continuation pattern, not a reversal pattern. QQQ is stronger because it exceeded its summer high in early November and shows a clear uptrend. As with the "little three", the November lows mark the first support level to watch and the bulls get the benefit of the doubt as long as these levels hold.
XLU and RYE Look Vulnerable
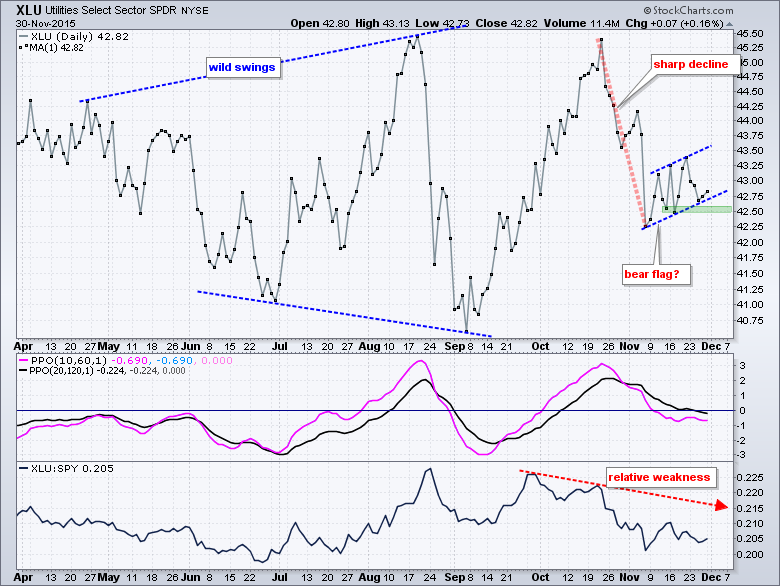
Even though the energy and utilities sectors are completely different beasts, both showed relative weakness during the November surge and have bearish chart setups. The Utilities SPDR (XLU) has been quite erratic since March with an expanding range taking shape. Notice how the ETF surged above 45 in August-October and plunged below 41 twice in June and September. At this point, I am focused on the most recent swing, which was the sharp decline in late October and early November. The ETF formed a rising consolidation in November and this looks like a bearish flag. A close below 42.4 would reverse this short-term rise and call for a continuation of the prior decline. The indicator window shows the price relative breaking down in October and remaining weak. Note that the PPO signals did not work well from August to October because a trend did not take hold. Both are currently negative so let's see if this holds.
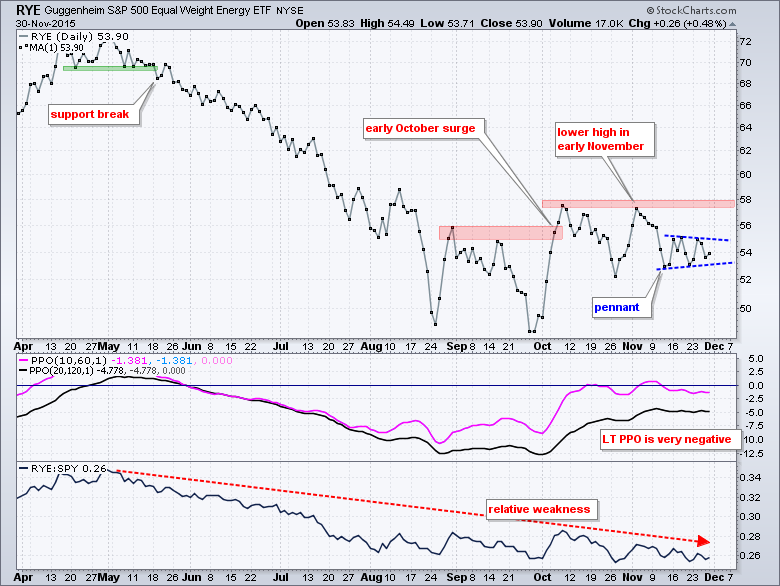
The EW Energy ETF (RYE) surged with the market in early October - and that was it. The surge lasted five days and the ETF moved into a holding pattern the last seven weeks. The broader market continued to strengthen, but RYE did not partake and the price relative extended its downtrend. The energy sector continues to underperform and this is negative. Returning to the price chart, RYE fell in early November and then formed a pennant over the last two weeks. These are short-term continuation patterns and a break below 52 would signal a continuation lower.
Housing Gets a Breakout as Retail Rebounds
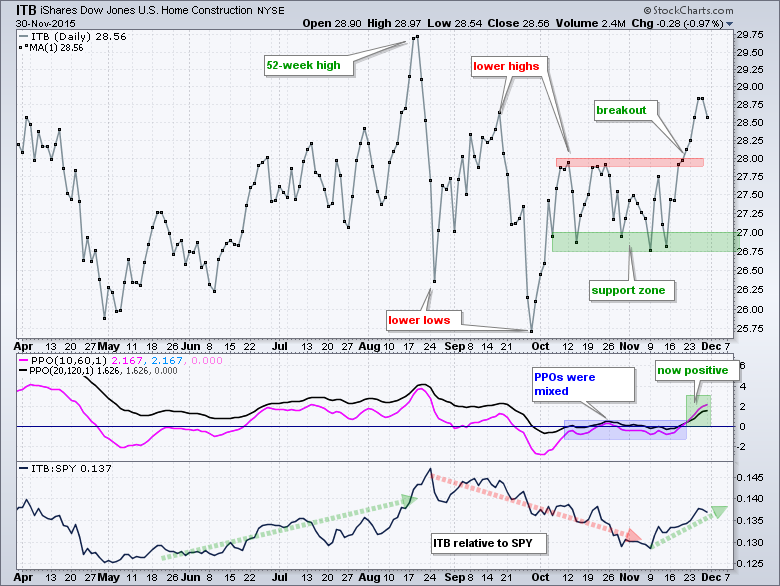
The big news in the consumer discretionary sector was the breakout in the Home Construction iShares (ITB) and rebound in the Retail SPDR (XRT). While I am not ready to turn bullish on XRT, the breakout in ITB looks strong and this bodes well for housing. 28 was my line-in-the-sand for ITB and the ETF closed above this level last week, and exceeded its October highs. The price relative (ITB:SPY ratio) also turned up over the last few weeks as ITB outperformed the broader market for most of November. As with the Houston Texans, November is a month to remember for ITB.
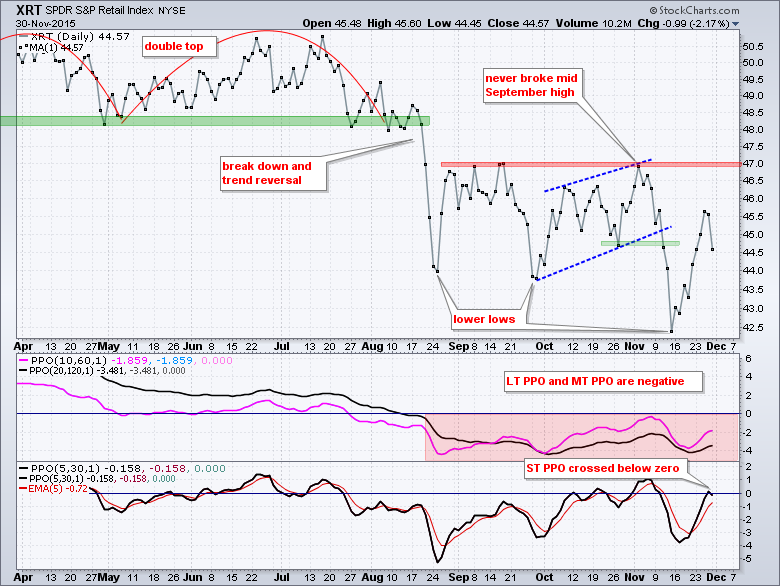
The Retail SPDR plunged around 10% in the first half of November and then surged around 7.5% in mid November. This surge came off a lower low and XRT did not come close to the early November high. Moreover, the medium-term PPO (10,60,1) and long-term PPO (20,120,1) stayed negative. Short-term, the PPO (5,30,1) moved back into negative territory on Monday to trigger a bearish signal.
Cloud and Internet Continue to Lead
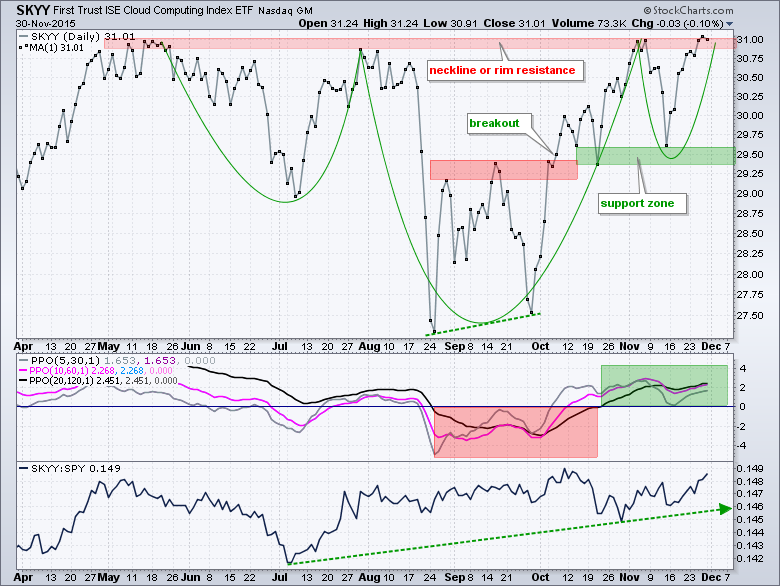
The Cloud Computing ETF (SKYY) and the Internet ETF (FDN) have been and remain two of the strongest industry group ETFs. SKYY is challenging its summer highs and forming a bullish cup-with-handle or an inverse head-and-shoulders pattern. The summer highs mark a benchmark high that chartists can use when comparing charts. Securities above or near these highs are leading. Those trading well below the summer highs are lagging and showing relative weakness, relative "chart" weakness that is. FDN is well above its summer highs and leading.

Regional Banks and Insurance Power Finance Sector
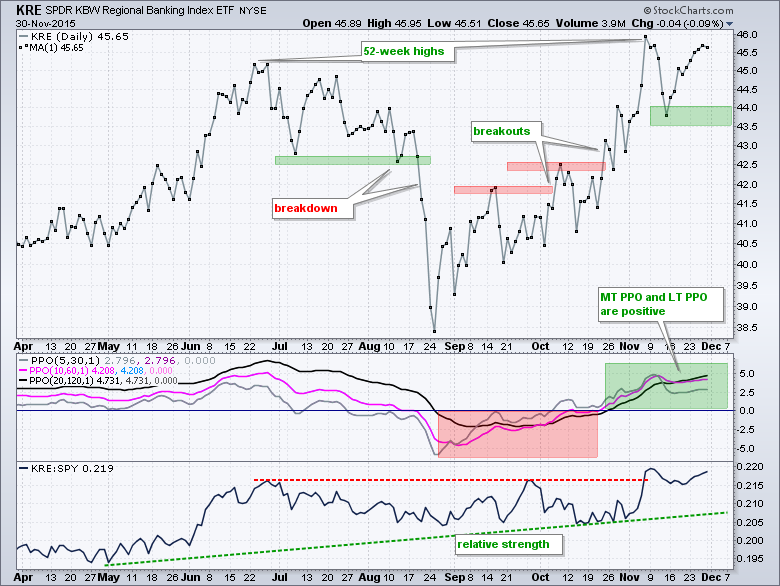
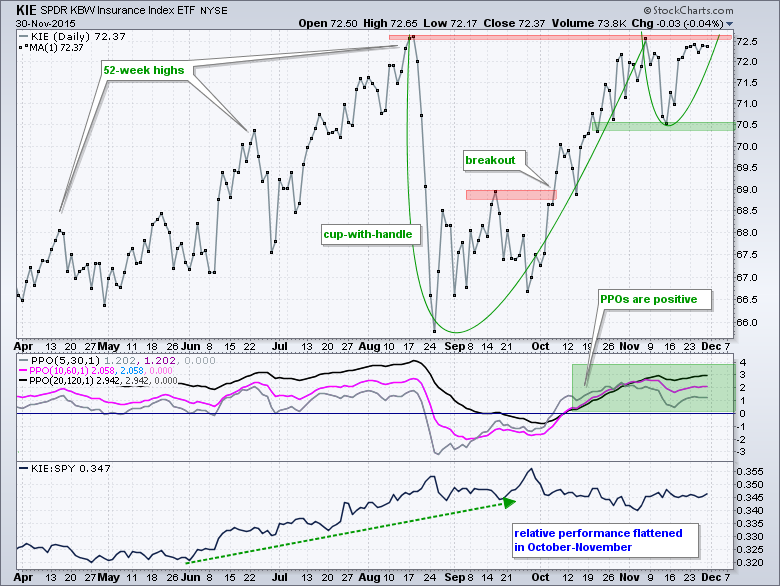
The Regional Bank SPDR (KRE) and the Insurance SPDR (KIE) are the strongest industry group ETFs within the finance sector. KRE broke above the benchmark summer highs and led the market in early November. Notice that the price relative hit a new high in November and the PPOs have been positive since late October. It has been a wild ride for the Insurance SPDR (KIE) since August with the ETF dipping below its April low and then surging back to its August high. Overall, the trend is up and a bullish cup-with-handle is taking shape. A break above rim resistance would signal a continuation of the bigger uptrend.
Current Market Themes
Below is a working list of the current market themes to keep in mind when making trading or investing decisions. There were a few changes as the Home Construction iShares (ITB) broke out, two AD Lines hit new highs and the High-Low Percent indicators rebounded for the S&P MidCap 400 and S&P 500. Technology remains one of the strongest sectors and small-caps may be benefitting from the January effect. I will show some corresponding charts in today's webinar (Tuesday, December 1st, 1 PM ET). Click here to register.
- 2 of 4 High-Low Percent indicators exceeded +5% (late November)
- S&P MidCap 400 and S&P 1500 AD Lines hit new highs (late November)
- Home Construction iShares (ITB) broke out and started leading (late November).
- Tech and Finance are the strongest equal-weight sectors.
- Energy and utilities are the weakest equal-weight sectors.
- The Retail SPDR (XRT) remains in a downtrend and shows relative weakness.
- Seasonal patterns are bullish for stocks until yearend.
- January effect in play until yearend (small-caps historically outperform large-caps).
- S&P 500 AD Line hit a new high (early November)
- Breakout in the 10-yr yield and breakdown in bonds (early November)
- Rising rates positive for Nikkei, banks, brokers and insurance.
- Rising rates negative for Yen, utilities and REITs.
- Dollar breakout (late October) and strong dollar is negative for commodities.
- Oil, NatGas, gold, silver, copper and aluminum are in long-term downtrends
- The S&P 500 weekly trend turned up 23-Oct.
- The Nasdaq 100 weekly trend turned up on 9-Oct.
- The Russell 2000 weekly trend turned down on 21-Aug (and remains down).
- Small-caps have been lagging since July (but leading since 27-Oct)
****************************************
Thanks for tuning in and have a good day!
--Arthur Hill CMT
Plan your Trade and Trade your Plan
*****************************************


