Lines in the Sand for Three Key ETFs // SPY and IJR are Bullish // MDY is Lagging // Using Weekly Breadth Indicators // High-Low Percent Stalls for NYSE and Nasdaq // Will a Broad Surge follow the Broad Decline? // Scan Code for Rate-of-Change and Ranking // AD Percent Indicators Surge // Friday Food for Thought ////
Lines in the Sand for Three Key ETFs
Programming note: I will be on vacation next week. Posting in Art's Charts will be light and I will return on Tuesday, December 1st. Happy Thanksgiving week! Today we will start with the S&P 500 SPDR (SPY), S&P MidCap SPDR (MDY) and S&P SmallCap iShares (IJR) and apply the long-term trend indicators for analysis. Overall, note that SPY and IJR are in long-term uptrends, but MDY remains in a long-term downtrend. MDY, however, sports some bullish price action over the last few weeks and may jump on the bandwagon soon. I am also setting the line-in-the-sand for these three. In short, a weekly close below the mid October low would negate the early October reversal-surge and call for a serious rethink. As the stock market now stands, I remain bullish overall and will remain so until the evidence turns.
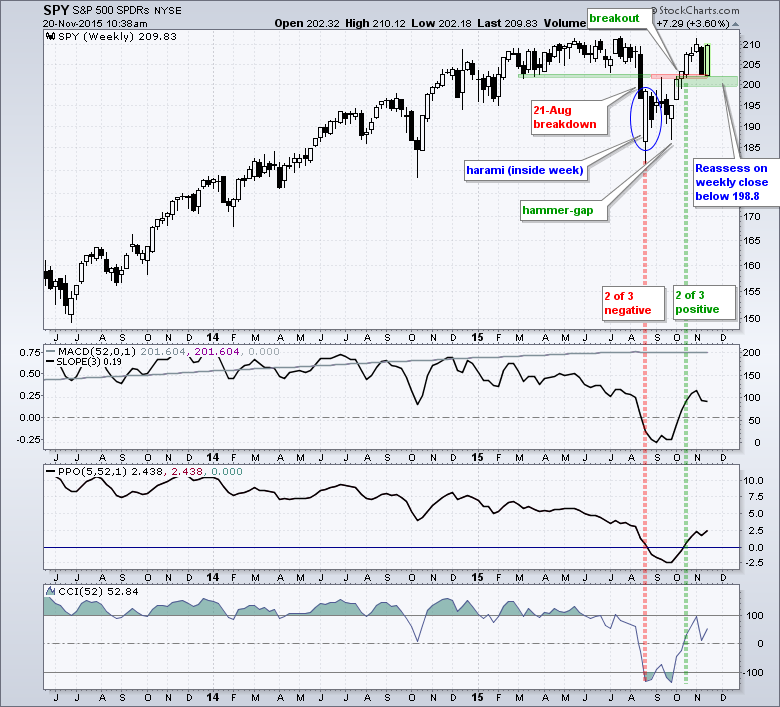
SPY is net bullish after the ETF broke above the mid September high and all three indicators turned positive on October 23rd. Notice how the ETF formed a hammer and gapped up prior to this breakout. Support is set in the 200 area and this level held as the ETF recovered nicely after last week's decline. A close below 198.8 would clearly break support and argue for a reassessment. See my long-term indicator post for details on these trend indicators.
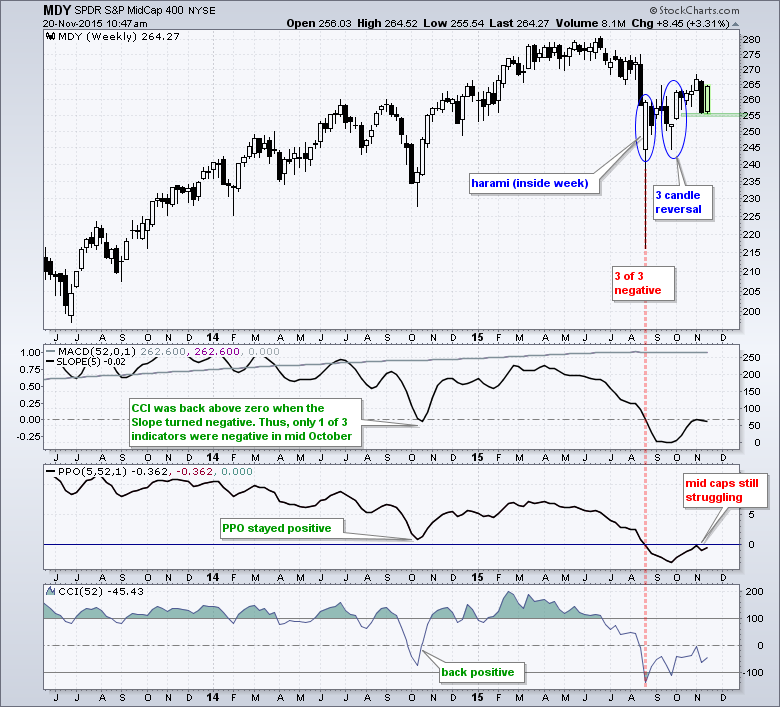
The three trend indicators remain negative for MDY, but the three-candlestick reversal in early October is still holding. Notice that MDY formed a big harami in August to signal indecision and then forged a three candlestick reversal that included a hammer, gap and surge. The ETF fell sharply last week and threatened to negate this reversal, but recovered this week and I will set my line in the sand at 255. A close below this level would negate the three candlestick reversal and this would be, well, negative.
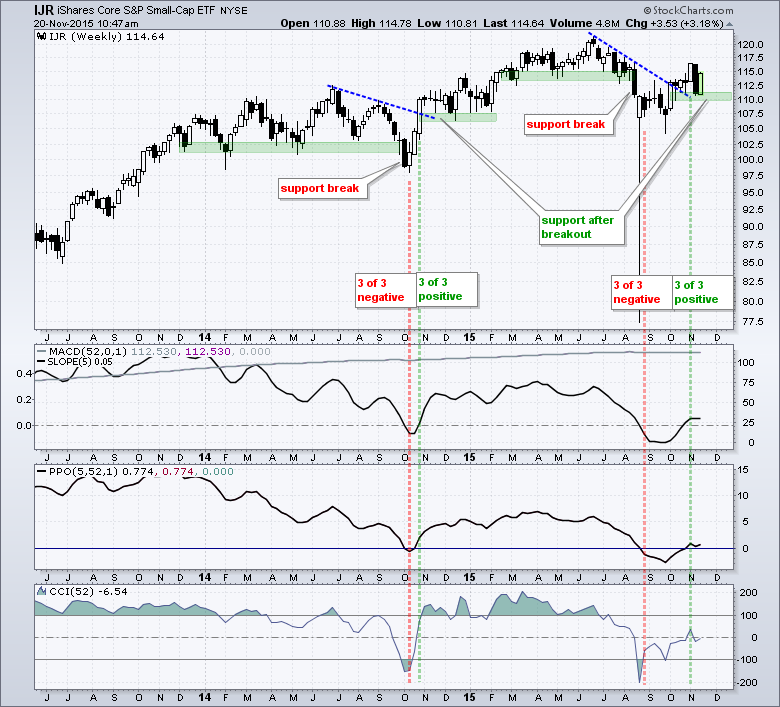
In contrast to the Russell 2000 iShares (IWM), the trend indicators for the S&P SmallCap iShares (IJR) are net bullish. All three turned positive at the end of October. CCI is back negative, but the Slope of the 52-week EMA and the PPO(5,52,1) are still positive. It would take two negatives to tilt the balance back to the bears. On the price chart, the ETF broke out in October, fell back sharply last week and rebounded this week. The rebound is still wanting because it has yet to exceed last week's high, but the rebound occurred at the right place and kept the breakout alive. A close below 109.8 would negate this rebound and call for a reassessment.
Weekly Breadth Indicators
Chartists looking to weed out some of the day-to-day noise can turn to weekly breadth indicators. It is easy to find weekly indicators by searching the symbol catalog for the term "weekly" (sans quotation marks). The indicators with a symbol preceded by an exclamation mark come from Greg Morris' book, The Complete Guide to Market Breadth Indicators. You can read more about these indicators in Greg's blog or simply Google the term. Here is a StockCharts search for the term "CGMBI", which Greg uses in his blog titles to reference his book.
High-Low Percent Stalls for NYSE and Nasdaq
The first weekly breadth chart shows weekly 52-week highs and lows for the NYSE and Nasdaq. The green-red histogram plots an "up/down pair", which is new highs and new lows. The black-red histogram plots net new highs as a percentage of total issues. I am using the S&P 500 Equal-Weight Index ($SPXEW) as the benchmark index because it includes NYSE and Nasdaq stocks.
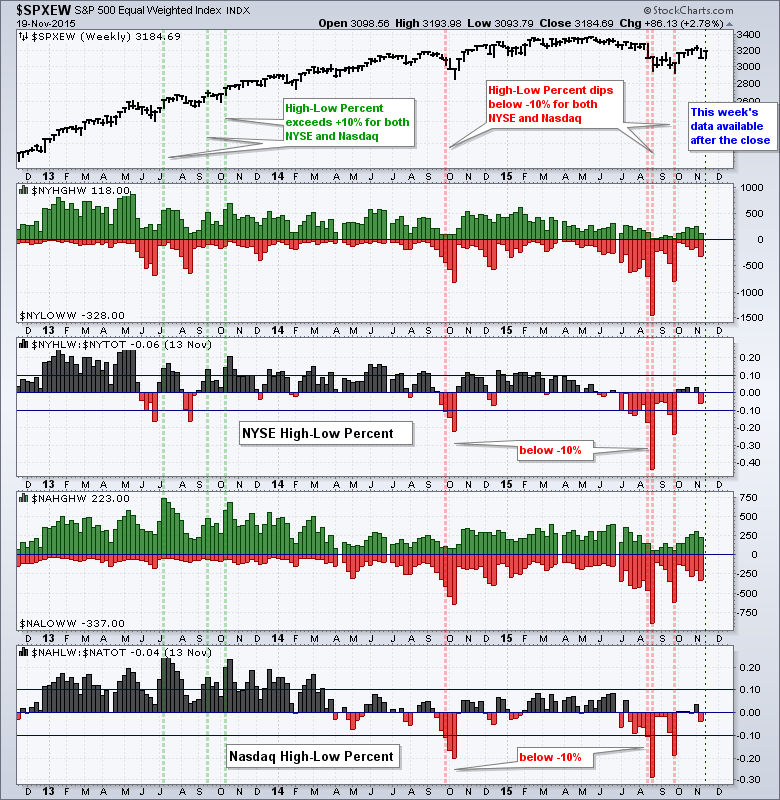
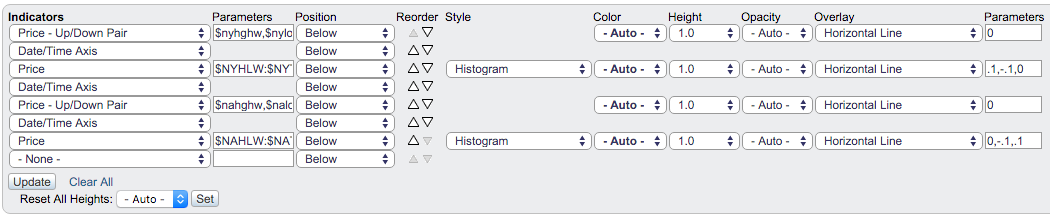
It is significant when High-Low Percent for both exchanges moves above +10% or below -10%. It is only significant when BOTH do it. The green dotted lines show some bullish instances in 2013. The red dotted lines show some bearish instances on 4-Oct-14, 21-Aug-15 and 2-Oct-15. These two indicators have hovered near the zero line in recent weeks because new highs and new lows have been relatively equal since the second week of October. The standoff with highs and lows reflects the bifurcation in the broader market right now. Both High-Low Percent indicators need to move above +10% to put the bulls back on track. Below is a screen shot of the settings for the chart above. (Note: Because this chart uses more than 6 datasets, you need a PRO subscription to see the live version.)
Will a Broad Surge follow the Broad Decline?
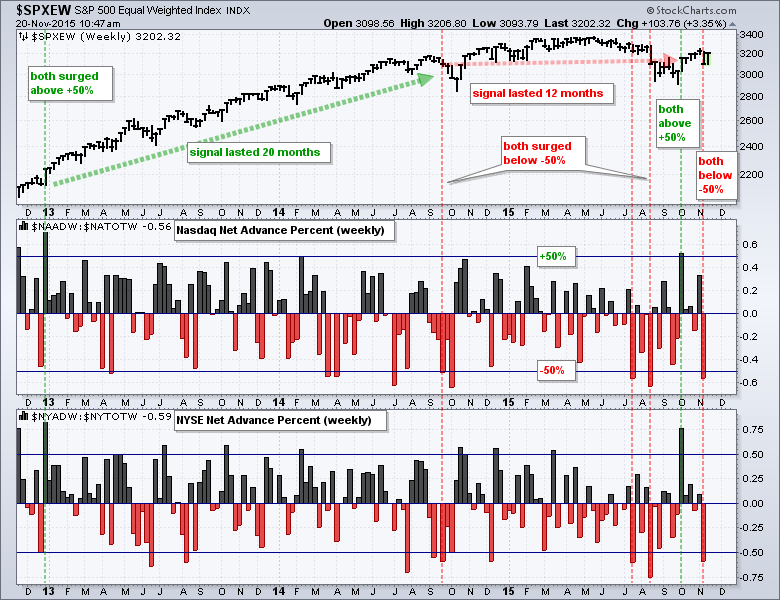
Chartists can apply the breadth thrust concept to weekly advance-decline data on the NYSE and Nasdaq. The chart below shows Nasdaq Net Advance Percent and NYSE Net Advance Percent as histograms. Net advance percent is the difference between weekly advances and weekly declines divided by total issues. A bullish breadth thrust triggers when BOTH surge above +50% and this signal remains valid until countered with a bearish breadth thrust, which triggers when both plunge below -50%. As you can see from the chart, it is important that BOTH cross the bullish or bearish threshold to trigger a signal. The bullish signal in December 2013 lasted 20 months, the bearish signal in September 2014 lasted 12 months and the bullish signal from early October lasted just a few weeks because it was countered with a bearish signal last week. Hang on to your hats because this signal may just reverse again this week. Note that some 83% of stocks in the S&P 1500 are up so far this week and a whopping 87% of Nasdaq 100 stocks are positive. Again, these weekly indicators on the chart will be updated after the close.
Scan Code for Tracking Rate-of-Change
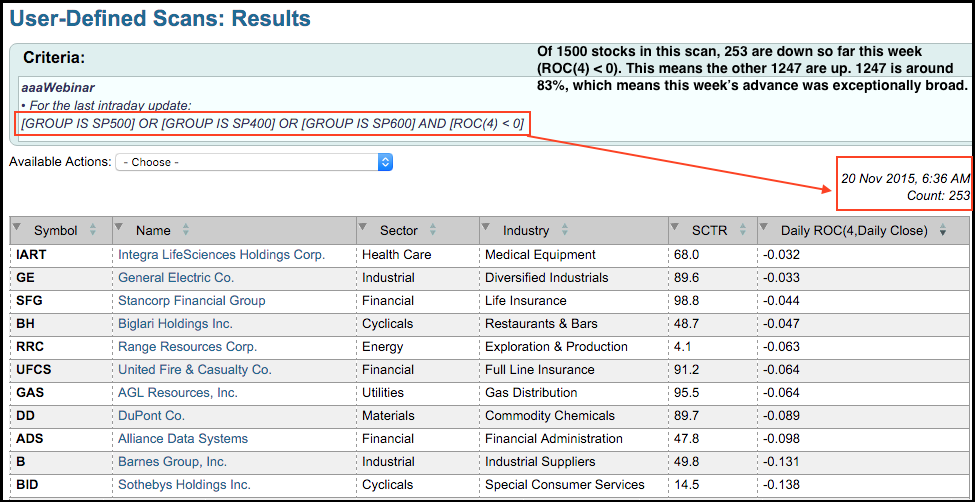
The text below shows the scan code used to generate these results and the image shows the partial results.
[GROUP IS SP500] OR [GROUP IS SP400] OR [GROUP IS SP600] AND [ROC(4) < 0]
Rank by ROC(4)
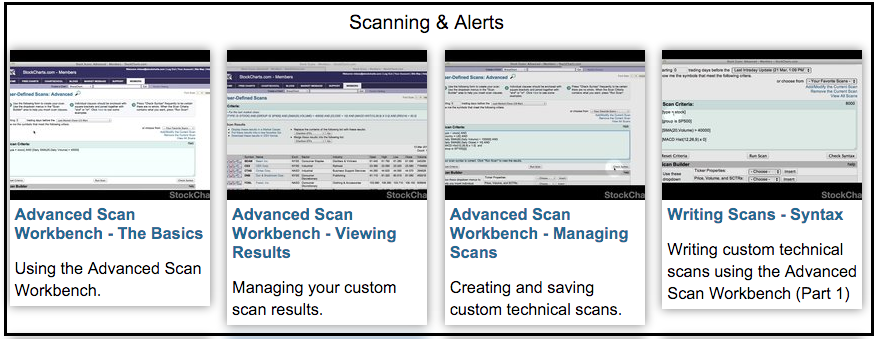
The universe is the S&P 1500 because the groups are the S&P 500, S&P MidCap 400 and S&P Small-Cap 600. I am looking for stocks with a 4-day Rate-of-Change below zero. This will change to 5 after Friday's close. I could scan for stocks with a positive 4-day Rate-of-Change, but more than 1000 stocks qualify and the scan results max out at 999. I must, therefore, reverse engineer the scan. Check out our video tutorials on scanning to learn more. The "Scanning & Alerts" tutorials are at the bottom of the page.
AD Percent Indicators Surge
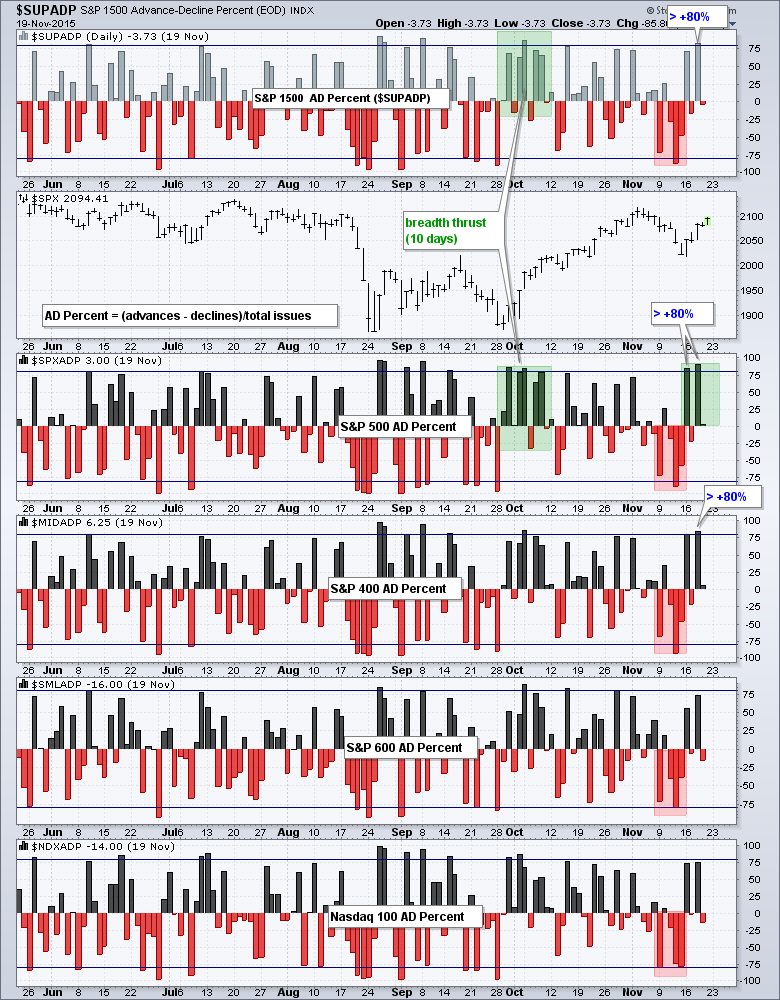
We can get an idea of this week's participation by looking at the daily advance-decline indicators. The chart below shows S&P 1500 AD Percent ($SUPADP) in the top window and AD Percent for the S&P 500, S&P MidCap 400, S&P Small-Cap 600 and Nasdaq 100 in the other windows. The S&P 500 led the breadth thrust in late September and early October (green shading). We then witnessed broad selling pressure last week as AD Percent exceeded -80% for the S&P 1500, S&P 500 and S&P 400 (red shading). Such strong selling pressure is a concern, but the market immediately righted itself with two days of broad buying pressure this week. Notice that S&P 1500 AD Percent exceeded +80% once, S&P 500 AD Percent exceeded +80% twice and S&P MidCap AD Percent exceeded +80% once.
Friday Food for Thought
Anthony Garner talks about momentum and diversification, which are the key concepts behind his system.
Adam Grimes put out a nice podcast discussing the decisions and tradeoffs involved in trade management.
Goldman's BRIC Era Ends as Fund Folds after Years of Losses (Bloomberg). What a surprise! Brazil, Russia, India and China really are different.
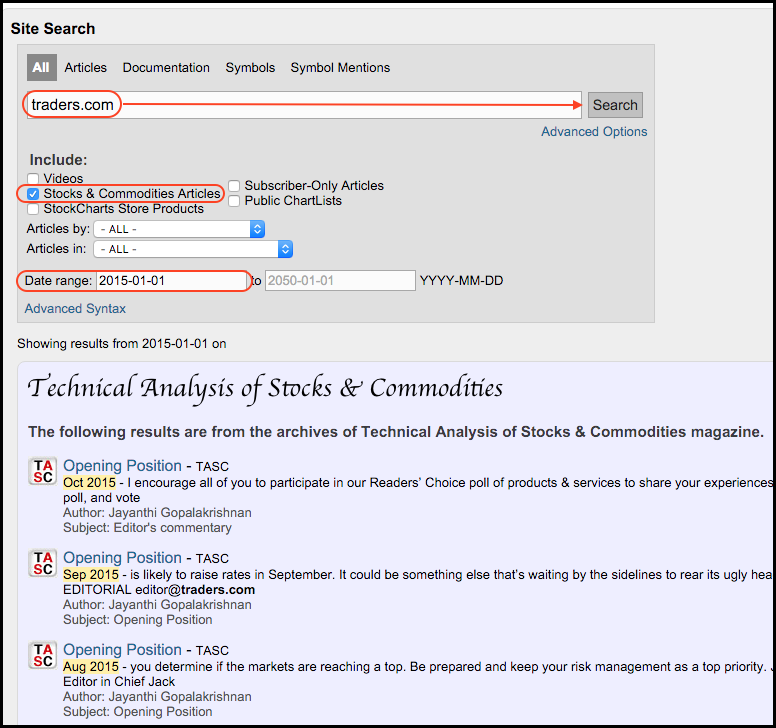
Howard Bandy talked about system development with Jayanthi Gopalakrishnan in October issue of Stocks & Commodities Magazine.
Note that StockCharts subscribers also have access to Stocks & Commodities Magazine. All you have to do is put up with a few adverts to read great articles every month.
****************************************
****************************************
Thanks for tuning in and have a good day!
--Arthur Hill CMT
Plan your Trade and Trade your Plan
*****************************************


