SPY Holds Short-term Breakout // IWM Shows Relative Chart Strength // 2-yr Yield versus the 10-yr Yield // Watching the Channel in IEF // Two Commodities in Uptrends // Legacy Airlines Sport Constructive Chart Patterns // Big Banks Consolidate after Surge // Short-term Bearish Patterns in XOM and CVX // Other Charts: ADI, APD, CAT, CAMP, NOK, SIGI, ULTI ////
SPY Holds Short-term Breakout
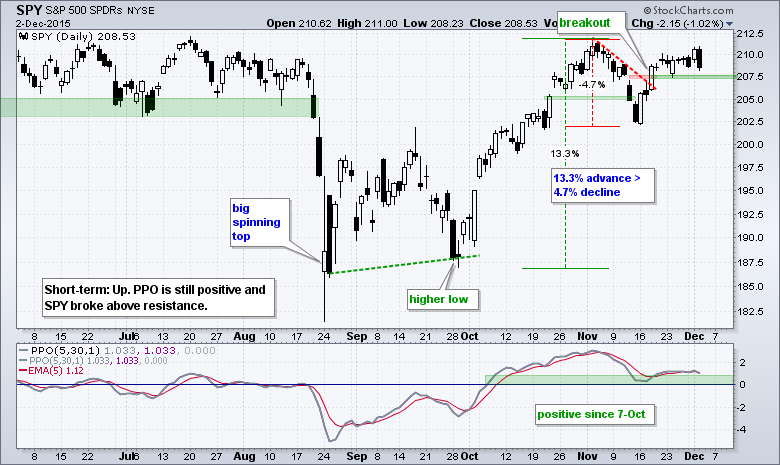
SPY broke out with a three day surge in mid November and this breakout is holding. The ETF established short-term support with the late November low in the 207.5 area. A close below 207.4 would provide the first sign of short-term weakness. Even though a support break would be negative, I would not turn too negative because the bigger trend is up and the seasonal patterns are bullish until yearend. The mid November low marks key support in the 201-202.5 area and this is the most important level to watch. The PPO (5,30,1) remains above the zero line, but dipped below its 5-period EMA. Momentum is slowing, but the short-term trend is up as long as the PPO stays positive.
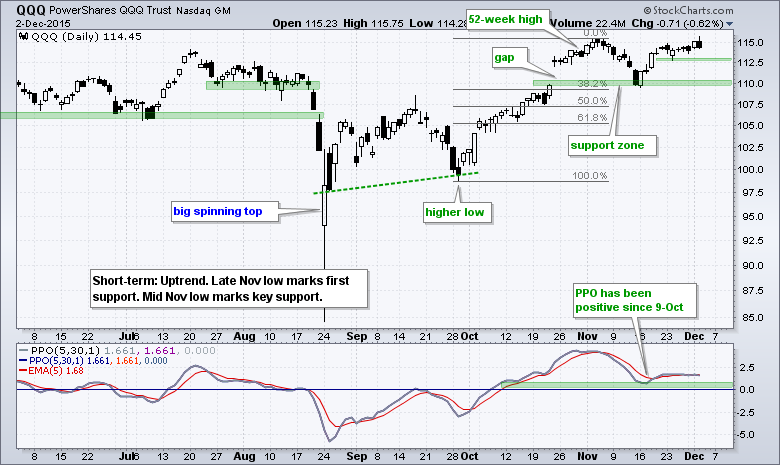
QQQ held support with a bounce in the second half of November and is now challenging the early November high. I am not going to call this resistance because the trend is up and resistance levels are not that important in an uptrend. An uptrend assumes rising prices and higher highs. Support levels, in contrast, are important because the trend is subject to a reversal when they are broken. The late November lows marks first support in the 112.5 area and the mid November low marks key support in the 110 area.
IWM Shows Relative Chart Strength
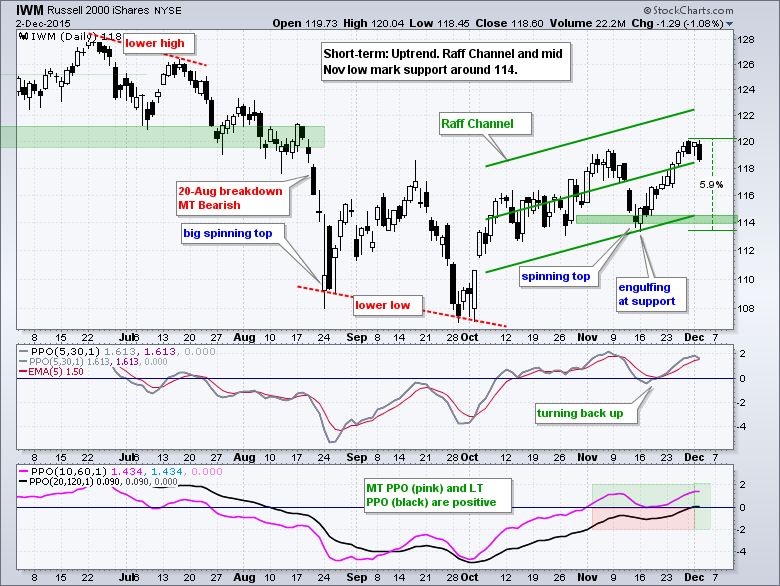
The Russell 2000 iShares (IWM) bounced off support in mid November and moved above the early November high. Note that QQQ and SPY did not exceed their early November highs, but IWM did. This shows relative "chart" strength. The bullish engulfing and upturn in the PPO (5,30,1) provided a nice short-term signal in mid November as the ETF advanced around 6%. Even though IWM fell back the last few days, the overall trend is up and pullbacks are viewed as opportunities, not threats. The Raff Regression Channel and mid November lows mark key support in the 114 area.
The indicator window shows the medium-term PPO (10,60,1) in pink and the long-term PPO (20,120,1) in black. Notice that both are positive for the first time since early August. This suggests that the long-term trend may be turning up for IWM. Short-term, the PPO (5,30,1) is a bit extended and we will have to wait for a bullish setup, which may or may not come. A bullish setup occurs when the PPO (5,30,1) moves to the zero line and this indicates a pullback or short-term consolidation. A subsequent upturn triggers a bullish signal. You can read more about the PPO strategy here.
2-yr Yield versus the 10-yr Yield
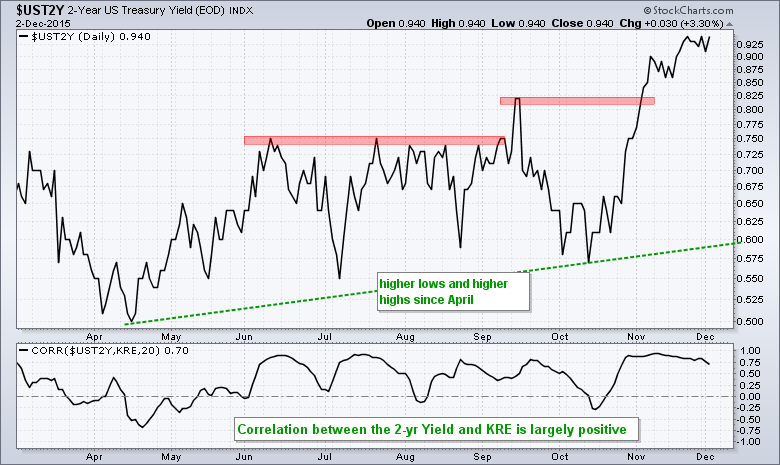
There is an interesting dynamic working in the bond market as the 2-year Treasury Yield ($UST2Y) rises and the 10-year Treasury Yield ($UST10Y) falls. The 2-yr yield is trading near its highs and in a clear uptrend. This short-term yield is closer to the Fed Funds rate and reflects the likelihood for a rate hike at the next Fed meeting. Even though the yield curve has flattened the last few months, the indicator window shows a positive correlation between the 2-yr Yield and the Regional Bank SPDR (KRE). Perhaps banks are just happy to see the end of ZIRP (zero interest rate policy).
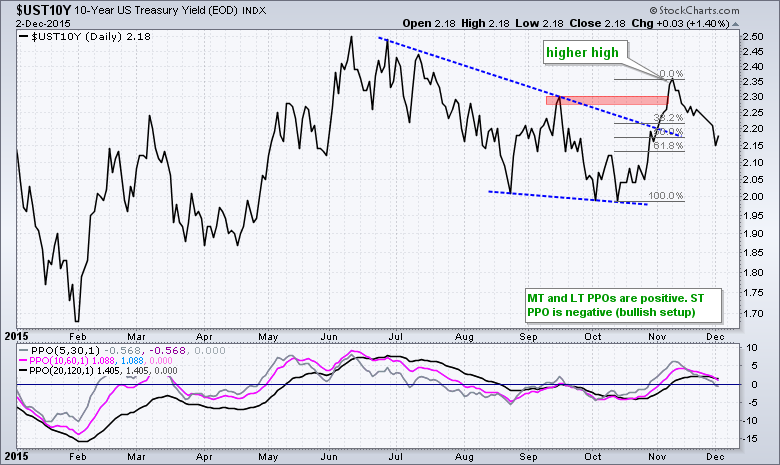
The 10-Yr Yield is nearing a potential reversal area. After breaking out and forging a higher high, the yield fell back and retraced 50-62% of the prior move. At this stage, I still think the October-November surge and breakout outweigh the pullback over the last two to three weeks. A pullback can be expected after a sharp move and this is the area to expect the pullback to end. The indicator window shows the PPO (20,120,1) and PPO (10,60,1) in positive territory. The PPO (5,30,1) turned negative and this created a bullish setup. An upturn and move back into positive territory would trigger a bullish signal.
Watching the Channel in IEF
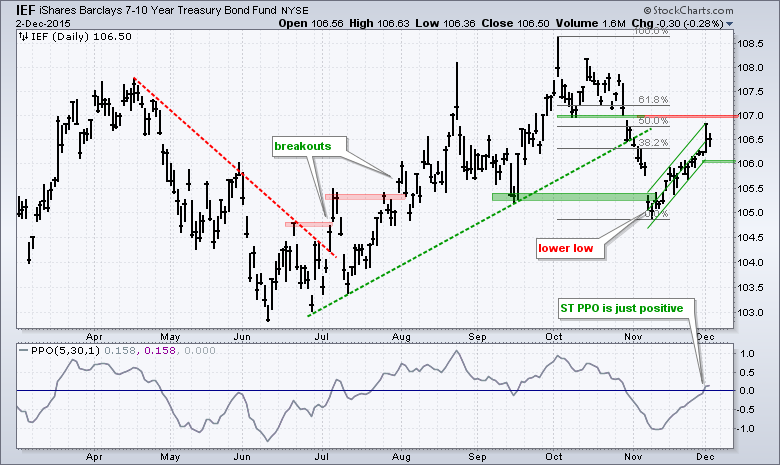
The 7-10 YR T-Bond ETF (IEF) is also at a moment-of-truth because the current bounce retraced 50-62% of the prior decline. Also notice that broken support turns resistance in the 107 area. The trend filter is mixed because the long-term PPO (20,120,1) is positive and the medium-term PPO (10,60,1) is negative. I am therefore watching the PPO (5,30,1) closely. A move into negative territory and a price break below 106 would reverse the upswing in IEF.
Two Commodities in Uptrends
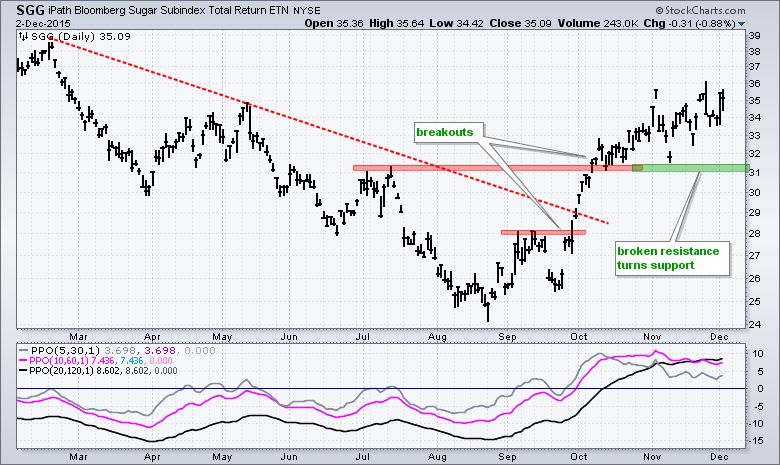
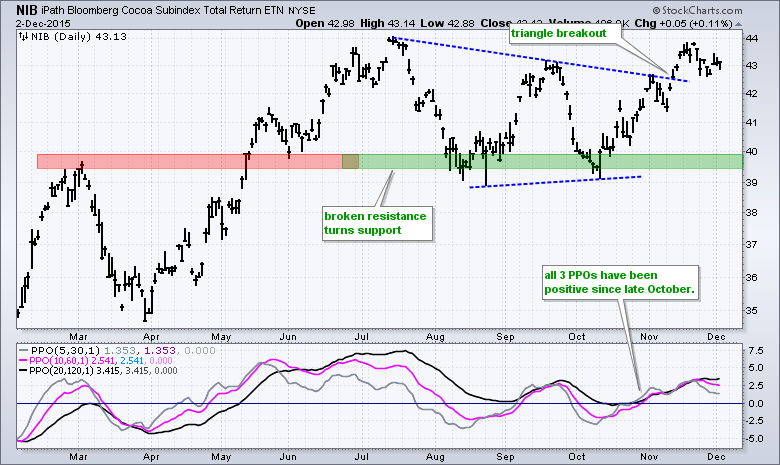
Most commodities are in long-term downtrends, but two have broken away from the pack and sport long-term uptrends. The long-term trend indicators for the Sugar ETN (SGG) turned positive last week and the daily chart shows two breakouts. The last breakout around 31 turns into support and this is the first level to watch for signs of weakness. The long-term indicators for the Cocoa ETN (NIB) have been positive since May when the ETF broke above its March high. The breakout zone turned into support and held with two tests in August and October. Most recently, NIB broke triangle resistance in mid November. You can read more about the long-term trend indicators here.
15 Stock Charts Worth Watching
This next section will highlight some individual stock setups and chart patterns. Keep in mind that one should plan their trade before taking action and trade according to that plan. We should also think in terms of portfolios, not individual trades. The goal is not to be correct 100% of the time. Instead, the goal is to manage risk so that the gains outpace the losses. Portfolio risk can be managed through diversification and position sizing.
Airlines Sport Constructive Chart Patterns
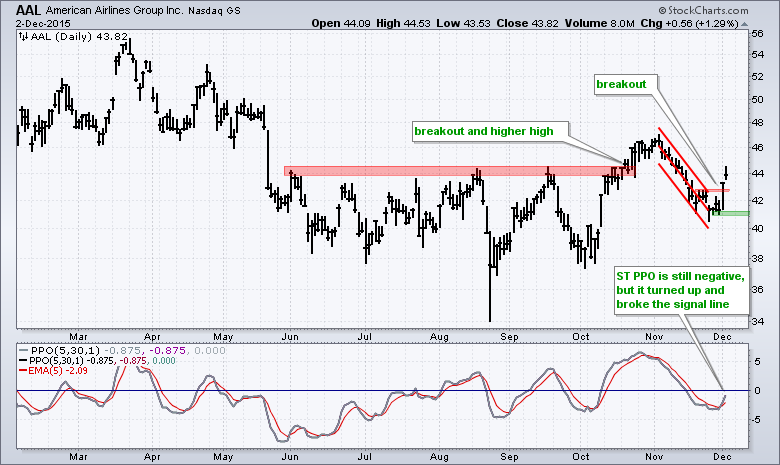
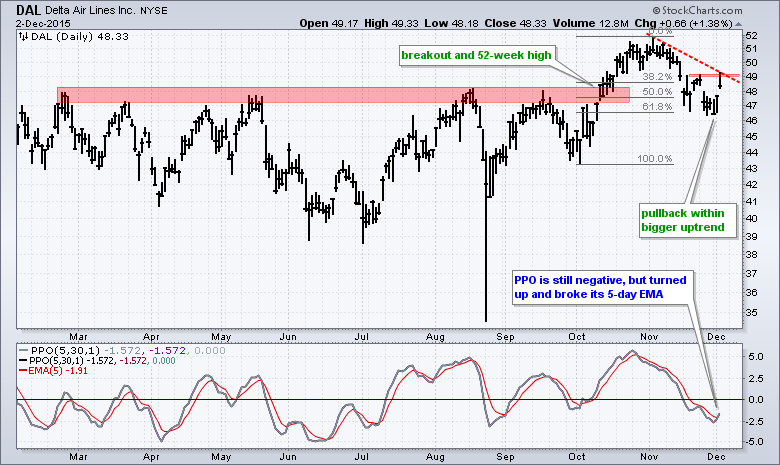
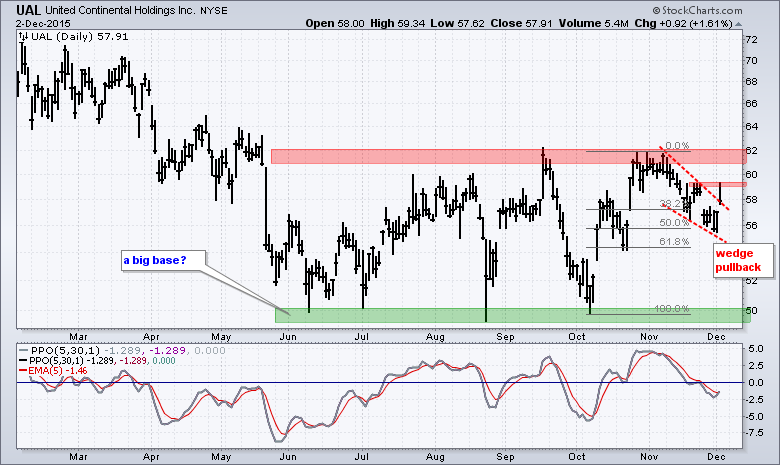
Airlines are perking up with nice moves in American (AAL), Delta (DAL) and United (UAL) over the last two days. Even though these three closed off their highs on Wednesday, the overall chart patterns look constructive and we saw some short-term breakouts this week. Note that the medium-term PPO (10,60,1) and long-term PPO (20,120,1) are split for these three (one positive and one negative). This means the trend filter is not 100% bullish. Nevertheless, I see constructive chart patterns over the last few months and the possibility for short-term breakouts soon.
Big Banks Consolidate after Surge
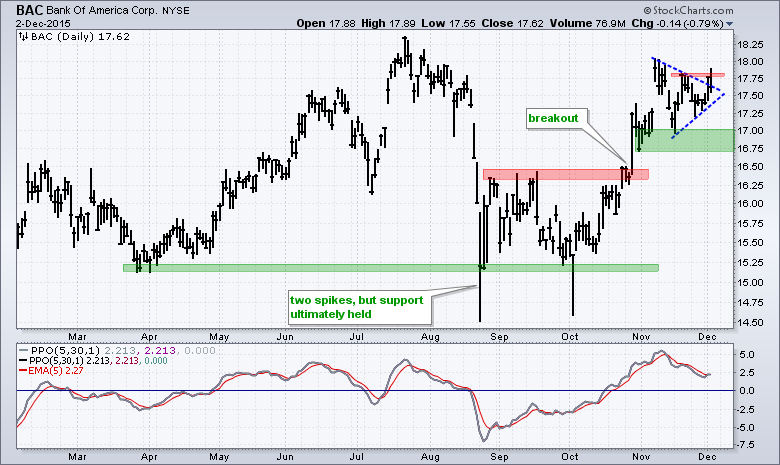
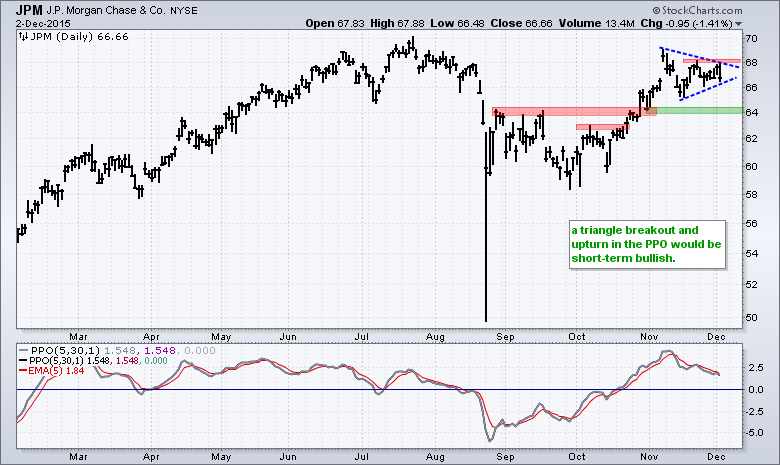
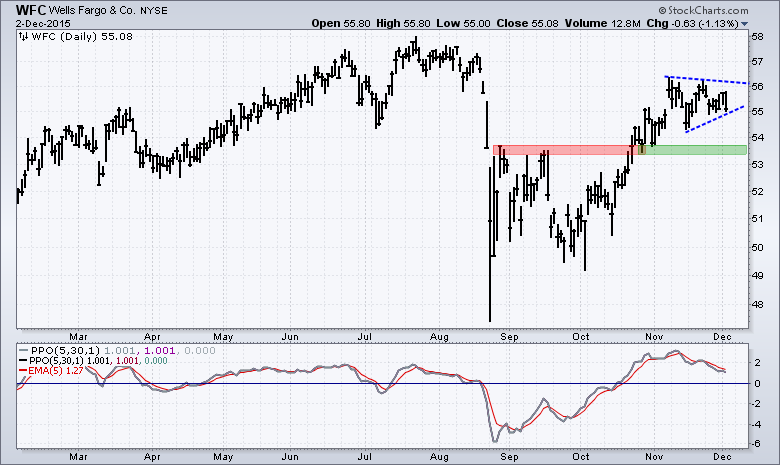
The big banks are also at interesting junctures on the price charts. Note that the finance sector is one of the strongest sectors and the trend filter is clearly bullish for most banking stocks. The trend filter is bullish when the medium-term PPO (10,60,1) and long-term PPO (20,120,1) are positive. Bank of America (BAC), JP Morgan (JPM) and Wells Fargo (WFC) surged from late September to early November and then consolidated the last few weeks. Upside breakouts would signal a resumption of the uptrend and target new highs.
Short-term Bearish Patterns in XOM and CVX
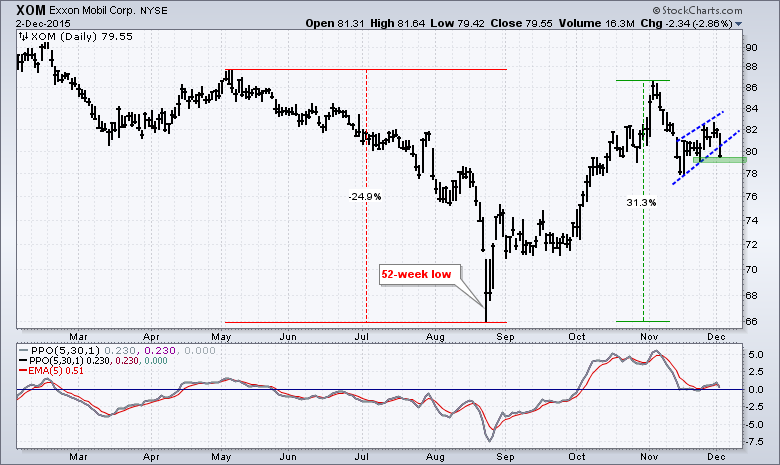
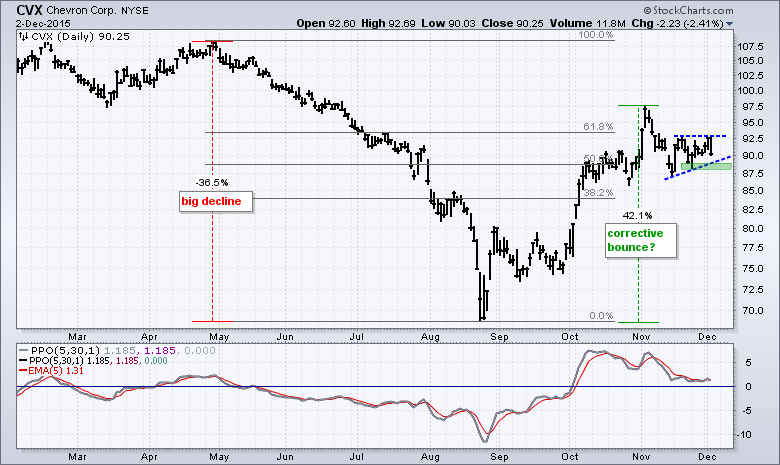
The Energy SPDR (XLE) declined sharply on Wednesday and its two biggest holdings look vulnerable. Even though the trend filter for ExxonMobil and Chevron is bullish, I am making a judgment call that the long-term bias is down because both stocks recorded 52-week lows in August. The bounce from late August to early November was indeed strong, but XOM peaked below its May high and CVX retraced around 62%. XOM formed a bear flag the last few weeks and CVX formed a wedge. Support breaks and a move below zero in the PPOs would be short-term bearish.
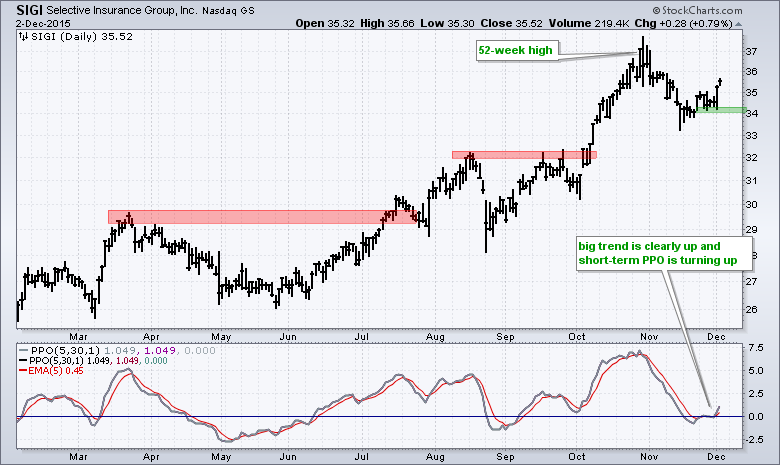
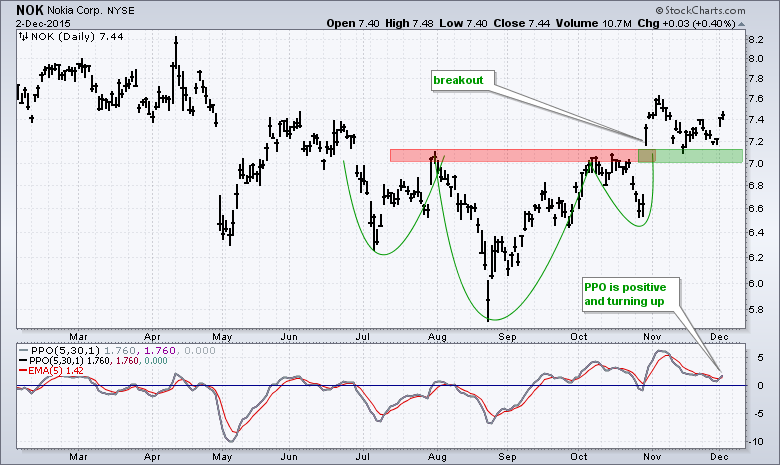
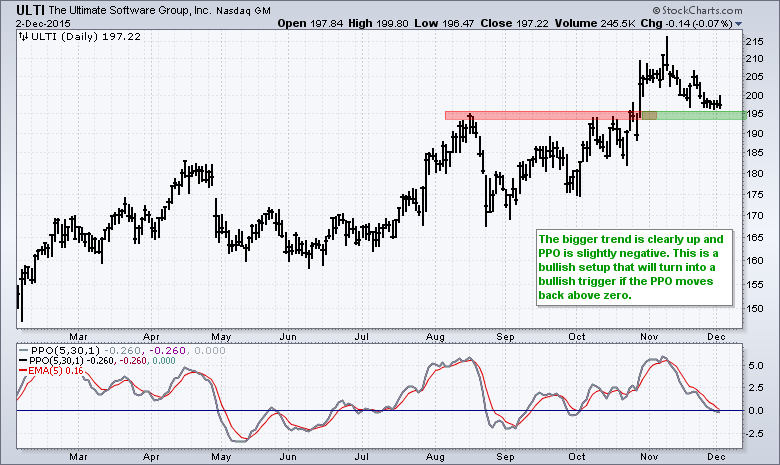
Other Charts: ADI, APD, CAT, CAMP, NOK, SIGI, ULTI
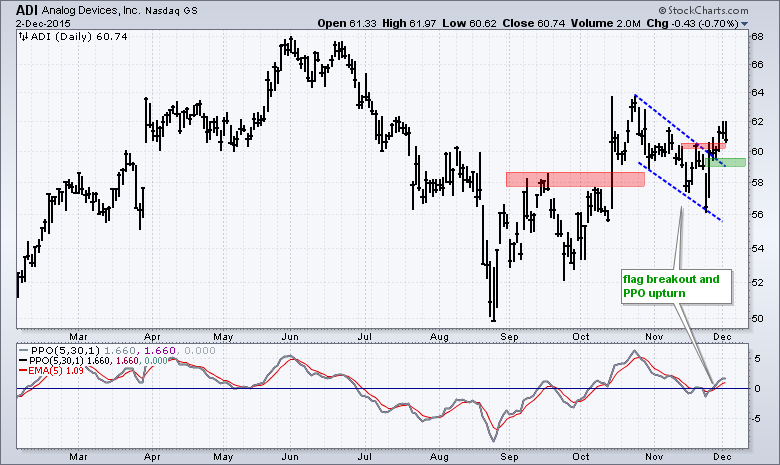
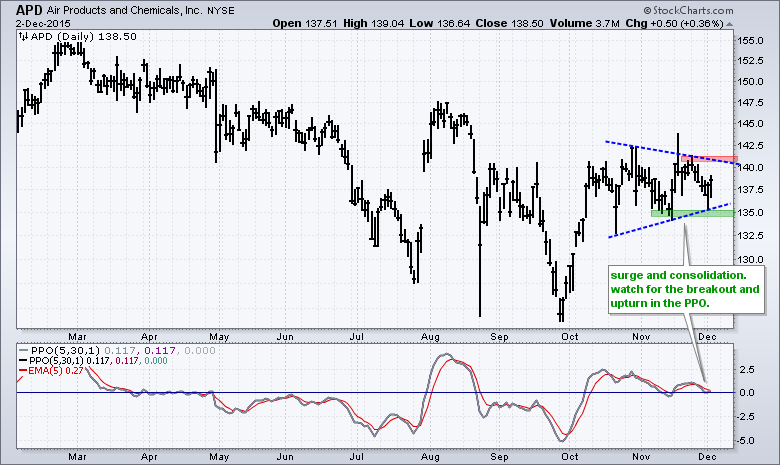
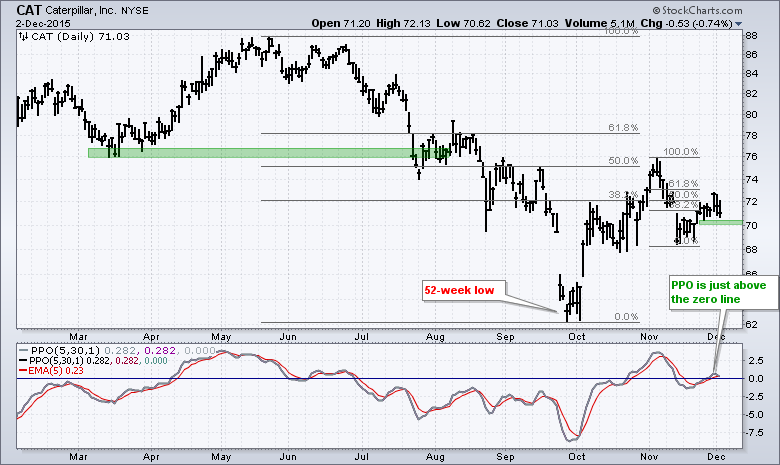
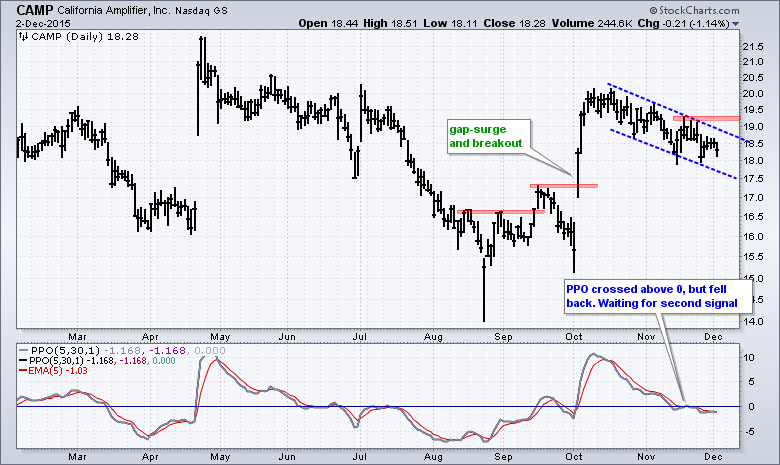
****************************************
Thanks for tuning in and have a good day!
--Arthur Hill CMT
Plan your Trade and Trade your Plan
*****************************************

