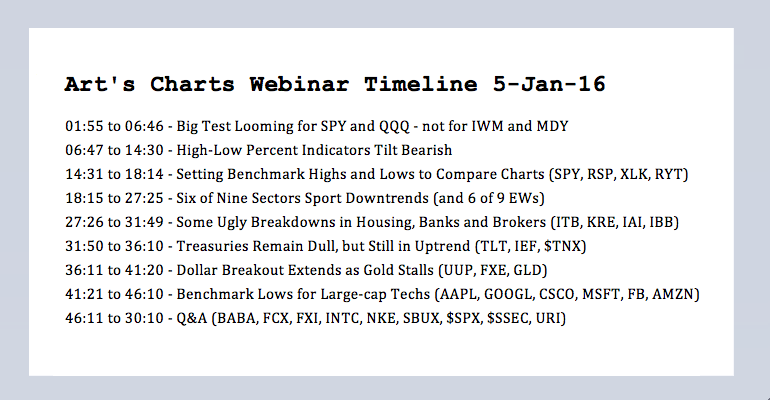
A Tale of Two S&P 500 Indices // The Last Three Sectors Standing // Sector Breadth Tilts Bearish // Index High-Low Indicators Remain Split // Short-term Bullish Signal for Dollar // Treasury Trading Turns Dull // Webinar Video ////
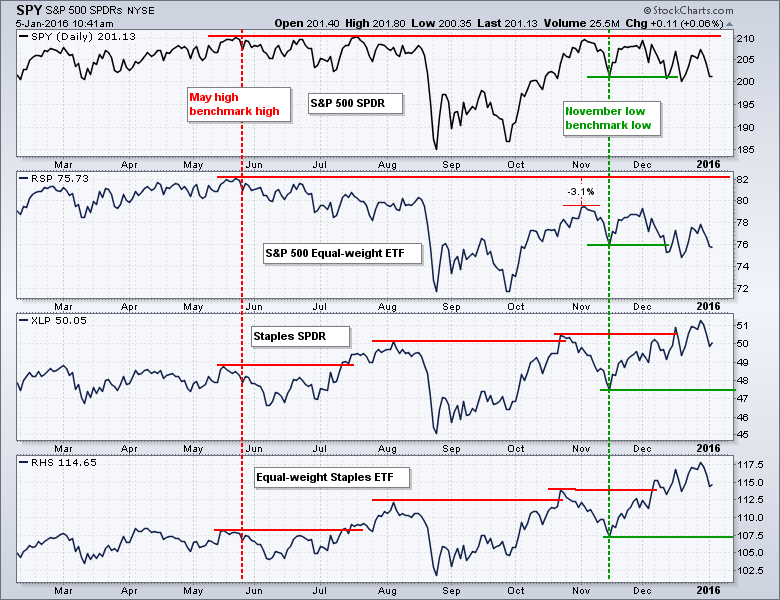
The easiest way to visualize the current split in the market is by comparing the S&P 500 Large-cap ETF (SPY) with the S&P 500 Equal-Weight ETF (RSP). Both have the same stocks, but their performance metrics are clearly different. Large-caps are keeping the market-cap dominated S&P 500 afloat, while small and mid caps are weighing on the equal-weight S&P 500. Even though we can consider the long-term trends down for RSP, the S&P SmallCap iShares (IJR), the S&P MidCap SPDR (MDY) and the Russell 2000 iShares (IWM), I do not think SPY and QQQ are in long-term downtrends just yet. A true bear market is not possible until these two large-cap ETF join the breakdown parade. And....both are testing key support right now.
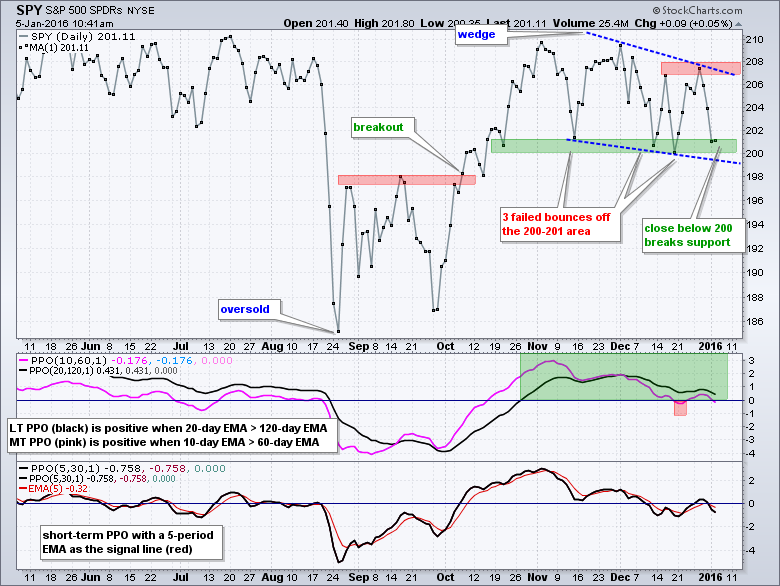
The S&P 500 SPDR (SPY) is testing an important support zone after a sharp decline the last three days. Notice how the ETF bounced off the 200-201 area three times from mid November to mid December. There is clearly some demand in this zone and SPY is once again testing the strength of demand. A breakdown here would negate the early October breakout and turn this chart bearish. The medium-term PPO (10,60,1) and long-term PPO (20,120,1) remain positive and chartists can watch these to indicators for further signs of an evolving downtrend. QQQ will be shown in the webinar.
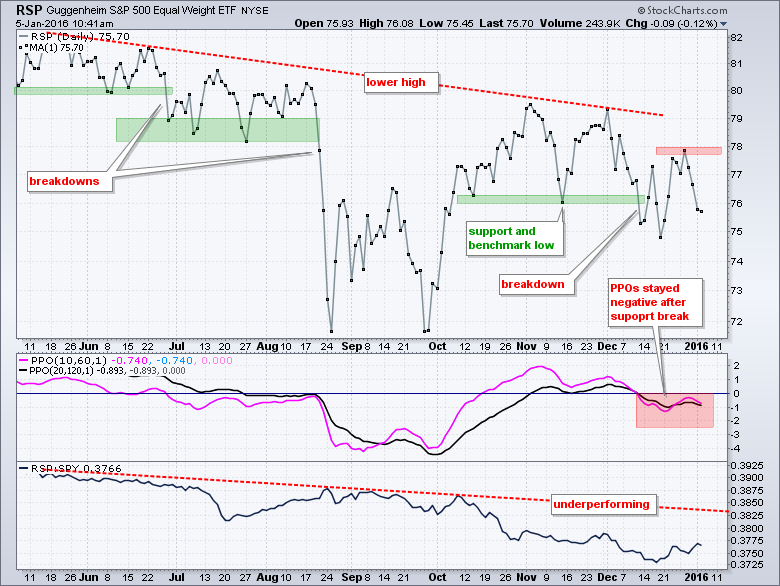
The second chart shows the EW S&P 500 ETF (RSP) with a much weaker chart than SPY. Small-caps, mid-caps and equal-weights continue to lag and show more selling pressure. RSP did not come close to its summer highs and formed lower highs in early November and early December. The ETF broke support the second week of December, turned volatile the last three weeks of the year and closed back below the mid November low on Monday. Notice that the medium-term PPO (10,60,1) and long-term PPO (20,120,1) have been negative since the second week of December. The trend here is clearly down.
The Last Three Sectors Standing
Chartists can use benchmark highs and benchmark lows to measure relative chart performance. Based on this concept, technology, healthcare and consumer staples are the only three sectors holding up right now. The chart below shows SPY, RSP, the Technology SPDR (XLK) and the EW Technology ETF (RYT) with benchmark highs marked in May and benchmark lows marked in November. A benchmark high is an important peak that chartists can use to compare chart performance. Conversely, a benchmark low is an important trough that charts can use to compare chart performance. SPY almost reached its May high in November, but RSP fell well short of this benchmark high and showed relative chart weakness. In other words, buying pressure was not strong enough to push prices back to this high. XLK exceeded its May high in late October and showed relative chart strength. RYT exceeded this high in early December and showed relative chart strength.
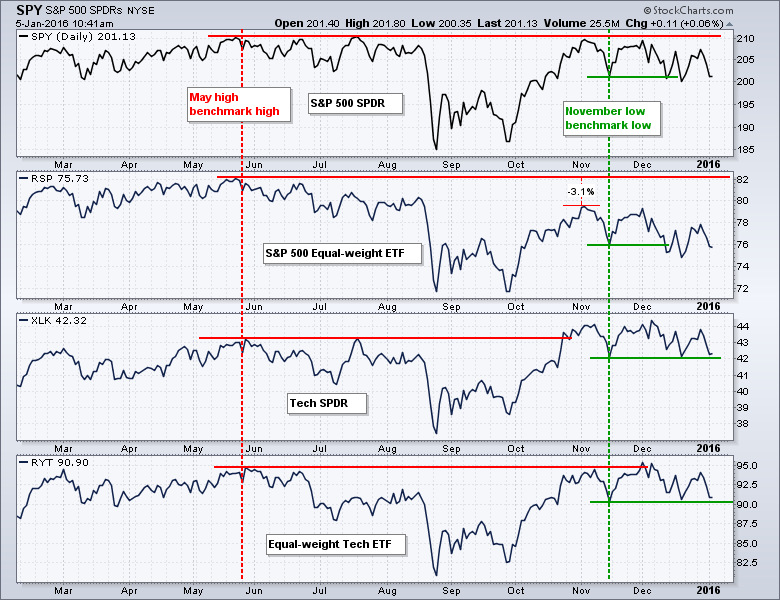
The November lows can be used to set a benchmark low. Stocks and ETFs holding above this low show relative chart strength, while those below this low show relative chart weakness. Note that SPY and RSP broke this benchmark low in mid December, but XLK and RYT held above this low. Both XLK and RYT are, however, quite close and could break support here soon. The chart below shows the Consumer Staples SPDR (XLP) exceeding its May high in early August and hitting new highs in October and November.
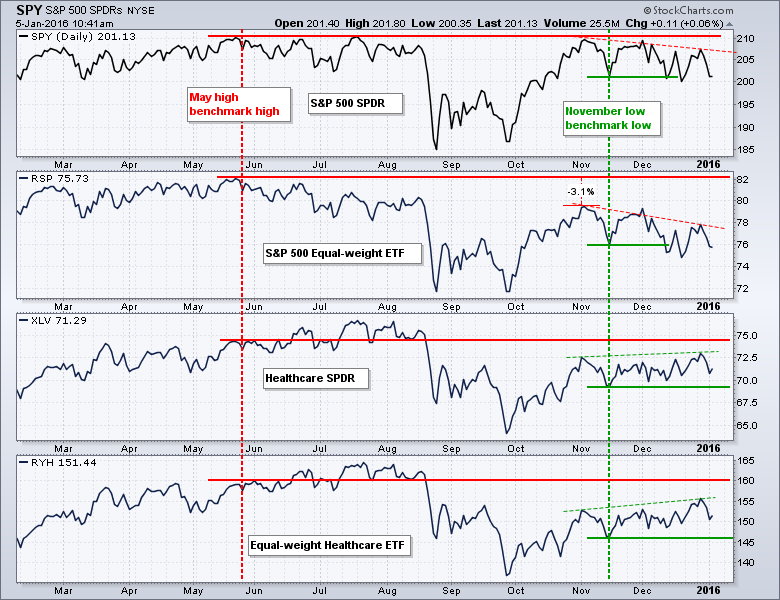
The healthcare sector is a bit of a strange one because it showed relative chart strength in July by moving above the May high, but got hit hard in August-September and remains well below its summer highs (and May high). Thus, one could make the case for relative chart weakness in healthcare overall. Despite this, notice that the healthcare ETFs forged higher highs from early November to late December when SPY and RSP forged lower highs (red dotted lines). The healthcare sector ETFs also remain above the benchmark low (mid November) and are holding up better than the broader market.
I will review the other sector SPDRs and equal-weight sector ETFs in the webinar. For now, note that XLY, XLF, XLI, XLB and XLE broke their mid November lows. Similarly, RCD, RYE, RYF, RGI and RTM broke their mid November lows. Clearly, the majority of sectors are trending lower and this is net negative for the broader market.
Sector Breadth Tilts Bearish
The next chart shows S&P 500 HiLo% ($SPXHLP) and High-Low Percent for the nine sectors. The horizontal lines are set at +10% and -10% to show significant increases and decreases in new highs or new lows. Note that High-Low Percent is negative when new lows outnumber new highs and positive when new highs exceed new lows. Basically, a move above +10% is net bullish until countered with a move below -10%. The S&P 500 is still net bullish because the last signal was a move above +10% on October 23rd. Even though it has yet to dip below -10%, notice that it has also failed to get back above +10% since the initial signal. This reflects a split market without a strong directional bias.
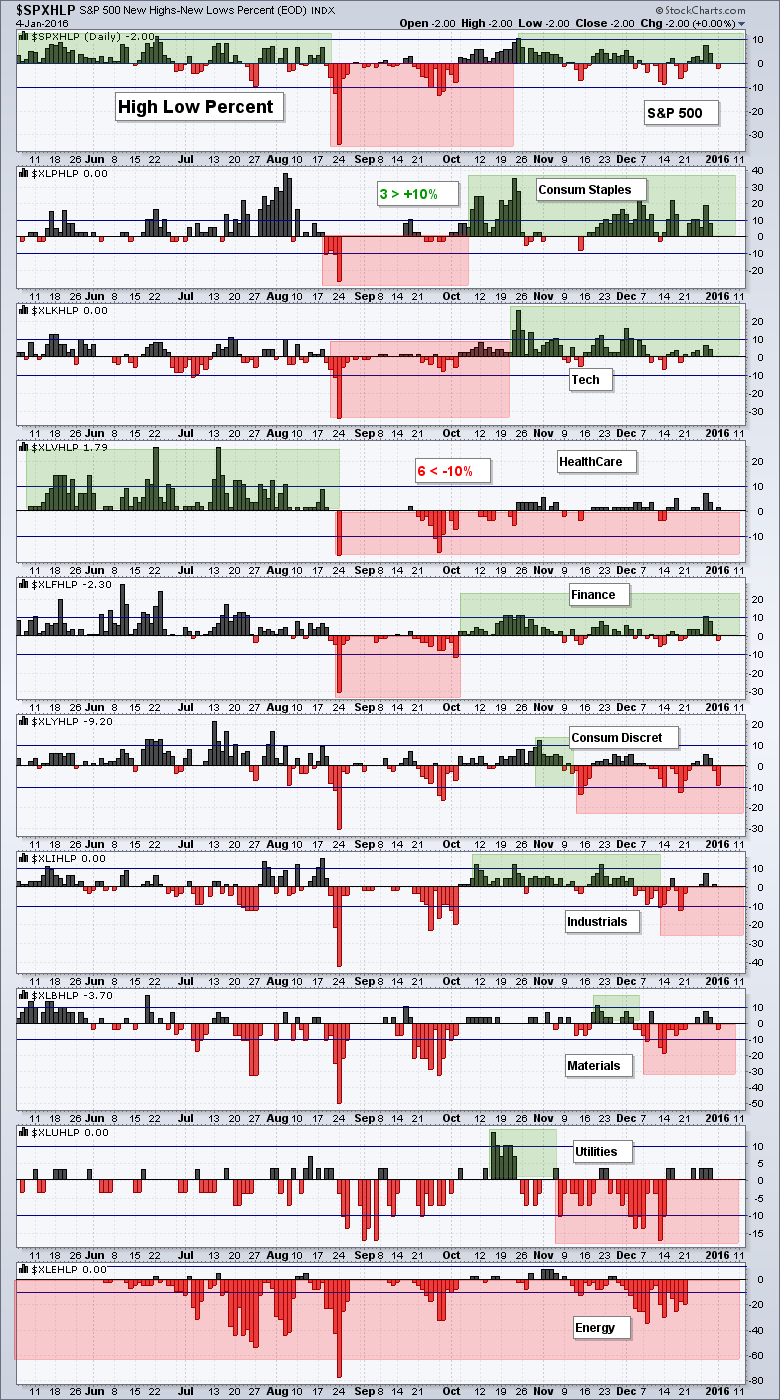
Chartists can break down this indicator by looking at the individual sectors. Note that three are on bullish signals (green shading) and six are on bearish signals (red shading). This balance shifted from bullish to bearish in mid December. The Materials HiLo% ($XLBHLP) broke below -10% in early December and Industrials HiLo% ($XLIHLP) broke below -10% in mid December. These two dipped the balance to the bears.
Index High-Low Indicators Remain Split
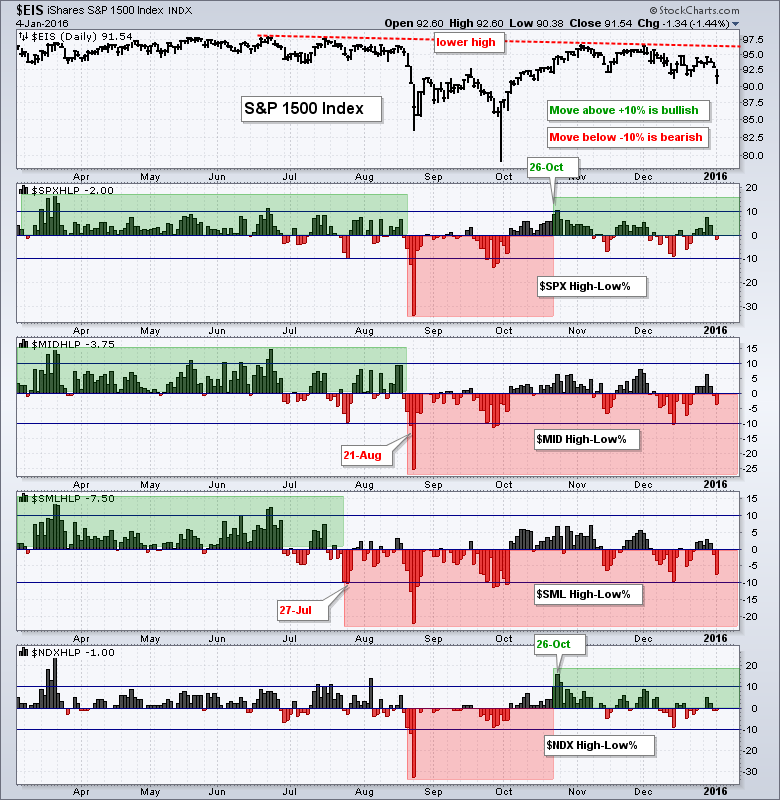
The continued large-small split in the market is evident when we look at High-Low Percent for four major stock indices: S&P 500, S&P MidCap 400, S&P Small-Cap 600 and Nasdaq 100. All four High-Low Percent indicators moved below -10% on August 21st to turn bearish. Actually, S&P 600 HiLo% ($SMLHLP) moved below -10% in late July. S&P 500 HiLo% ($SPXHLP) and Nasdaq 100 HiLo% ($NDXHLP) moved above +10% to turn bullish again on October 26th, but S&P 600 HiLo% and S&P 400 HiLo% ($MIDHLP) did not confirm and remained bearish. These two ETFs represent 1000 stocks and the majority of stocks in the S&P 1500.
Short-term Bullish Signal for Dollar
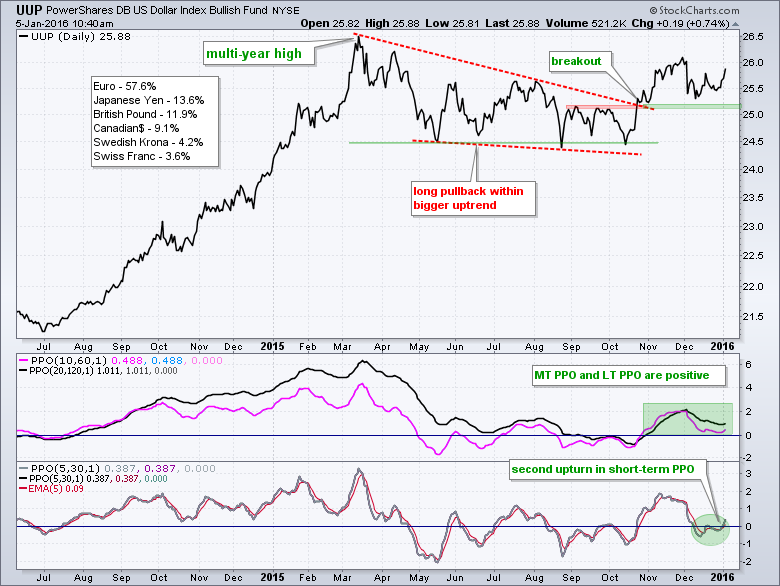
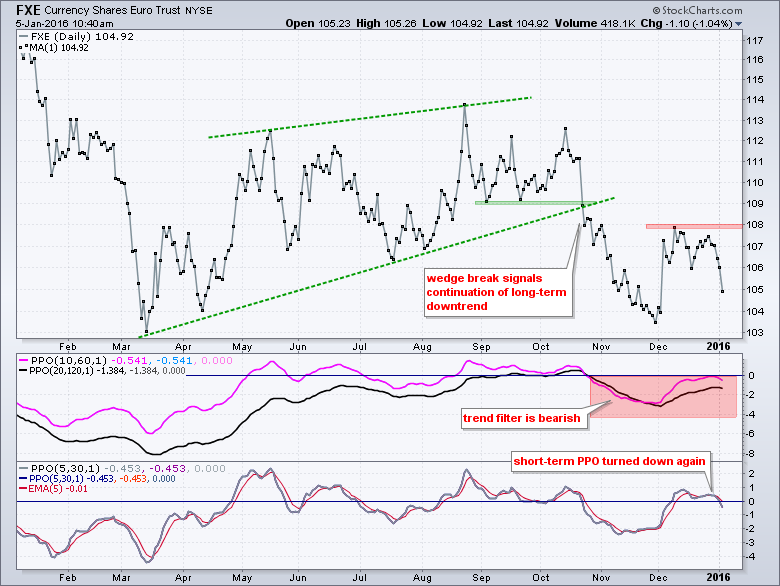
The US Dollar ETF (UUP) triggered a short-term bullish signal using the Percentage Price Oscillator (PPO) trading strategy. There is a link to this strategy at the end of this commentary. There are three parts to a bullish signal using this strategy. First, the trend filter is bullish when the medium-term PPO (10,60,1) and long-term PPO (20,120,1) are positive. This indicates that the bigger trend is up. Second, the short-term PPO (5,30,1) moves to the zero line or below the zero line. This signals a pullback within the bigger uptrend and creates the bullish setup. Third, the PPO (5,30,1) moves above zero or above its 5-day EMA (the signal line). This signals a short-term upturn in prices and suggests that the bigger uptrend is resuming. Chartists can use the December closing low to mark support for UUP. The second chart shows the Euro ETF (FXE) with a bearish signal using the same indicators.
Treasury Trading Turns Dull
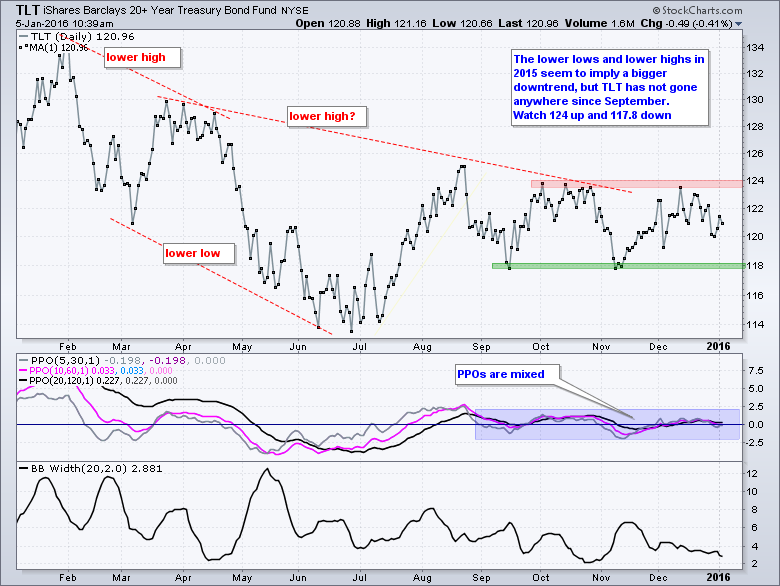
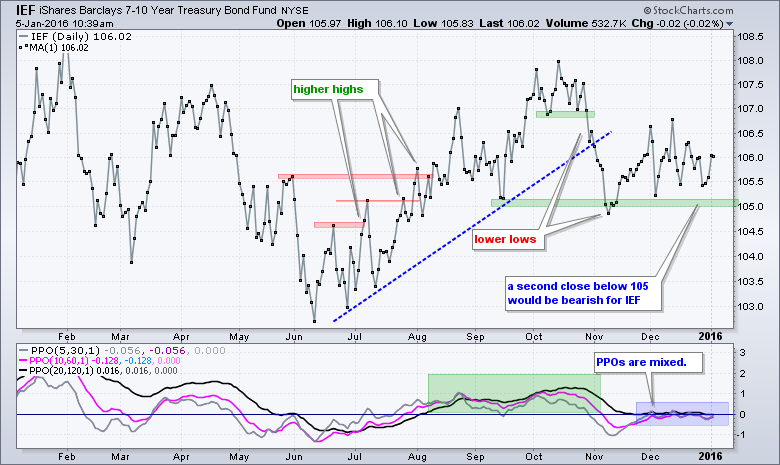
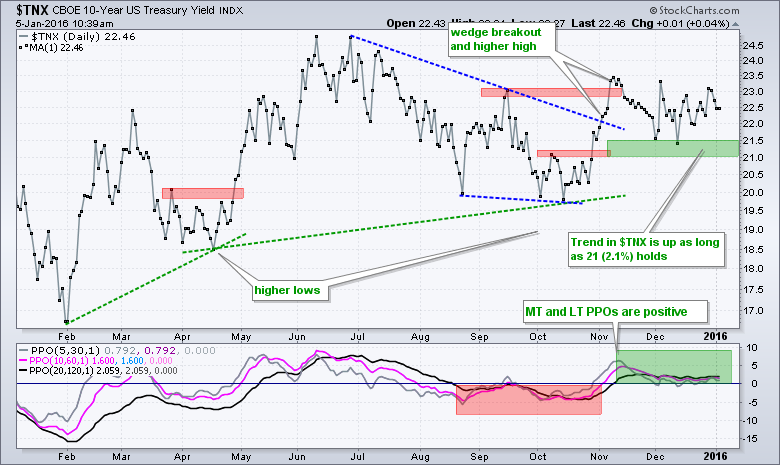
Bonds are a bit mixed up right now, but I still think the 20+ YR T-Bond ETF (TLT) is trending down and the 10-YR Treasury Yield ($TNX) is trending up. TLT forged lower lows and lower highs throughout 2015 and this suggest a long-term downtrend at work. The ETF has been flat since September with a rather narrow trading range. I am watching 124 for a bullish breakout and 117.8 for a bearish breakdown.
Other Links
PPO Trading Strategy - How to use 3 PPOs to develop a trend-reversion trading strategy.
Long-term Trend Indicators - Using the PPO, EMA Slope and CCI to determine the trend.
ETF Master ChartPack - 300+ ETFs organized in a Master ChartList and in individual groups.
Follow me on Twitter @arthurhill - Keep up with my 140 character commentaries.
****************************************
Thanks for tuning in and have a good day!
--Arthur Hill CMT
Plan your Trade and Trade your Plan
*****************************************