Don't Blame China for December // Sector Shift Defines Large-cap Breakdown // Industrials and Finance Leading Lower // XRT and ITB Break Down Further // Gold Miners ETF Bounces off Support // Treasuries Surge and Outperform ////
Don't Blame China for December
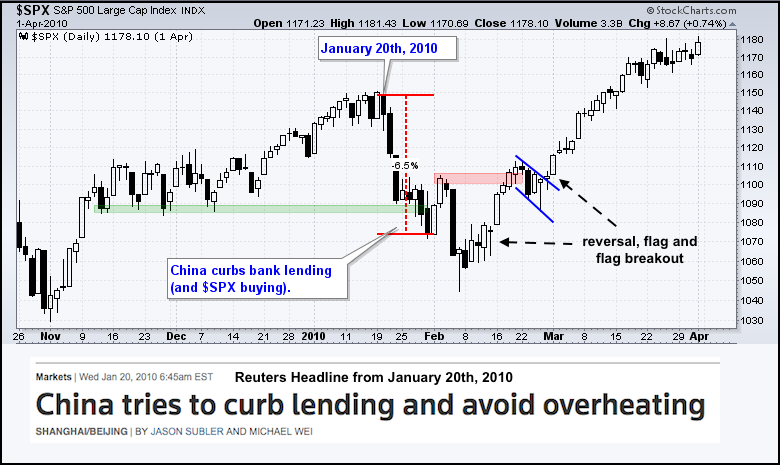
Stocks extended their 2016 plunge with further losses early Thursday. As with January 2010, China is getting most of the blame. Note that China tried to curb bank lending in January 2010 and the S&P 500 fell around 6.5% in eight sessions. The index then got a small bounce, but fell sharply again in early February 2010. The index then reversed and moved to new highs a few months later. While China might get the headlines and their markets are certainly exasperating the selling pressure, note that US small-caps and mid-caps were already in long-term downtrends before this started. We also saw some key breakdowns in mid December (XLF, XLI, KRE and ITB to name a few). This week's selling pressure finally extended to large-caps and the other holdouts (XLK, XLY). There is an old adage that stocks take the stairs up and the elevator down. We saw it in August and we are seeing it now. Nobody knows how long this downtrend will last or how far it will extend. We just need to watch the charts and wait for some sort of reversal and bullish setup before wading in on the long side again.
SPY and QQQ Break Support
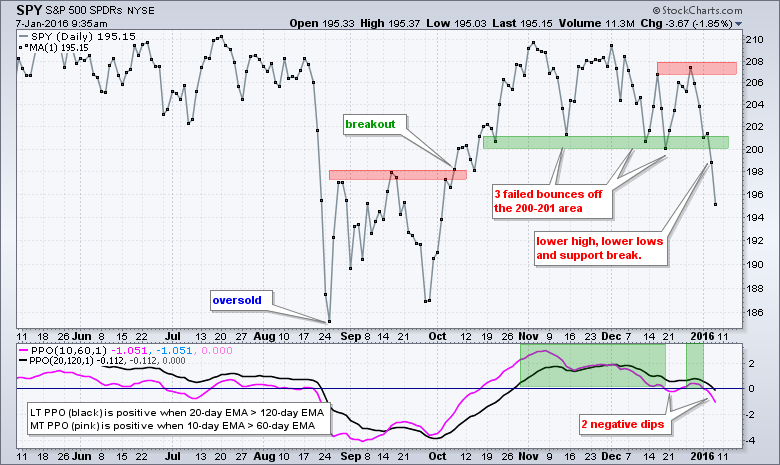
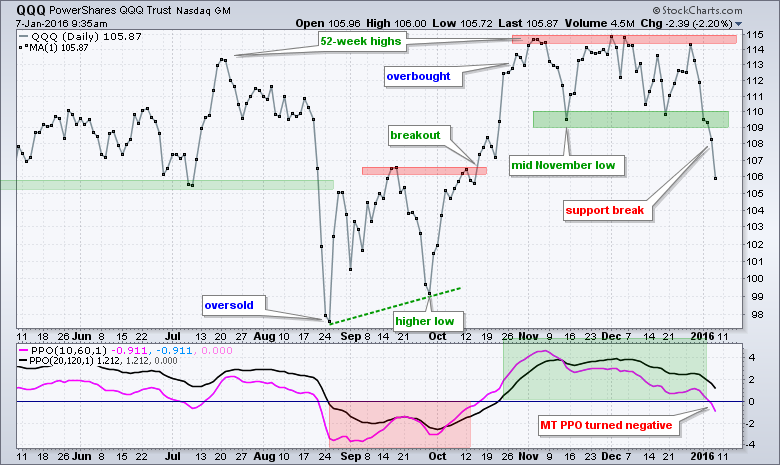
The S&P 500 SPDR (SPY) broke support at 200 with a 1.26% decline on Wednesday. With this decline, the medium-term PPO (10,60,1) turned negative for the second time in three weeks. The long-term PPO (20,120,1) is near the zero line and it would not take much to push this indicator into negative territory. I will not entertain the idea of a falling wedge anymore and I view this support break as medium to long term bearish. I am not going to mark support in the 186-188 area because the trend is down and support levels are not important in downtrends. Why? Because lower lows are expected in a downtrend and support levels are not expected to hold. A support break just signals a continuation of the existing downtrend, which was already in place. Resistance levels, on the other hand, are important in a downtrend and expected to hold. A break above a resistance zone tells us that supply-demand dynamic has shifted and the downtrend is reversing. The second chart shows QQQ breaking support and the medium-term PPO (10,60,1) turning negative for the first time since mid October. These two were the last major index ETFs standing and they have now joined MDY, IWM, IJR and RSP with breakdowns. Note that I will update the weekly charts tomorrow for the major stock indices, bonds, gold and others.
The breakdown in large-caps tells us that selling pressure from BIG money is intensifying. Using the S&P 1500 as an example, the S&P MidCap 400 and S&P Small-Cap 600 account for 1000 stocks or 2/3 of this broad market index. There are also a couple hundred small and mid-caps in the S&P 500 so the number is actually greater. Even though small-caps and mid-caps outnumber large-caps by a wide margin, minority large-caps dominate the S&P 500 and Nasdaq 100 because these indices are weighted by market cap. The total market cap of the S&P LargeCap 100, for example, is at least 8 times more than the total market cap of the Russell 2000. Thus, the Dollar amount of selling pressure is intensifying when these large-caps indices break down.
Sector Shift Defines Large-cap Breakdown
The breakdown in SPY can be attributed to the four offensive sectors: consumer discretionary, finance, technology and industrials. These four sectors account for around 60% of SPY and there was a clear sector shift over the last five weeks. The first PerfChart shows performance for the nine sector SPDRs and SPY from 23-Oct to 30-Nov. Notice that the Consumer Discretionary SPDR (XLY) and Technology SPDR (XLK) were leading and keeping SPY afloat. The Materials SPDR (XLB) and the HealthCare SPDR (XLV) were also contributing to SPY strength. The Consumer Staples SPDR (XLP) and Utilities SPDR (XLU), which are defensive sectors, were lagging and down sharply.
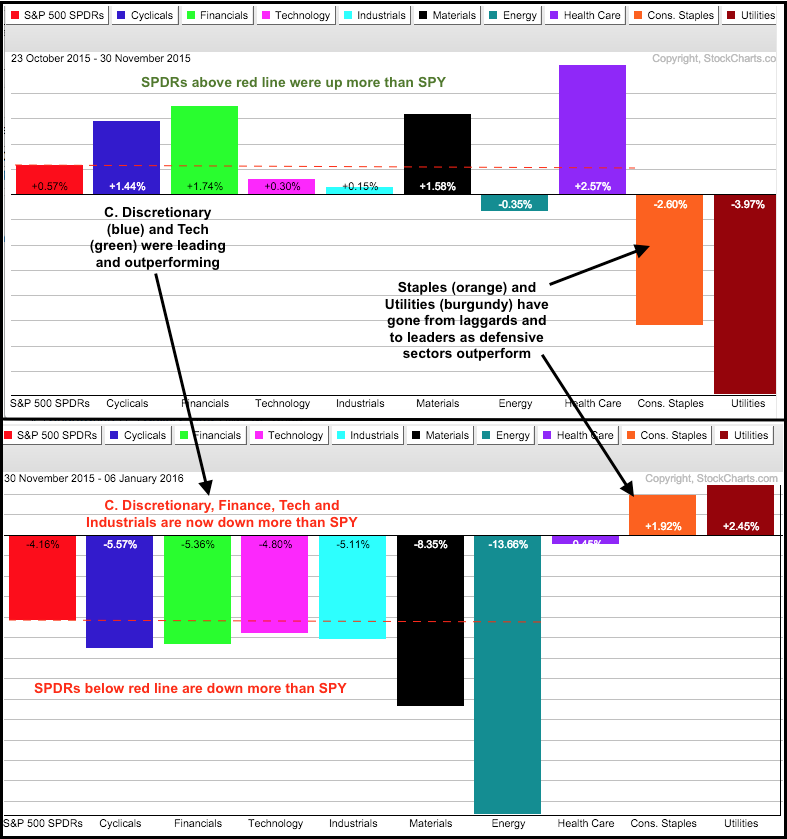
The second PerfChart shows performance from 30-Nov to 6-Jan, and there has been a clear shift. XLY and the Finance SPDR (XLF) are down more than SPY and leading the way lower. Notice how XLY and XLF flipped from showing modest gains to sizable losses. Also notice that XLK and the Industrials SPDR (XLI) are down more than SPY. Thus, the four offensive sectors are leading this decline and this is negative for the broader market. On the other side, XLP and XLU flipped from showing losses in the first PerfChart to gains in the second. Throw in healthcare and the defensive sectors are holding up much better.
Industrials and Finance Leading Lower
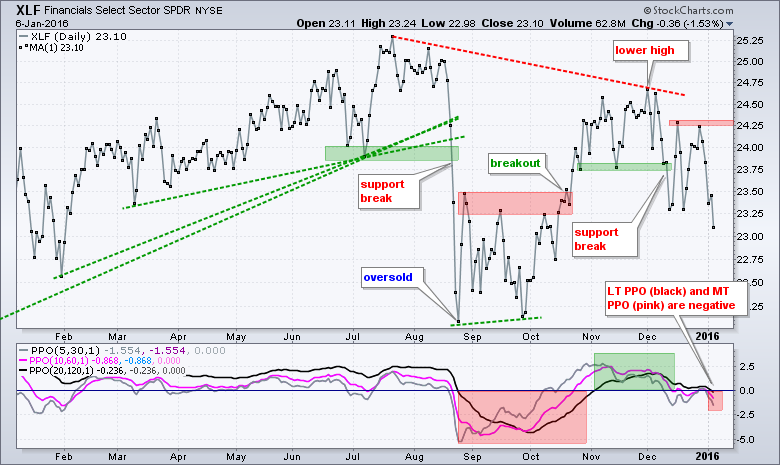
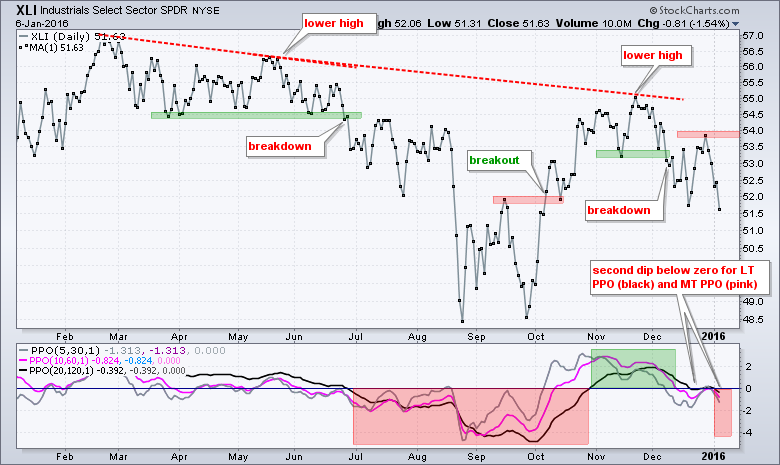
The S&P 500 was hanging tough in November, but the cracks started to appear in the Industrials SPDR (XLI) and Finance SPDR (XLF) in December. The charts below show these two surging in October, holding up in November and then breaking down in mid December. XLI broke its mid November low on December 8th and XLF broke support on December 11th. Both got bounces back above broken support, but are now back below their mid November lows and weighing heavily on the S&P 500. Also notice that the medium-term PPO (10,60,1) and long-term PPO (20,120,1) are in negative territory. With both forming lower highs from July to November, this breakdown signals a continuation of the August plunge and targets a move below the August-September lows. By the way, notice the color-coding on the annotations. Red is bearish and green is bullish. The annotations on the right side (last two months) are all red and this is bearish.
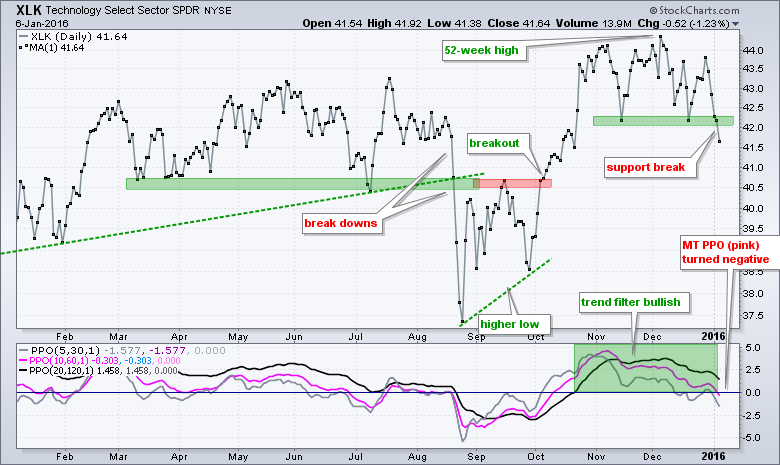
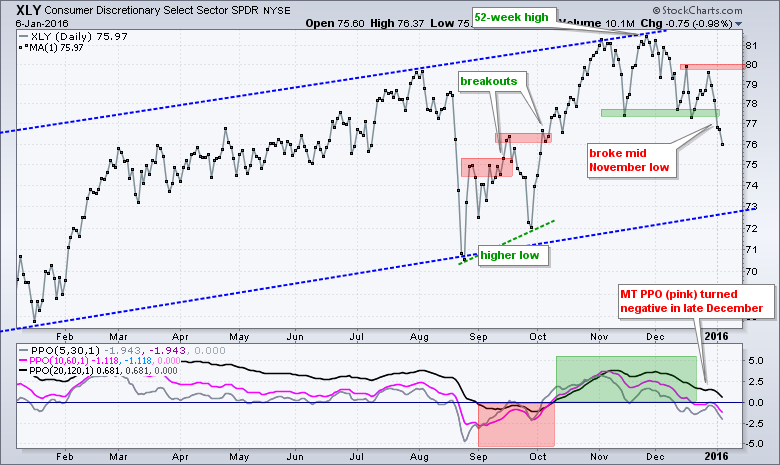
In contrast to the charts above, the Consumer Discretionary SPDR (XLY) and Technology SPDR (XLK) hit new highs in December, and then broke support. On a relative basis, they are holding up better than XLI and XLF because they are closer to their 52-week highs and further from their August lows. This, however, does not detract from the support breaks because these two sectors WERE the leaders on the upside and they are suddenly the leaders on the downside. Thus, the two pillars of the stock market have joined the selling pressure parade and this is bearish overall.
XRT and ITB Breaking Down Further
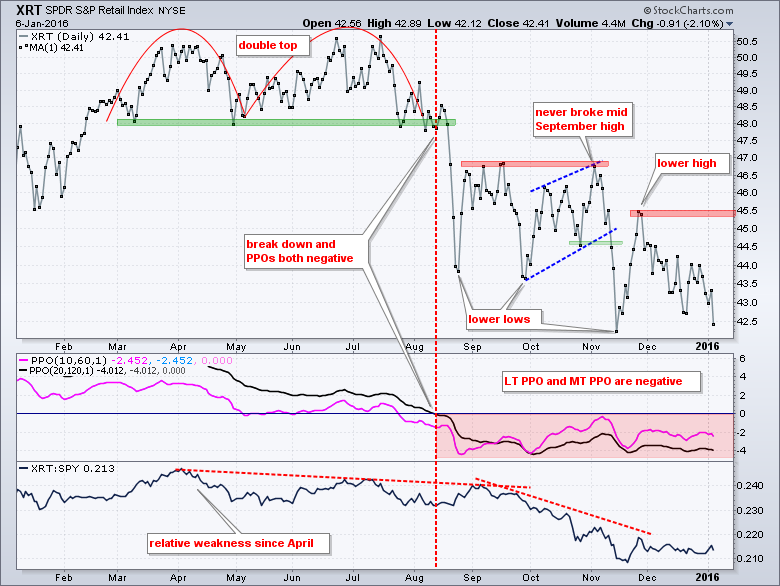
Retail and housing are domestic industries that should not be too affected by outside events. In other words, retail and housing provide a litmus test for the US domestic economy. We do not export houses, appliances, clothing and gadgets. As a rule of thumb, the long-term trend is clearly up when there is a 52-week high within sight and down when there is a 52-week low within sight. The Retail SPDR (XRT) has been one of the weakest industry group ETFs for some time and this retail is a key group in the consumer discretionary sector. Retail spending is also a key driver of GDP. XRT broke down in July and went on to new lows in August, September and November. The ETF got a big bounce in late November, but that quickly faded and the ETF will likely hit another new low today. The medium-term and long-term PPOs have been negative since August 13th.
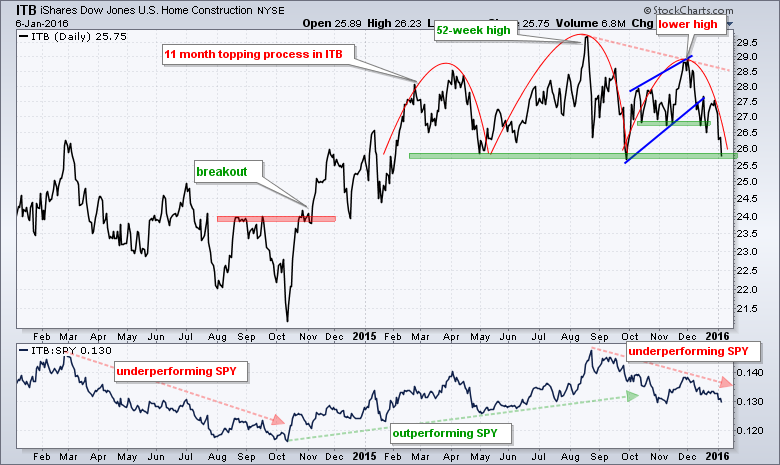
The next chart shows the Home Construction iShares (ITB) with a big head-and-shoulders pattern forming over the last 11 months. The head-and-shoulders is really not the important pattern on this chart because the breakdown already occurred. Notice the lower high in November as a rising wedge took shape. ITB then broke the lower trend line and mid November low in December. This breakdown signals a continuation of the August-September decline and targets a move to the 24-24.5 area.
Gold Miners ETF Bounces off Support
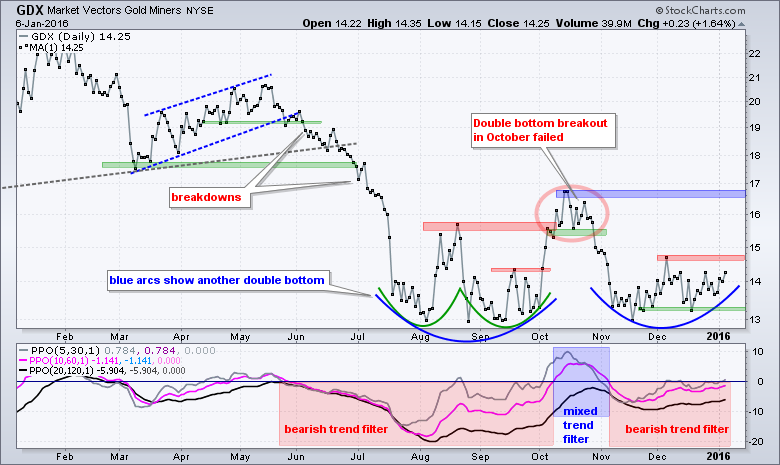
I am not bullish on gold or gold stocks, but these two may benefit from a flight to safety. Traders need to be careful because panic selling, like that seen in August, can give way to sharp rips higher. In other words, gold could move higher if stocks move sharply lower, and then lower on any rebound in stocks. The first chart shows the Gold Miners ETF (GDX) with another double bottom taking shape. The first was in August-September and the breakout failed to hold. The second one extends from August to December with the October high marking resistance. As far as trading, I prefer to nibble with the second bounce off the support zone, which is happening now. This is bottom picking and such trades carry above average risk. Notice that the trend filter is still bearish, but the short-term PPO (5,30,1) is poking into positive territory (gray line). This means the 5-day EMA moved above the 30-day EMA.
Treasuries Surge and Outperform
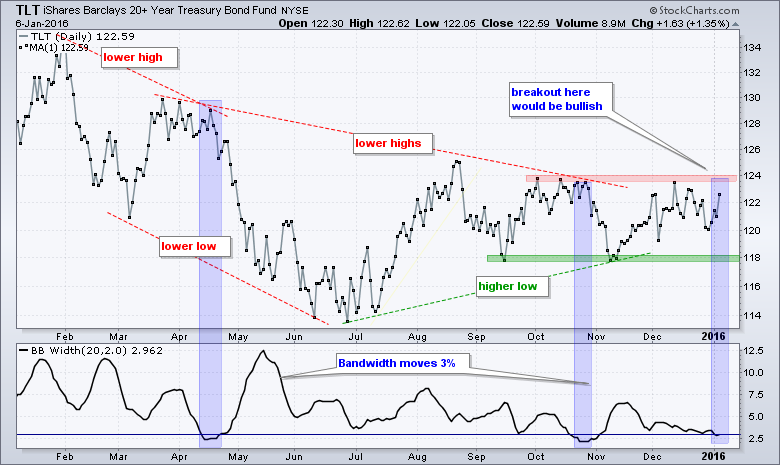
Money moving out of stocks and commodities has to go somewhere and those somewheres are the relative safe havens. Within the stock market, we are seeing relative strength in consumer staples, utilities, healthcare and REITs. Outside of stocks, we could see money moving into gold or simply staying in cash. Treasury bonds are the ultimate safe haven because they are backed by the last man standing (the G-Man). The picture for the 7-10 YR T-Bond ETF (IEF) and 20+ YR T-Bond ETF (TLT) is mixed, but both got big moves off support and could benefit from weakness in stocks. TLT has been range bound since September and BandWidth dipped below 3% for the third time since April (blue shading). This tells us that the Bollinger Bands narrowed, volatility contracted and we should prepare for a volatility expansion. An upside breakout at 124 would be bullish for TLT.
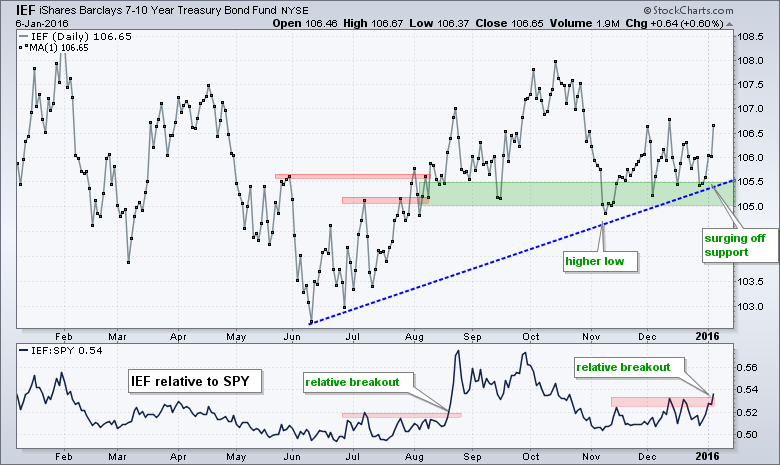
The second chart shows IEF holding support in the 105-105.5 area with a surge the last five days. The indicator window shows the price relative (IEF:SPY ratio) breaking above its December highs as IEF outperforms SPY. Notice that there was also a relative breakout in August.
Links
PPO Trading Strategy - How to use 3 PPOs to develop a trend-reversion trading strategy.
Long-term Trend Indicators - Using the PPO, EMA Slope and CCI to determine the trend.
ETF Master ChartPack - 300+ ETFs organized in a Master ChartList and in individual groups.
Follow me on Twitter @arthurhill - Keep up with my 140 character commentaries.
****************************************
Thanks for tuning in and have a good day!
--Arthur Hill CMT
Plan your Trade and Trade your Plan
*****************************************


