Large-caps Crack // S&P 500 Breaks 2K with Ease // IWM Hits 52-week Low // Using the Stochastic Oscillator to Gauge Price Levels // Small-caps and Mid-caps Lead New Low List // High-Low Percent Triggers for S&P 500 // IEF Holds Breakout as TLT Struggles // A Wild Ride for the Greenback // Watch the Yen for a Counter Move // Friday Food for Thought ////
Large-caps Crack
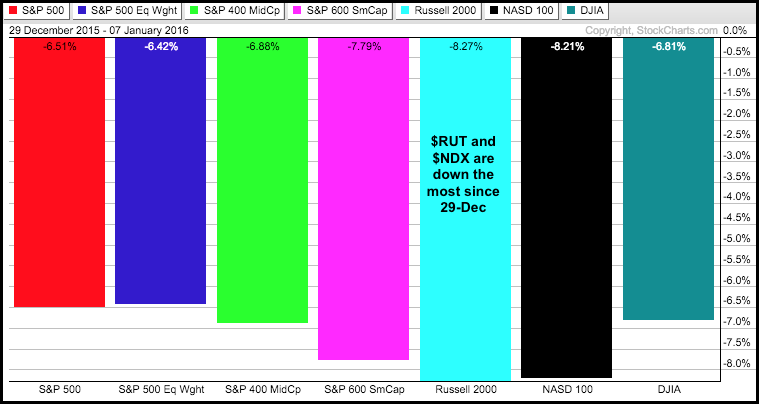
This was the week that broke the bull's back for large-caps. Small-caps and mid-caps were already in long-term downtrends and large-caps were the last holdouts. Selling pressure in the stock market was quite broad with virtually all 105 Dow Jones Industry groups losing ground. The DJ Gold Mining Index ($DJUSPM) and DJ Distillers & Vintners Index ($DJUSVN) managed gains this week. Utilities, telecom and REITs held up the best with the smallest losses. Elsewhere, Treasury Bonds, gold and the Yen attracted some buying interest. As of Thursday's close, the S&P 500 was down around 6.5% in seven sessions and down around 8.2% from its early November high. The Russell 2000 was down around 8.3% in eight sessions and down around 12% from its early December high. Small-caps were showing relative weakness and continued to show relative weakness even as selling pressure expanding to large-caps. Small-caps and mid-caps have been net bearish since August 21st and these represent the majority of stocks in the stock market. Large-caps started breaking down in the second half of December and the S&P 500 broke support with a sharp decline this week. I do not know how long this bear cycle will last or how far it will extend. We must simply trade or invest according until indications suggest otherwise. This means that most stock-related ETFs and most stocks are vulnerable. Some stocks and ETFs may hold up better, but the broad market trend is the single more important factor for a stock or ETFs.
S&P 500 Breaks 2K with Ease
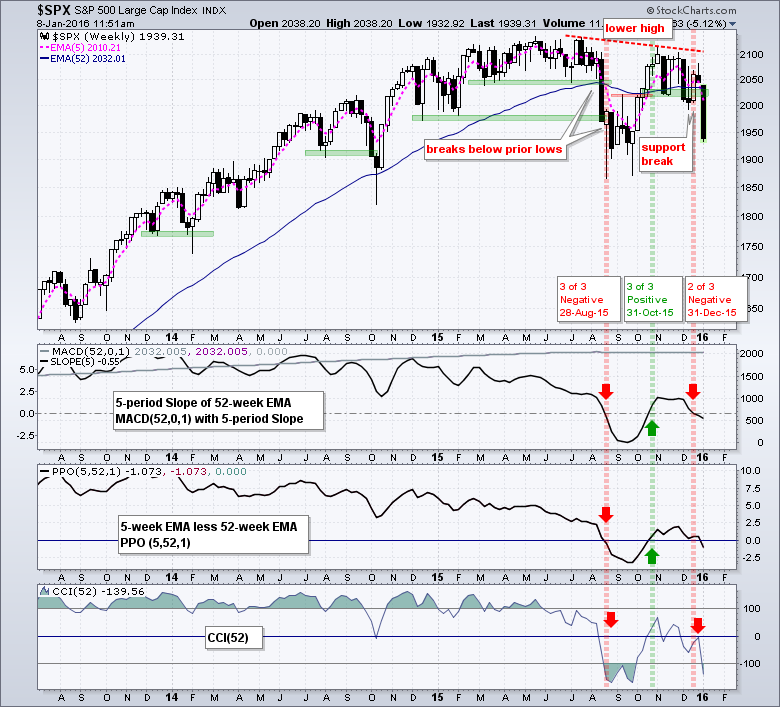
The S&P 500 is in a long-term downtrend on the price chart. First, the index broke below support and forged a lower low in August. Second, the index peaked below the July high and formed a lower high in October. The index then broke below the mid November low in mid December and plunged below 2000 this week. A lower low and a lower high make for a downtrend. This is as simple as a downtrend definition gets. The trend indicators turned bearish before the breakdown as two of the three turned negative on December 31st. While it is interesting to guesstimate support levels and downside targets, the trend is what really counts here and it is down. There are no more key levels on the downside.
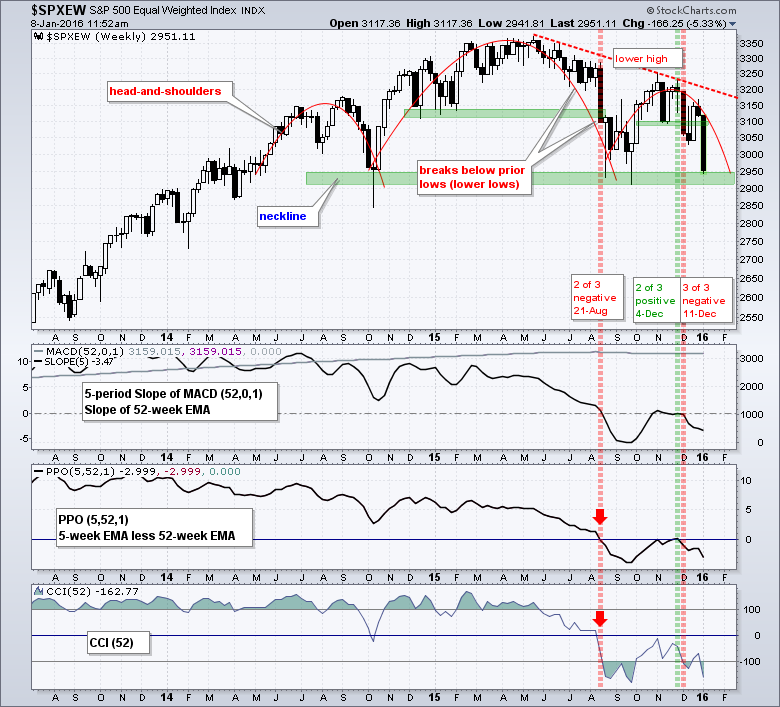
The S&P 500 Equal-Weight Index ($SPXEW) led the way with a trend reversal in mid December. We have known about relative weakness in small-caps and mid-caps for some time and this weakness was apparent in the S&P 500 EW Index. First, the index broke support with a sharp decline in August. Second, the index did not come close to its May high and formed a lower high in early November. Third, the index broke down in mid December with a close below the mid November low. The trend indicator whipsawed as two turned positive in early December and then all three turned negative for the week ending December 11th. I pointed out the big head-and-shoulders before, but this is really a moot point because the trend is already down. Lower lows are expected in downtrends and support levels are not expected to hold.
IWM Hits 52-week Low
The Russell 2000 iShares (IWM) is leading the way lower because it already hit a 52-week low. The chart below shows the ETF breaking support in August, rebounding with a rising wedge into November and breaking wedge support in early December. With this week's plunge, the ETF broke the August-September lows and hit a 52-week low. Note that the trend indicators turned net negative on August 21st and remained net negative throughout the October-November bounce, which was a counter-trend rally.
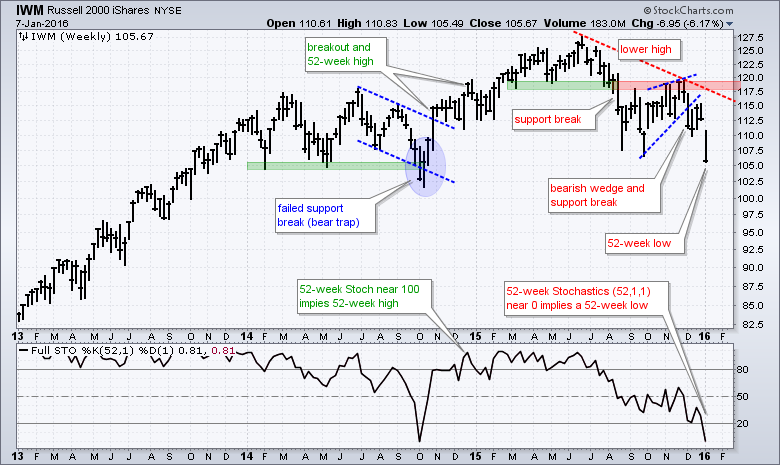
The indicator window shows the Stochastic Oscillator (52,1,1). This shows us where the current price is in relation to its high-low range over the last 52 weeks. A Stochastic value near 50 tells us that price is in the middle of its 52-week range (as it was in early September). A Stochastic value near 100 tells us that price is near a 52-week high (as it was in late December 2014). A Stochastic value near 0 tells us that price is near a 52-week low (as it is right now).
Using the Stochastic Oscillator for Gauge Price Levels
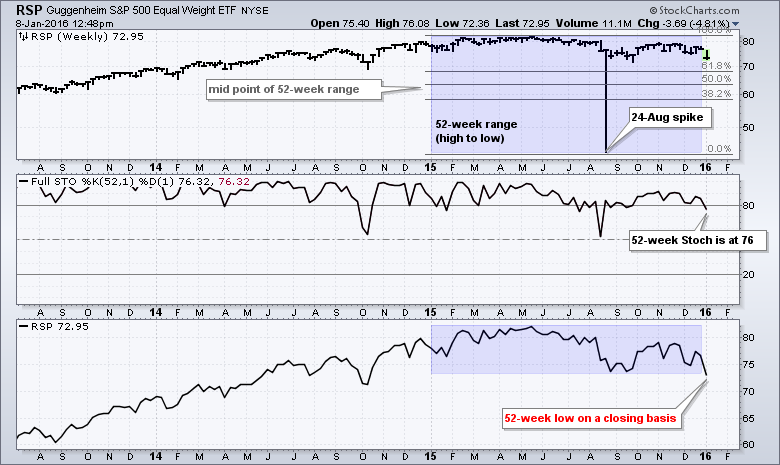
Note that the Stochastic Oscillator uses the high and low in its calculation, which means spike lows can distort the index. For example, the chart below shows the EW S&P 500 ETF (RSP) with a spike low well below 50 in August and the Stochastic Oscillator uses this low in its calculation. Thus, the 52-week Stochastic Oscillator is at 76 because RSP is in the top half of its 52-week high-low range. The gray lines are from the Fibonacci Retracements Tool and you can see that the current price is above the 61.8% retracement. Things, however, are quite different when we look at a close-only chart because RSP closed below its August-September closing lows on Thursday.
Small-caps and Mid-caps Lead New Low List
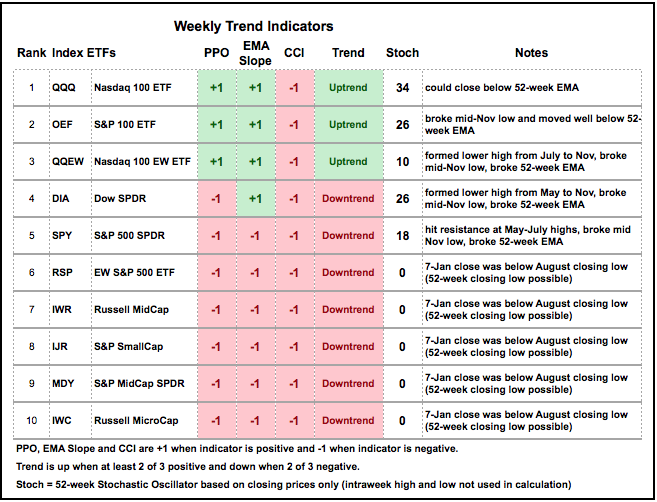
The discussion of the Stochastic Oscillator is leading to the table below with the ten major index ETFs and the weekly trend indicators, which include the PPO(5,52,1), the 5-period Slope of the 52-week EMA and CCI(52). The box is +1 and green when the indicator is positive (bullish) or -1 and red when negative (bearish). A downtrend is present when at least 2 of the 3 are negative (and vice versa). The value of the 52-week Stochastic Oscillator is also shown, but note that this version is based on closing prices, not highs and lows. In other words, the 52-week range is based on the weekly closing high and weekly closing low to eliminate the spike low on August 24th. As of Thursday's close, all three trend indicators were negative for six of the ten ETFs and two of three indicators were negative for the Dow Diamonds (DIA). This means seven of the ten ETFs are in long-term downtrends. Based on Thursday's close, the 52-week Stochastic Oscillator was at zero for five, which means these five hit 52-week closing lows on Thursday. Again, this is based on weekly data and Friday's data is not included. The Stochastic Oscillator equals: ((Close - Low)/(High - Low))*100. Note: I will add IWM next time.
High-Low Percent Triggers for S&P 500
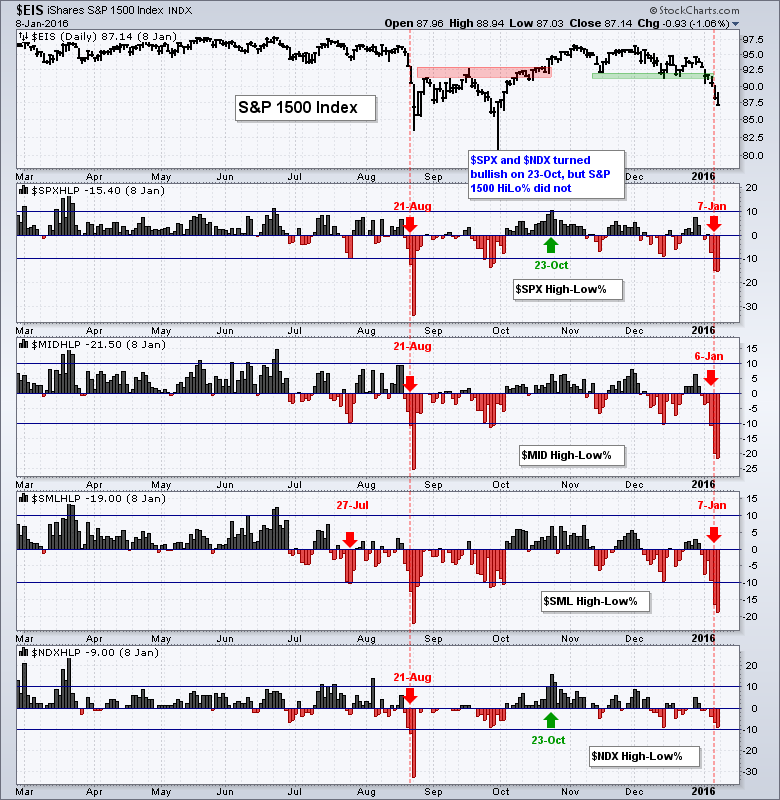
I featured the High-Low Percent indicators for the S&P 500, S&P MidCap 400, S&P Small-Cap 600 and Nasdaq 100 on Tuesday. To recap: the indicator turns bullish on a move above +10% and remains so until a move below -10%, which is when it turns bearish. It is a long-term indicator. S&P 500 HiLo% ($SPXHLP) moved below -10% on Thursday and even reached -15%. For those keeping score at home, there were 77 new lows and just 2 new highs, which means Net New Highs were -75 and High-Low Percent was -15% (-75/500). This is the biggest negative number since August and it shows a significant increase in selling pressure. It also means that three of the four indicators are in bear mode. The S&P 600 HiLo% ($SMLHLP) and S&P 400 HiLo% ($MIDHLP) turned bearish this summer. Nasdaq 100 HiLo% ($NDXHLP) has yet to trigger a bearish signal.
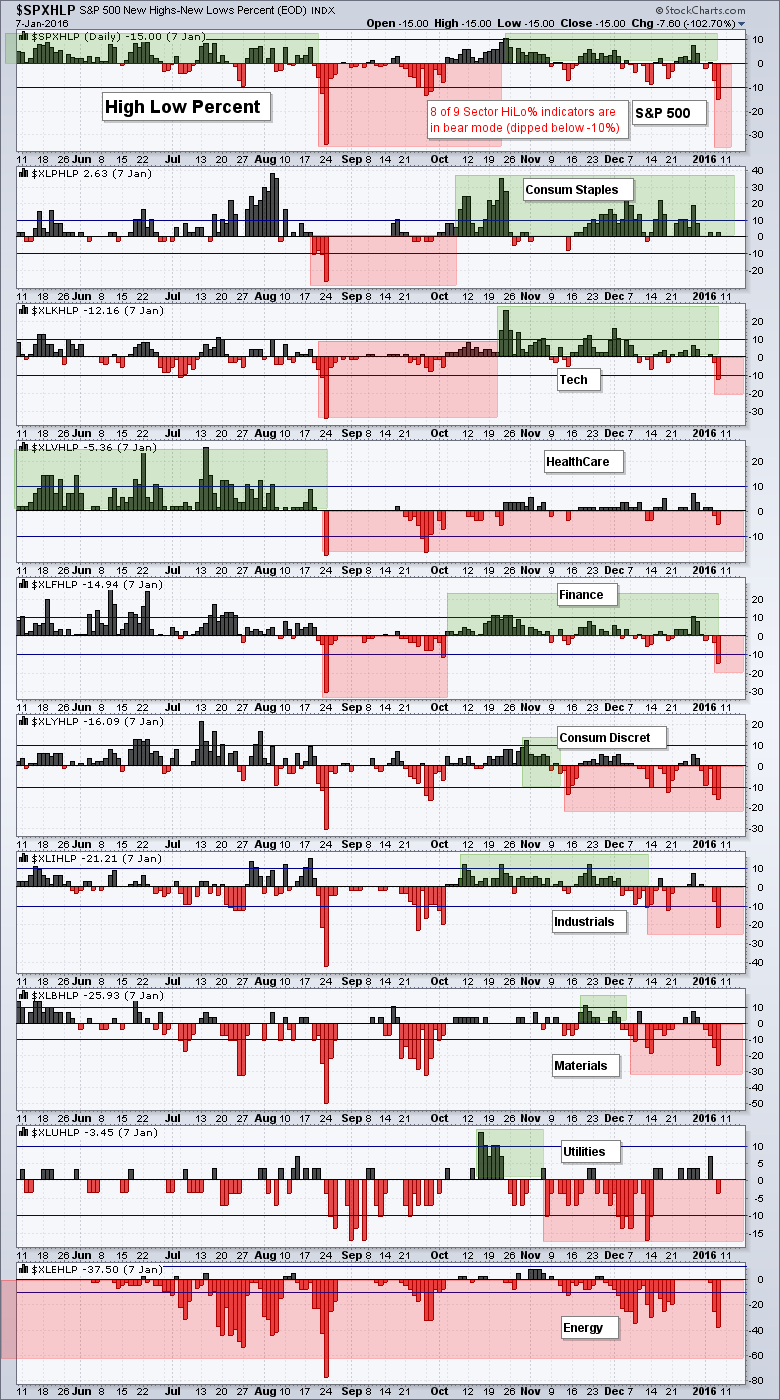
 The next chart shows that eight of the nine sector High-Low Percent indicators are in bear mode. This means the most recent signal was a move below -10% in High-Low Percent. Consumer Staples HiLo% ($XLPHLP) is the only sector still in bull mode according to this indicator. Of the eight bearish signals, Healthcare HiLo% ($XLVHLP) and Utilities HiLo% ($XLUHLP) are holding up the best at -5.36% and -3.45% respectively. The other seven sector High-Low Percent readings were below -10%. This shows broad selling within most sectors and this is net bearish for the S&P 500.
IEF Holds Breakout as TLT Struggles
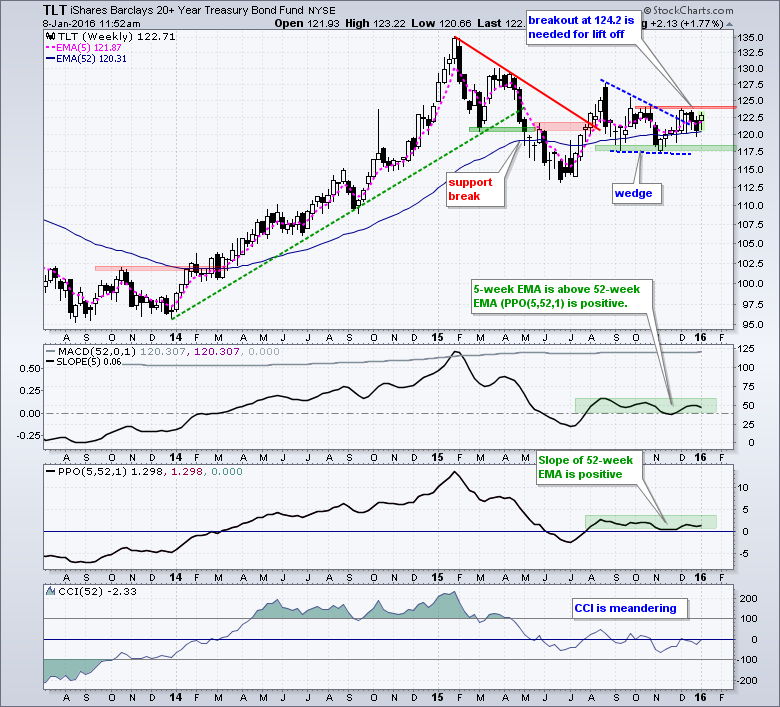
The 20+ YR T-Bond ETF (TLT) and 7-10 YR T-Bond ETF (IEF) have not moved much since August, but neither have they broken down and the recent turmoil in the equity markets is positive for Treasury bonds. First, note that the weekly trend indicators are net positive for TLT and IEF. Only CCI(52) is negative for TLT. On the price charts, TLT is trying to hold a wedge breakout and the 5-week EMA is above the 52-week EMA. A break above the October-December highs would complete the wedge breakout and argue for a move to new highs. A close below 117.5 would argue for a reassessment.
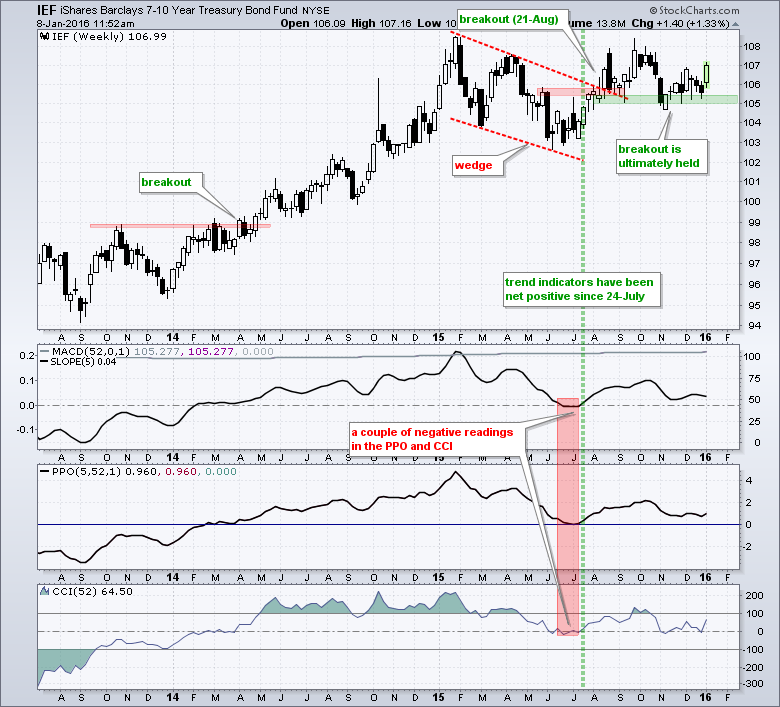
IEF is stronger than TLT right now. Notice that IEF broke out on August 21st, which is when stocks plunged and broke down. There was a sharp decline in October, but the breakout zone ultimately held and IEF is getting a bounce off this support zone now. All three trend indicators are currently positive. A close below 105 would warrant a reassessment.
A Wild Ride for the Greenback
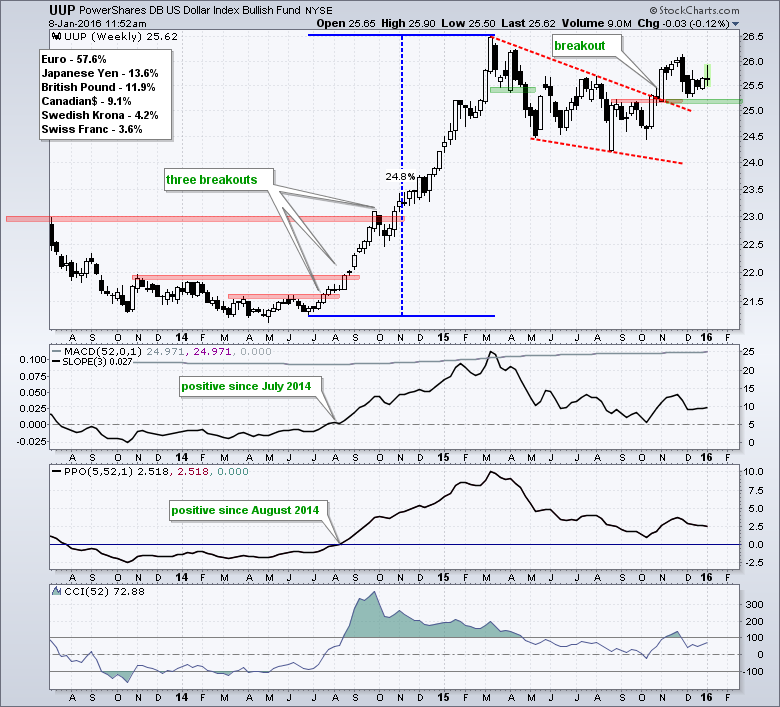
The US Dollar ETF (UUP) has been all over the place this week with a surge at the beginning and plunge at the end. This does not change the outlook on the week chart, which is still bullish. UUP broke wedge resistance with a big move in October and this breakout is holding. Also note that all three trend indicators are still positive. A close below 25.1 would argue for a reassessment.
Watch the Yen for a Counter Move
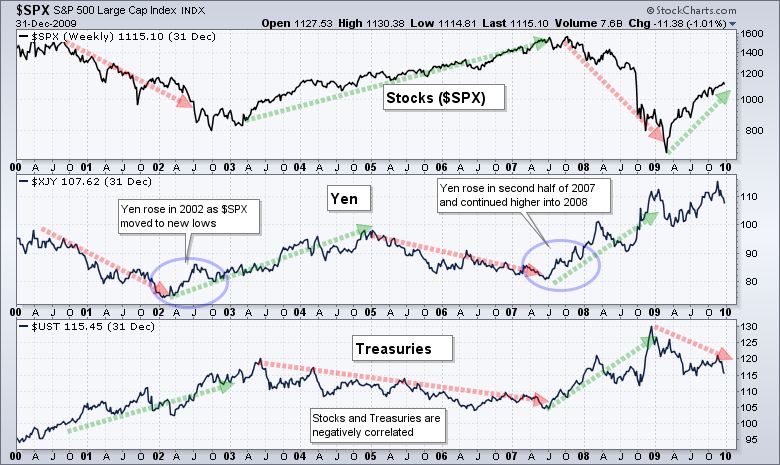
Most assets were down this week and there were few places to hide. Outside of the bond market, we saw strength in gold and the Yen ETF (FXY). Note that the Yen moved higher during the financial crisis in 2007 and 2008. The chart below shows the S&P 500, the Yen Index ($XJY) and the US Treasury Bond ($UST). The negative correlation between stocks and bonds is pretty clear and consistent. The relationship between the Yen and the S&P 500 is less consistent, but we can see strength in the Yen in 2002 when the S&P 500 dropped around 30% and as the 2007 breakdown occurred. Notice how the Yen bottomed in July 2007 and moved sharply higher into early March 2008.
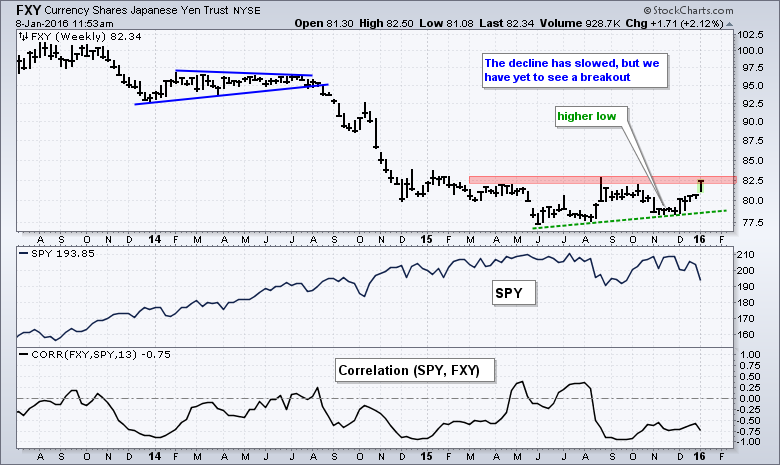
Looking at the current chart for the Yen ETF, we can see a sharp move higher this week as this currency attracted safe-haven money. The ETF remains short of a breakout, but did form a higher low over the last six months and a breakout would be bullish. Such a move would probably coincide with weakness in the S&P 500 SPDR (SPY) because these two are negatively correlated for the most part. The indicator window shows the Correlation Coefficient (SPY,FXY) spending most of the last two and a half years in negative territory.
Friday Food for Thought
Facebook backup plan would keep it running on Android: Yes, Facebook as a plan just in case Google kicks it out of the Play Store.
Trend Following In Financial Markets: A Comprehensive Backtest: This is a rather long read that delves into timing with long-term moving averages. There is plenty of backing testing and one particular asset did not do well (individual stocks). Broad market indices, sectors, industry groups, currencies and fixed income all outperformed with added timing of a moving average.
The All Weather Story: This article dives into the development of the All Weather Potfolio at Bridgewater Associates (Ray Dalio). Here's a quote from the article: Overconfidence often pushes people to tinker with things they do not deeply understand, leading them to over-complicate, over-engineer, and over-optimize. All Weather is built very intentionally to not be that way. With the All Weather approach to investing, Bridgewater instead accepts the fact that they don’t know what the future holds, and thus choose to invest in balance for the long-run
What the Spinning Dancer Illusion Reveals About Your Perceptual Bias: I found this gif and article interesting because they highlight the challenge with chart analysis. Show three people a chart and you can get five opinions. The subjectivity of chart reading pushed me to a more systematic approach that relies on quantifiable indicators. By the way, the spinning dancer appears to be spinning clockwise for me. What do you see?
Links
PPO Trading Strategy - How to use 3 PPOs to develop a trend-reversion trading strategy.
Long-term Trend Indicators - Using the PPO, EMA Slope and CCI to determine the trend.
ETF Master ChartPack - 300+ ETFs organized in a Master ChartList and in individual groups.
Follow me on Twitter @arthurhill - Keep up with my 140 character commentaries.
****************************************
Thanks for tuning in and have a good day!
--Arthur Hill CMT
Plan your Trade and Trade your Plan
*****************************************


