Finding Negative Correlations // Major Indices Remain in Bear Mode // New Lows Surge as Selling Expands // Bond ETFs Extend Support Bounce // Dollar Stalls after Breakout // Yen Traces out Rounding Bottom // Gold Forms Short-term Bull Flag // Friday Food for Thought ////
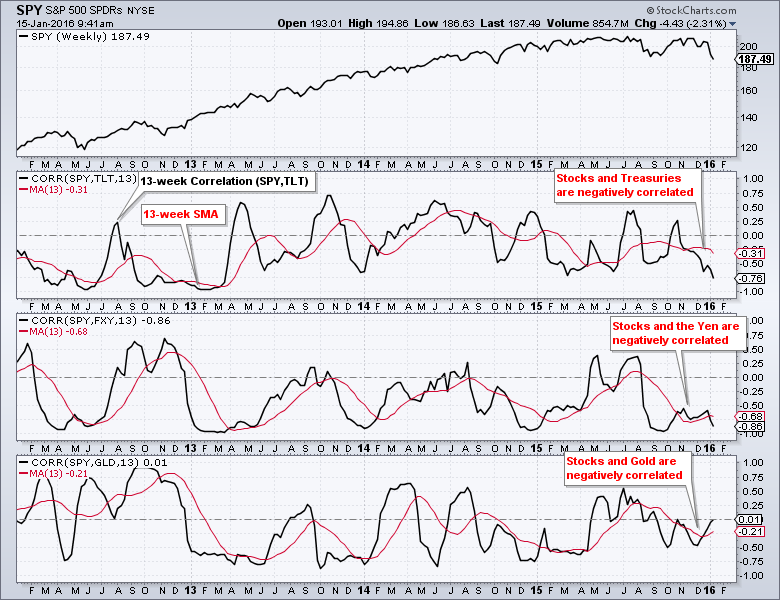
Finding Negative Correlations
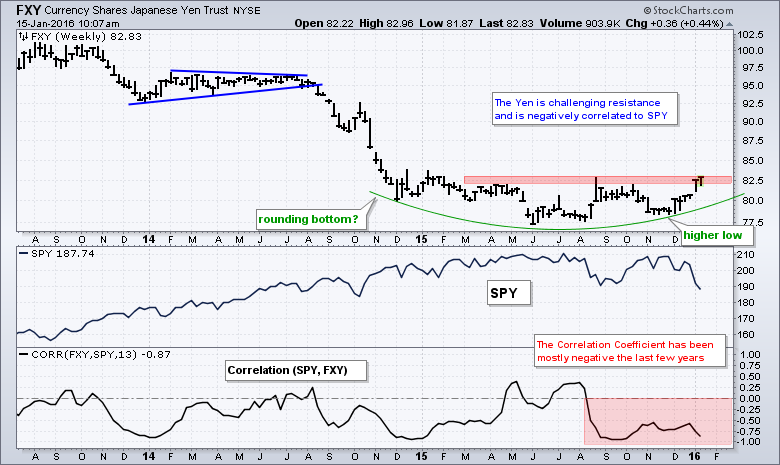
Stocks were hammered again on Friday morning as the Shanghai Composite fell over 3%. Wall Street could be a little extra nervous ahead of a three day weekend because the Chinese markets are open on Monday and we are closed. In any case, this week's trading activity is clearly not enough to reverse the bearish signals of the last few weeks. The long-term trend indicators for the S&P 500 EW Index turned bearish the first week of December and the long-term trend indicators for the S&P 500 turned net bearish on December 31st. There were over 300 new 52-week lows in the S&P 1500 this week as selling pressure expanded further. Almost all commodities are in downtrends overall with oil hitting new lows yet again. Sugar is about the only commodity showing a gain over the last six months. There are not many places to hide because correlations tend to rise when stocks move into a bear market. The chart below shows that the 20+ YR T-Bond ETF (TLT), Yen ETF (FXY) and Gold SPDR (GLD) are negatively correlated to the S&P 500 SPDR (SPY) right now. A negative correlation implies that these moves up when SPY moves down (and vice versa).
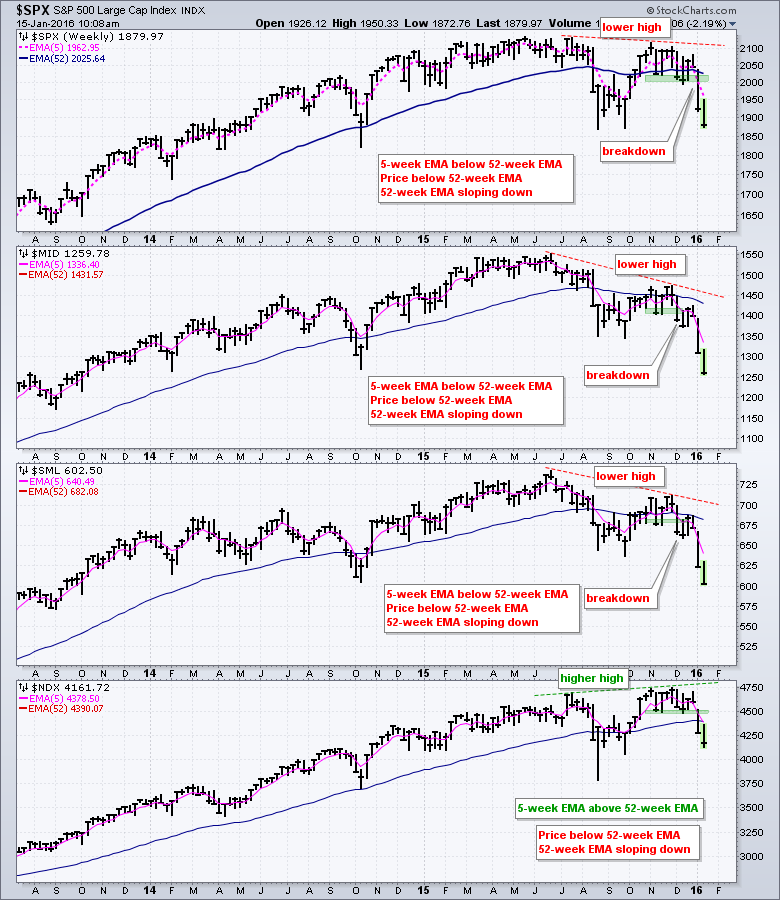
Major Indices Remain in Bear Mode
There is no real change for the major index charts. The S&P MidCap 400 and S&P Small-Cap 600 formed lower highs with shallow bounces from September to November and broke down in early December. These breakdowns signaled a continuation of the July-August decline and both hit 52-week lows this week. The S&P 500 almost reached its summer highs, but ultimately formed a lower high in November and broke down last week. A lower high and a break down spell downtrend for the S&P 500 and large-caps. We could mark support near the August-September lows, but this is really a moot point because the downtrend is the dominant force. Lower lows are expected until this downtrend reverses and this means support levels are soft (at best). The Nasdaq 100 is still the least weak of the four, but it also broke support last week and its 52-week EMA is turning down.
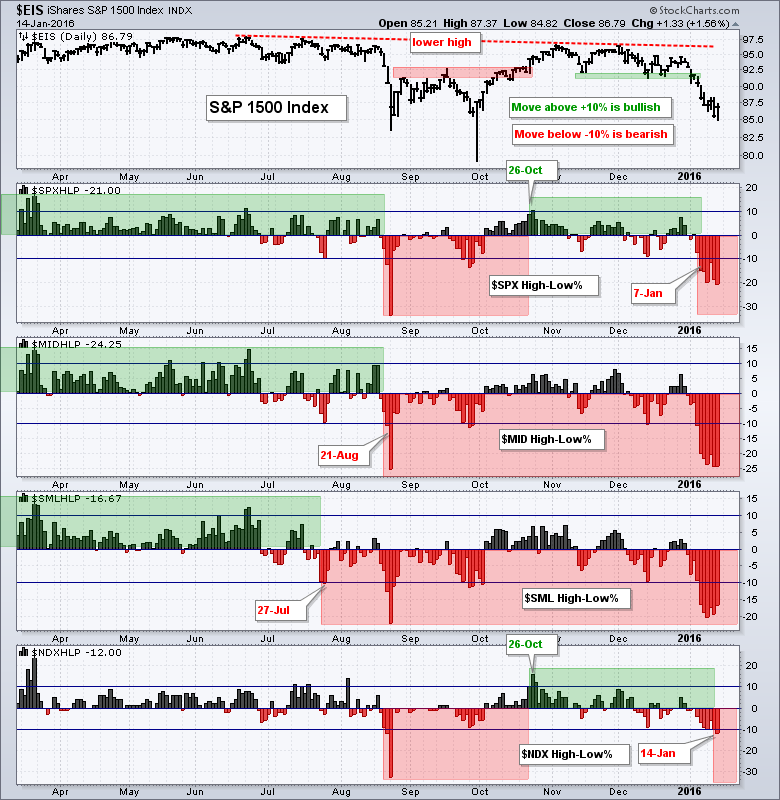
New Lows Surge as Selling Expands
The number of new lows surged significantly over the last two weeks as selling pressure intensified. Selling pressure started in small-caps, spread to mid-caps and finally hit large-caps. The places to hide shrink in bear markets as selling pressure expands. S&P 600 HiLo% ($SMLHLP) and S&P 400 HiLo% ($MIDHLP) have been in bear mode since 27-Jul and 21-Aug, respectively. S&P 500 HiLo% ($SPXHLP) joined on 7-Jan with a move below -10% and the indicator exceeded -20% twice this week already. Throw in $MID and $SML and we have over 20% of the S&P 1500 hitting new 52-week lows this week. That's more than 300 stocks. Nasdaq 100 HiLo% ($NDXHLP) was the last hold out and it finally broke below -10% on Thursday. 52-week lows occur in strong downtrends and this reinforces the bear market outlook.
Bond ETFs Extend Support Bounce
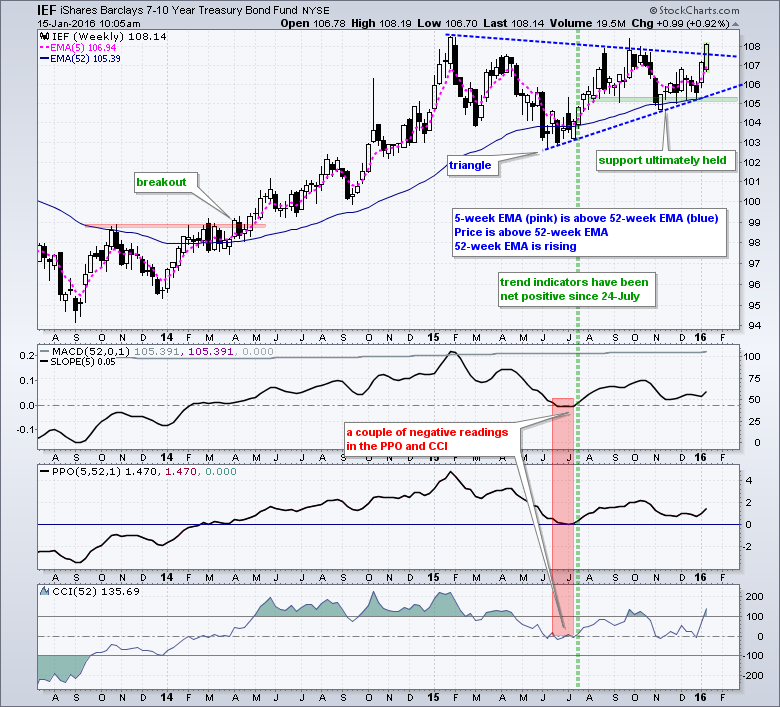
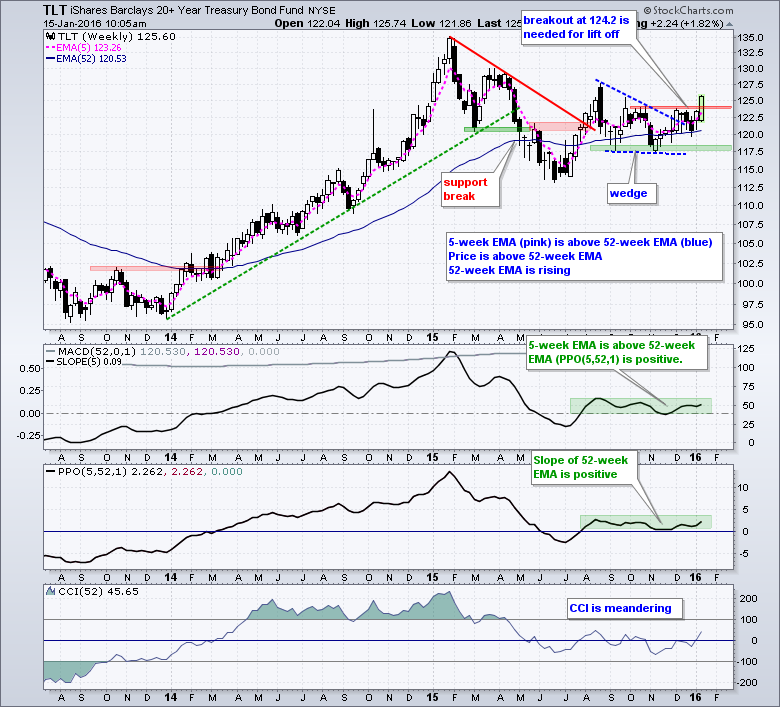
The 7-10 YR T-Bond ETF (IEF) and the 20+ YR T-Bond ETF (TLT) continue to attract money as the stock market declines. Notice that IEF and TLT surged from mid July to mid August as the stock market fell sharply. These two also moved higher the last six weeks. SPY is down over 8% since December 1st, IEF is up over 2% and TLT is up over 4%. There is clearly a negative correlation at work between stocks and bonds right now. In addition, bonds are outperforming stocks and this means we should favor safety over risk right now. On the price chart, IEF surged in 2014, hit a new high in early 2015 and then consolidated the last 12 months. It looks like a triangle after a sharp advance and this is a bullish continuation pattern. A breakout at 108 would open the door to new highs. TLT is still struggling to hold its wedge breakout from early December, but the trend evidence remains bullish. The 5-week EMA is above the 52-week EMA, price is above the 52-week EMA and the 52-week EMA is rising.
Dollar Stalls after Breakout
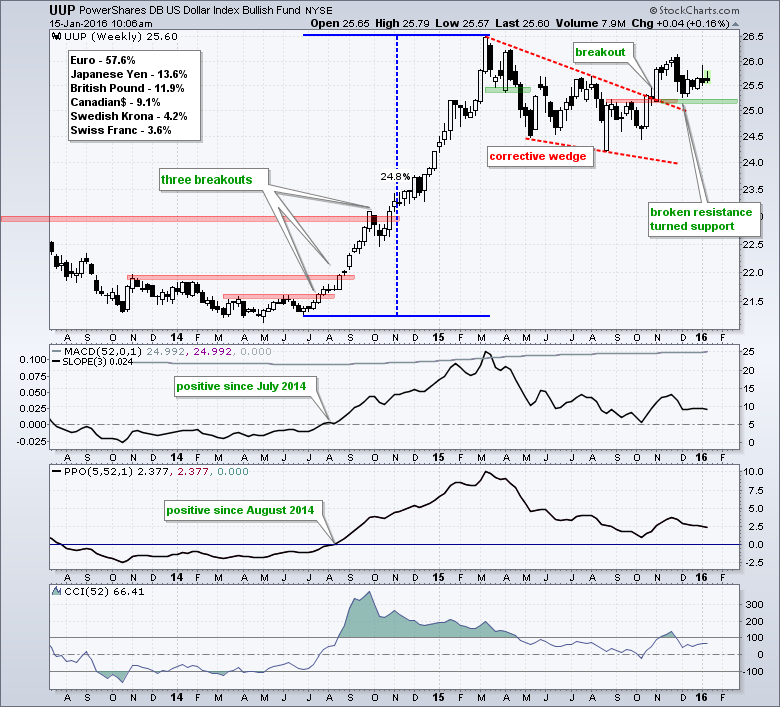
The US Dollar ETF (UUP) hasn't moved much the last few weeks, but it is holding its breakout and remains bullish overall. On the weekly chart (top), the ETF broke wedge resistance with a surge in November and this breakout held as broken resistance turned support in December. This wedge looks like a correction after a massive advance and the breakout signals a continuation of the long-term uptrend. Also note that the long-term trend indicators have been net positive since August 2014.
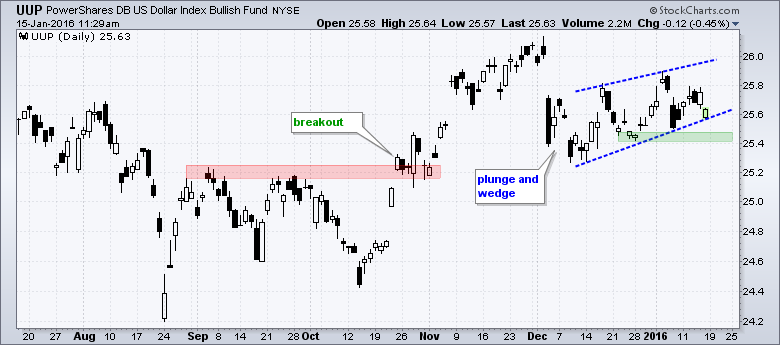
Chartists can watch the daily chart (bottom) for early signs of a breakdown. Notice that the ETF fell hard in early December and then formed a rising wedge. This may be a corrective bounce after the hard decline, but the trend is up as long as the wedge rises. A close below 25.4 would break wedge support and provide the first sign of a bearish reversal. The bulls rule the Dollar trend until such a break.
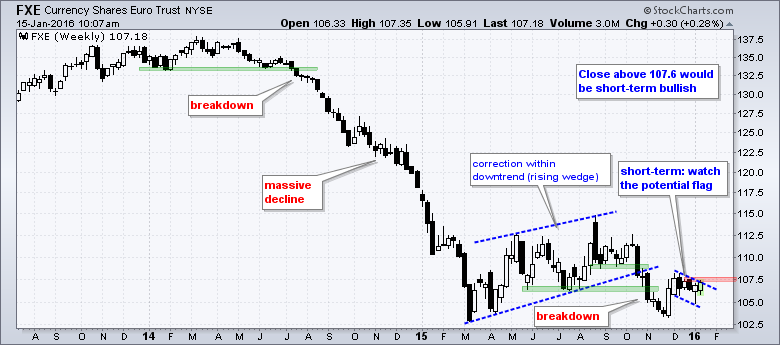
The Dollar is, of course, dependent on the Euro and the Yen for direction because currencies work in pairs. A weak Euro (Yen) is bullish for the Dollar and a strong Euro (Yen) is bearish. Note that the Euro accounts for 57.6% of UUP and the Yen weighs 13.6%. The Euro ETF (FXE) remains in a long-term downtrend after the wedge break in October. The ETF managed to hold the 2015 low with a bounce in late November and then formed a falling flag the last five weeks. This is the first pattern to watch for a breakout and reversal. A close above 107.6 would break resistance and be bullish for the Euro.
Yen Traces out Rounding Bottom
The Yen ETF (FXY) is in focus for more than just its influence on the Dollar Index. The Yen is also a safe haven currency, for some strange reason. Nevertheless, it is what it is. FXY surged as SPY fell in December-January and is on the verge of breaking resistance. Perhaps some sort of rounding bottom is forming over the last 12 months. Note that the Yen moved sharply higher from July 2007 until March 2008, and the rally continued until October 2011.
Gold Forms Short-term Bull Flag
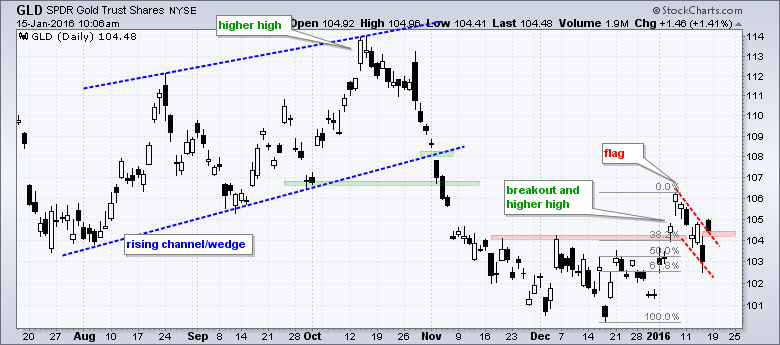
The long-term trend for the Gold SPDR (GLD) remains down, but the yellow metal could benefit if the financial markets remain chaotic. Further weakness in the stock market and an upside breakout in the Euro would be bullish for bullion. I hate to get this short-term in a Friday commentary, but that is where the action is in GLD right now. The ETF surged above resistance last week and forged a higher high. The pullback over the last five days was deep, but retraced around 62% of the prior advance. Also notice that a falling flag of sorts is taking shape. A breakout at 104.5 would provide the first short-term bullish signal for GLD. Keep in mind that this is short-term, the markets are chaotic right now and the long-term trend for gold is down.
Friday Food for Thought
The bulk of the evidence is clearly bearish for stocks and we, or at least I, do not know how long it will last and how far this decline will extend. It could last a few weeks or several months. The pickings are extremely thin during a bear market and this is a time to keep the powder dry, and prepare for the next bull. Avoiding a 20% decline is as good as participating in a 25% advance. Say what? If a portfolio declines from 100 to 80 (-20%), it takes a 25% advance to get back to 100. Also consider the mental anguish of riding a decline and then working your way back up - just to get to break even. This is why cash really is a position in a bear market. In any case, bear markets provide opportunities to sharpen the saw, which is habit number seven from Stephen Covey. Exercise your body, mind, heart and soul in preparation for the next bull cycle. In the meantime, I have some extra food for thought to keep you busy on this three-day weekend.
Measuring Stock, Economic and Credit Risk (Arthur Hill - StockCharts.com) - This article shows charts to define risk on-risk off in the financial markets. It also includes a long-term chart of the Financial Stress Index from the Fed.
Smart Volatility Management in a Risk On/Off World (Intech Janus) - This article shows how to construct a portfolio based on market volatility and not expected returns.
If you are Going to Sin, Sin Systematically (Corey Hoffstien - Newfound Research) - Diversifying across several active approaches can help smooth out short-term underperformance of a single approach.
Latest memo from Howard Marks: On the Couch (Oaktree) - Howard Marks explores psychology's role in investing and how quick the psychological pendulum swings
The Battle for the Soul of the ETF Revolution (Dave Nadig of FactSet Insight) - Six things to keep in mind as the ETF universe explodes.
Is Cash Really a Position? (Ivaylo Ivanov - Invanhof Capital) - Constantly staying invested and diversified is not the perfect solution for everybody.
Gerald Loeb's Timeless Wisdom (Gatis Roze -StockCharts.com) - Being free from pride and willing to be subservient to something like the market – which is so much bigger than any of us – allows one to remain open to listening to the market and letting the market itself show us the way.
Mind over Market - full length interview with Mark Douglas, author of Trading in the Zone. Here is a quote from his book:
The best traders have evolved to the point where they believe, without a shred of doubt or internal conflict, that “anything can happen.” They don’t just suspect that anything can happen or give lip service to the idea. Their belief in uncertainty is so powerful that it actually prevents their minds from associating the “now moment” situation and circumstance with the outcomes of their most recent trades. They have learned, usually quite painfully, that they don’t know in advance which edges are going to work and which ones aren’t. They have stopped trying to predict outcomes. They have found that by taking every edge, they correspondingly increase their sample size of trades, which in turn gives whatever edge they use ample opportunity to play itself out in their favor, just like the casinos.
Trading in the Zone is also available in our bookstore.
Links
PPO Trading Strategy - How to use 3 PPOs to develop a trend-reversion trading strategy.
Long-term Trend Indicators - Using the PPO, EMA Slope and CCI to determine the trend.
ETF Master ChartPack - 300+ ETFs organized in a Master ChartList and in individual groups.
Follow me on Twitter @arthurhill - Keep up with my 140 character commentaries.
****************************************
Thanks for tuning in and have a good day!
--Arthur Hill CMT
Plan your Trade and Trade your Plan
*****************************************


