SPY Sets up Oversold Bounce // QQQ Firms with Spinning Top // What Would it take to Turn Bullish? // Finance and Tech Among the Downside Leaders // Webinar Highlights //// SPY Sets up Oversold Bounce // QQQ Firms with Spinning Top // What Would it take to Turn Bullish? // Finance and Tech Among the Downside Leaders // Webinar Highlights ////
SPY Sets up Oversold Bounce
The market may just get a bounce now that everyone is bearish and stocks are quite oversold. Keep in mind that oversold is a double-edged sword. First and foremost, it takes strong selling pressure to push a stock or ETF to oversold levels. On the face of its, oversold means we have seen a sizable increase in selling pressure. In addition, note that oversold conditions are more likely in a downtrend. Second, stocks and ETFs can become even more oversold, which is what we saw last week. Stocks are now poised to bounce now that the world did not come to an end over the three-day weekend. Short-term, oversold conditions and excessive bearish sentiment could give way to a bounce within the bigger downtrend. I am not talking just about a strong open on Tuesday, but rather a bounce that retraces 38-62% of the prior decline.
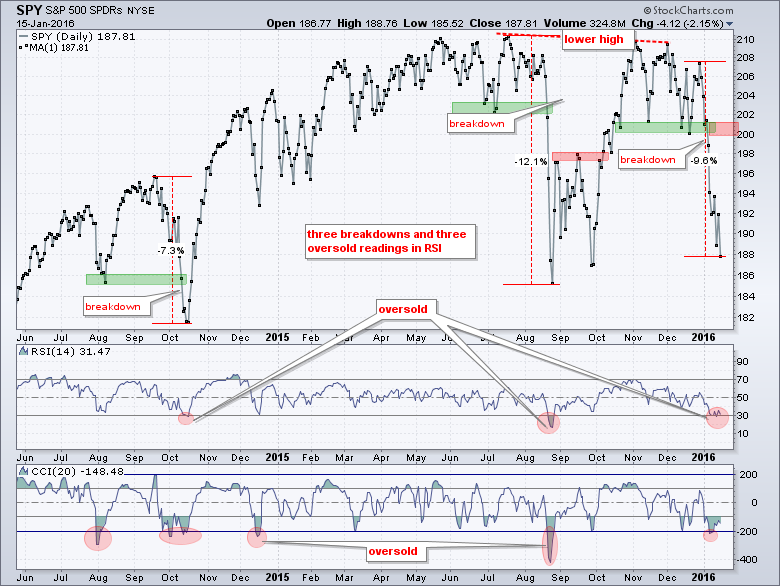
The chart above shows the S&P 500 SPDR (SPY) with RSI(14) and CCI(20), which are momentum oscillators. CCI(20) is more sensitive than RSI because it reached extreme levels more often. Notice that I added horizontal lines at +200 and -200 to increase the overbought-oversold thresholds for CCI. Even with this increase, CCI became oversold six times in the last 20 months and thirteen times in the last 4 years. In contrast, RSI became oversold just three times in the last 20 months and six times in the last four years. These oversold conditions tell us to prepare for a bounce, but we need to judge that bounce before considering it long-term bullish. At present, the most I would expect is a bounce back to the 200 area in SPY and 2000 in the S&P 500. Such a move would retrace 50-62% of the November-January decline and return to broken support, which turns resistance.
QQQ Firms with Spinning Top
QQQ is also oversold and trying to firm. Notice that the ETF formed a big harami on Wednesday-Thursday and a spinning top on Friday. SPY formed similar candlesticks as well. The harami and spinning top signal indecision that can foreshadow a bounce. A gap and long white candlestick today would forge something akin to a morning star reversal.
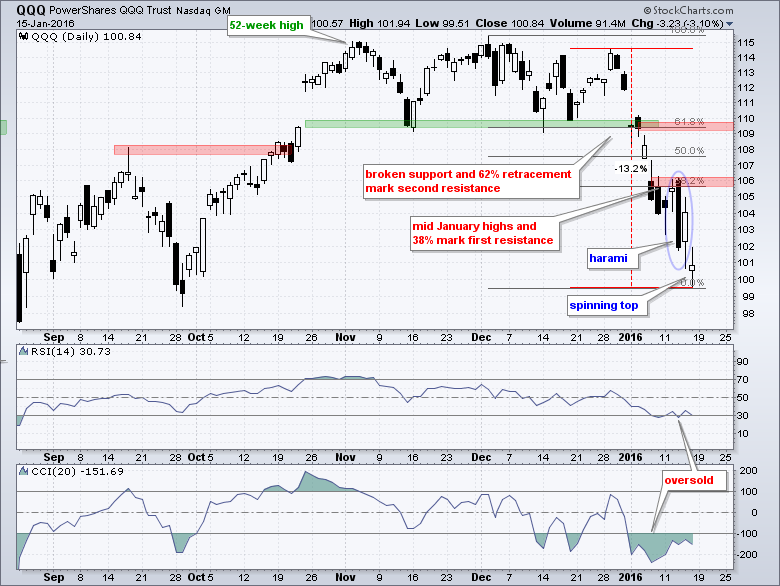
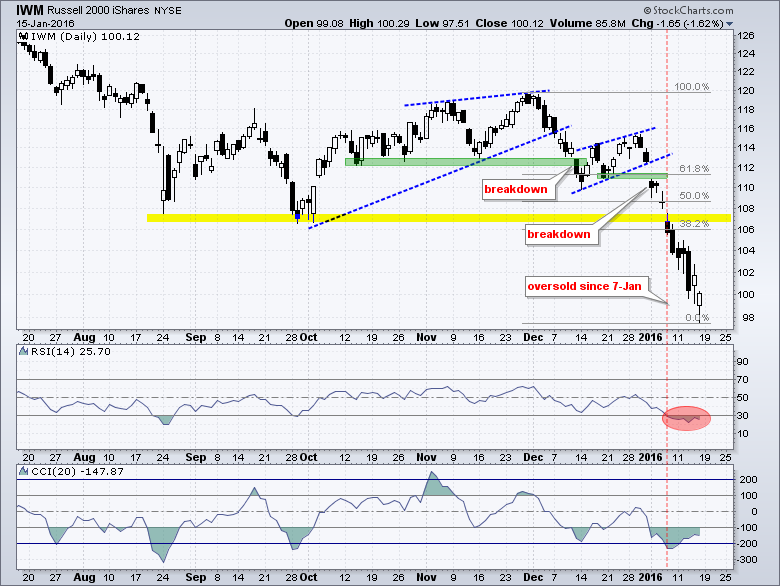
While this would be short-term bullish, I see potential resistance in the 106 area from the mid January highs and 38% retracement. Further up, I see potential resistance in the 109 area from broken support and the 62% retracement. This means we will probably see real resistance somewhere in between these two levels. This is not an exact science. After the January break down and bearish signal, I would not be surprised to see choppy trading as the market tries to find its footing. IWM remains the weakest of the big three and I am marking potential resistance in the 107 area.
What Would it take to Turn Bullish?
First, note that I am a trend-follower for the most part. This means I look for trend reversals and adhere to that signal until proven otherwise. As with Charles Dow, I do not know how long a signal will last or how far prices will extend. The trend will remain in force until proven otherwise. We want to be out of the stock market during bear markets or in low beta stocks. Conversely, we want to be in high beta stocks during a broad market uptrend. Chartists can also use relative strength and momentum to capture beta. We are currently in a bear market environment.
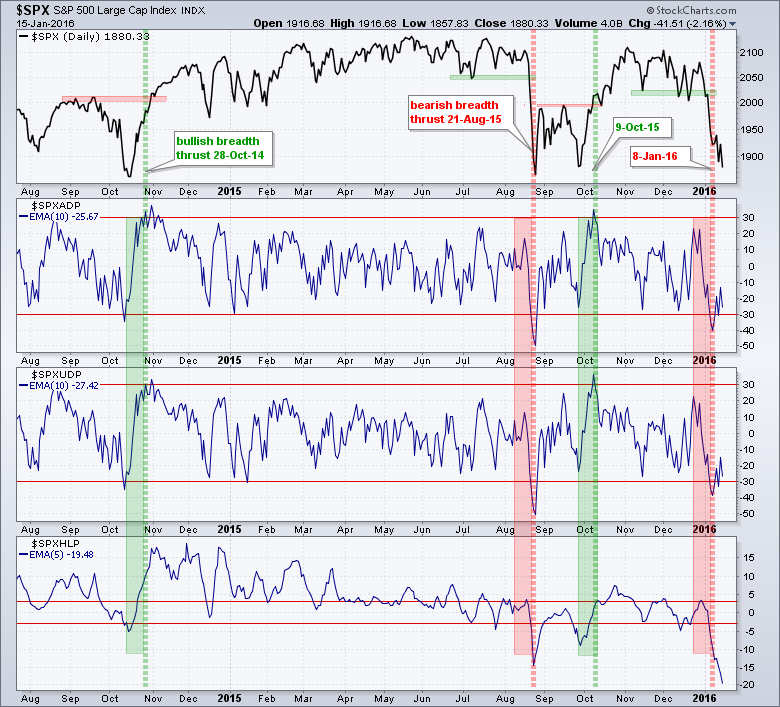
The chart above shows the S&P 500 with three breadth indicators to define bullish and bearish thrusts. It is rather unusual, but we have seen four reversal signals in the last 18 months. A bullish trend starts with a bullish breadth thrust, strong price surge and possibly a breakout. A bearish trend starts with a bearish breadth thrust, a strong price decline and possibly a support break. A bullish breadth surge occurs when the 10-day EMA for S&P 500 AD Percent ($SPXADP) surges above +30%, the 10-day EMA for S&P 500 AD Volume Percent ($SPXUDP) surges above +30% and the 5-day EMA for High-Low Percent moves above +3%. Moves below -30% and -3% count as a bearish breadth thrust. I am assuming that a breadth thrust is strong enough to result in a trend change and this signal remains valid until countered with an opposing signal. I will never pick a bottom or a top using this strategy, but it gives me a quantifiable methodology to identify broad market swings. Notice that the two October surges were accompanied by bullish breadth thrusts. This is what we need to see before talking bull again. The S&P 500 is currently on a bearish signal since January 8th. I will show similar charts for the S&P Small-Cap 600, S&P MidCap 400, S&P 1500 and Nasdaq 100 in today's webinar (click here for the recording).
Finance and Tech Among the Downside Leaders
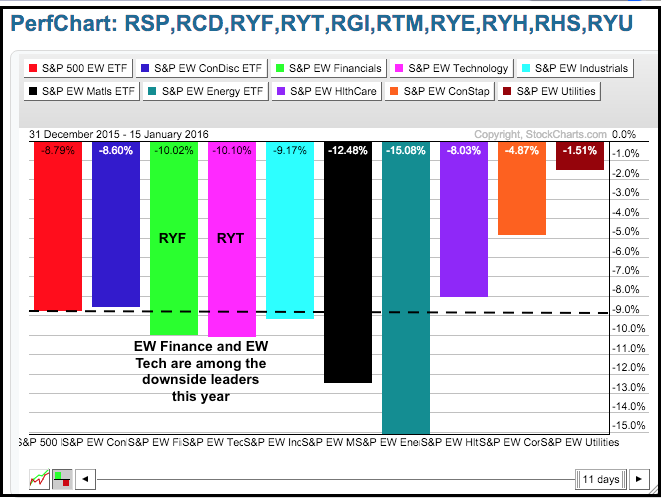
All nine equal-weight sector ETFs are down year-to-date and only one sector SPDR is up year-to-date. As of Friday's close, the Utilities SPDR (XLU) was up .30% for the year and the only sector in the green. The other eight sector SPDRs are down with the Finance SPDR (XLF) and the Materials SPDR (XLB) leading the way. Both are down double digits. Among the equal-weight sector ETFs, the EW Energy ETF (RYE), EW Materials ETF (RTM), EW Finance ETF (RYF) and EW Technology ETF (RYT) were leading with double-digit declines. RYT and RYF were down around 10% and a bounce today would put this back above the -10% threshold.
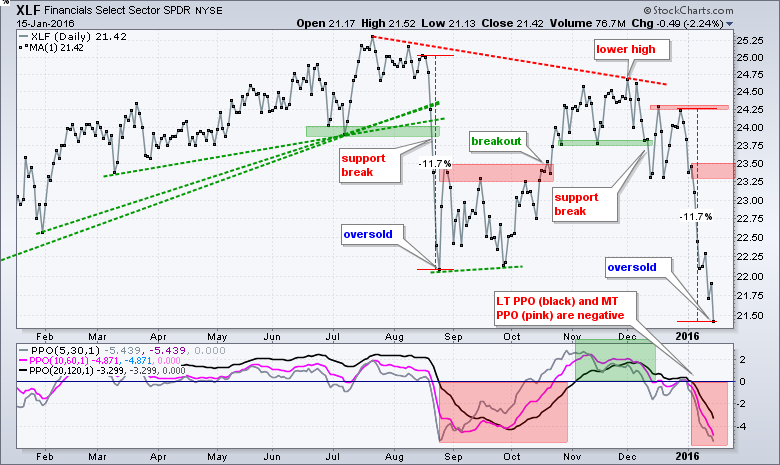
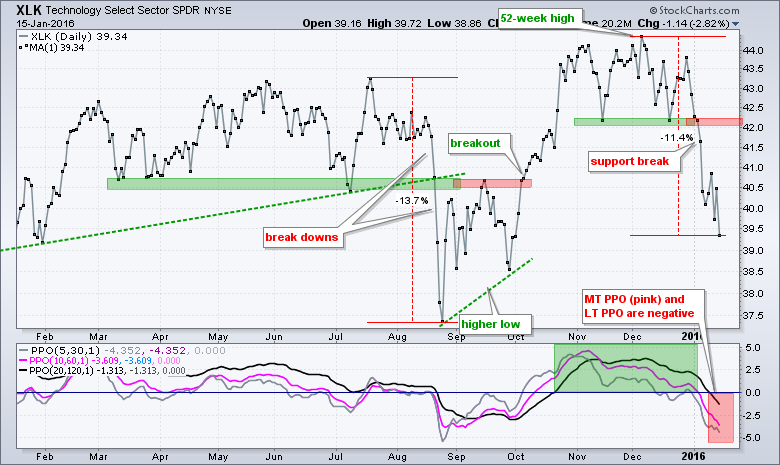
Even with a bounce today, it is not positive to see the equal-weight finance and technology sectors leading the market lower. In addition, it is certainly not positive to see such broad weakness in the stock market. The chart below shows XLF breaking below the August-September lows and becoming very oversold after an 11.7% decline. XLK is also oversold after an 11+ percent decline. I will cover the charts for the other sectors SPDRs and the nine equal-weight sectors in today's webinar.
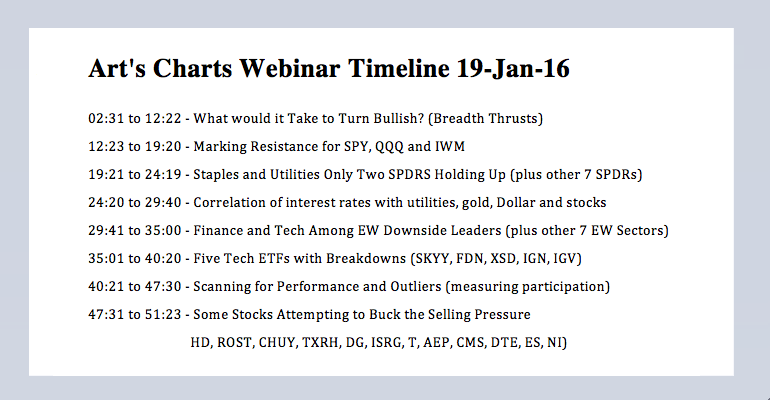
Webinar Highlights
In addition to the topics and charts above, I will also cover the following in today's webinar (Tuesday, January 19th, 1PM ET). Click here to register.
- Staples and Utilities Hold up the Best
- Software and Defense Show Relative Strength
- Over a Dozen Stocks That Held up This year
- Scanning for Outliers
Links
Measuring Risk On-Off - Using charts to quantify stock, economic and credit risk.
PPO Trading Strategy - How to use 3 PPOs to develop a trend-reversion trading strategy.
Long-term Trend Indicators - Using the PPO, EMA Slope and CCI to determine the trend.
ETF Master ChartPack - 300+ ETFs organized in a Master ChartList and in individual groups.
Follow me on Twitter @arthurhill - Keep up with my 140 character commentaries.
****************************************
Thanks for tuning in and have a good day!
--Arthur Hill CMT
Plan your Trade and Trade your Plan
*****************************************


