High Beta Stocks Versus High Quality Stocks // Equal-weight versus Large-caps // Small-caps versus Mega-caps // Charting the Economy with Four ETFs // Junk versus Investment Grade and Treasuries // TED Spread Surges // Charting the Financial Stress Index // Conclusions ////
Introduction
Measuring the risk appetite in the financial markets can help investors with their portfolio allocations. In general, we want to be long stocks and long beta when the risk appetite is strong. Conversely, we want to be out of stocks or positioned defensively when the risk appetite is weak. Note that risk metrics are not timing tools. They are meant to supplement trend analysis and help investors develop a macro outlook. Investors also need to consider the underlying trends before positioning. We do not want to be long a high beta stock when it is in a downtrend and we do not want to be long a defensive stock when it is in a downtrend.
This article will focus on several risk metrics we can use at StockCharts to assess the level of risk in the financial markets. I am using a combination of ETFs, indices and a user-defined data index from the St Louis Federal reserve. Note that you need a pro account to create a user-defined index, but Fed charts are freely available at the St Louis Fed website. A link is provided at end of this article. The first group focuses on internal risk metrics for the stock market, the second group focuses on the economy and the third focuses on credit. Each chart in this article is linked to a SharpChart (except the Financial Stress Index). You can click on this chart to see the settings and save it to your favorites list.
For those just looking for the conclusions....the risk indicators for the stock market are negative, and have been since August. The risk indicators for the economy are negative and have been since the end of December. The majority of credit indicators are negative, but the Financial Stress Index has yet to signal a warning. Thus, the indicators are clearly net negative for the stock market, the economy and credit. Read on for the gory details.
High Beta Stocks Versus High Quality Stocks
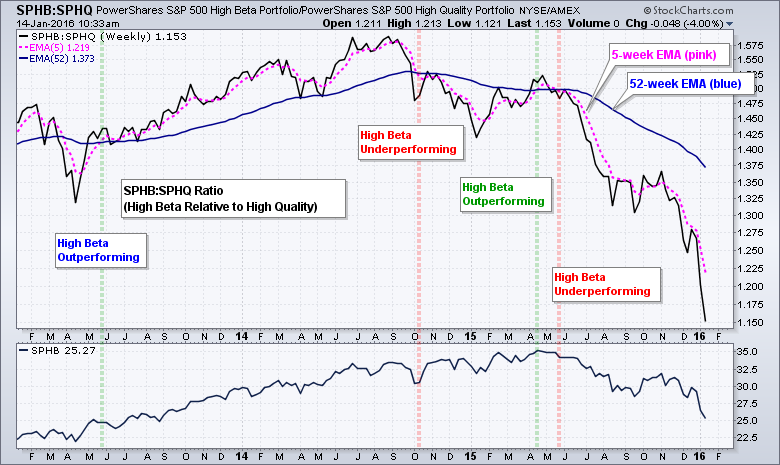
The first group of charts looks inside the stock market to determine the risk appetite for stocks. In general, chartists can measure the risk appetite by comparing the performance of higher risk stocks and lower risk stocks. After all, it's all relative. First, chartists can use the S&P 500 High Beta ETF (SPHB) and the S&P 500 High Quality ETF (SPHQ) as proxies for high beta and high quality. I realize that these two ETFs have low volume and might not be suitable for trading, but they capture two very different slices of the S&P 500. Each ETF holds 100 stocks (20% of the S&P 500) and the components are rebalanced quarterly. SPHB holds the 100 stocks with the highest betas and SPHQ holds the 100 stocks with the most stable earnings growth.
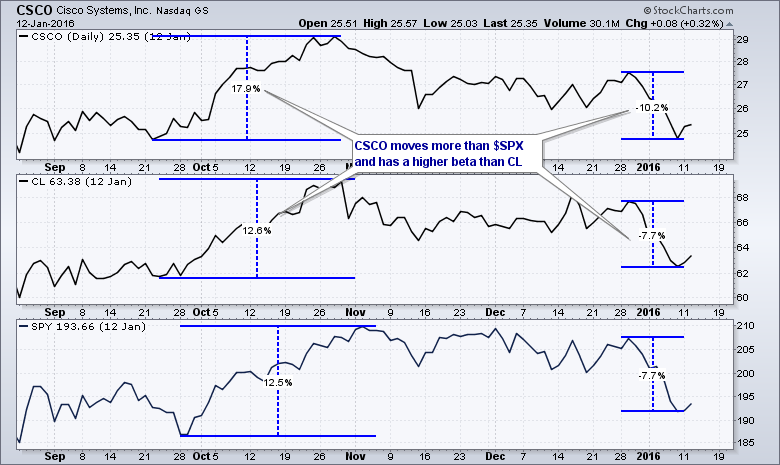
For those who do not know, beta is a measure of volatility relative to a market benchmark, such as the S&P 500. A stock with a beta of 2 will have double the volatility of the S&P 500. If the S&P 500 rises 10%, this stock is expected to rise 20%. If the S&P 500 falls 10%, this stock is expected to fall 20%. A beta of 1 means the stock rises and falls in line with the S&P 500. A beta of .50 means the stock is much less volatile than the S&P 500. If the S&P 500 rises 10%, then this stock is expected to rise 5% (half as much). Investors want to be long high beta stocks when the risk appetite is strong because this increases the chances of outperformance. As asn example, the chart below shows Cisco (CSCO) moving more than Colgate Palmolive (CL) during the October advance and the January decline. Note that you cannot use these percentage moves to calculate beta. The actual formula is much more involved and this is just a back of the envelope example.
I am using the price relative for many of these charts. The price relative is a ratio chart that compares the performance of one asset against another. In this example, I am plotting the SPHB:SPHQ ratio to compare the high beta ETF with the high quality ETF. The ratio rises when the numerator (SPHB) rises faster than the denominator (SPHQ), and falls when the numerator falls faster than the denominator. Thus, the ratio rises when high beta outperforms high quality and falls when high beta underperforms. I also added a 5-week EMA and 52-week EMA to this weekly chart to help quantify the trend. The trend is up when the 5-week EMA is above the 52-week EME and down otherwise. As you can see from this chart, the high beta ETF (SPHB) has been underperforming the high quality ETF (SPHQ) since May. This points to risk aversion within the S&P 500 and this means we do not want to own high beta stocks.
Equal-weight versus Large-caps
Chartists can measure relative performance for the "average stock" by comparing the S&P 500 Equal-Weight Index ($SPXEW) with the S&P 500. As its name suggests, the S&P 500 EW Index represents the average stock in the S&P 500 and each component is weighted roughly the same. This means Apple, with a market cap of over $500 billion, counts roughly the same as Pitney Bowes (PBI), which has a market cap of $3.5 billion. The S&P 500 represents large-caps. Note that the top ten stocks (2% of the index) account for around 17% of the index and the top 50 stocks (10% of the index) account for around 48% of the index. These numbers are based on the holdings on January 2016 and are subject to change, but the overall concept holds. A relatively few large-cap stocks dominate the S&P 500. $SPXEW represents the average stock and is more representative of the market as a whole.
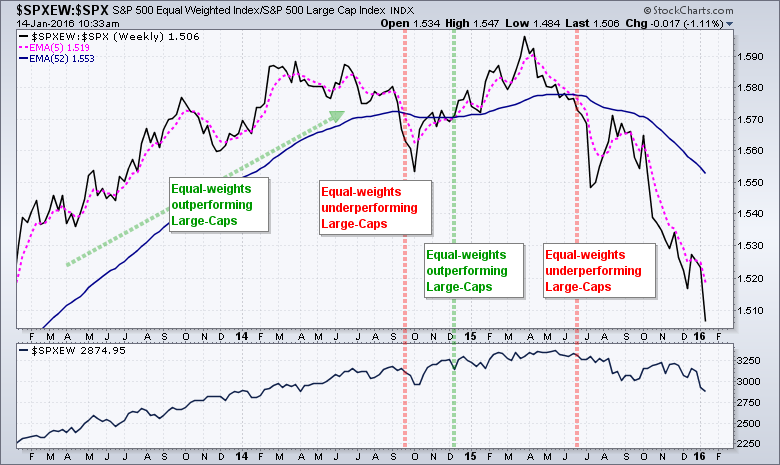
Chartists can measure participation by comparing the performance of the S&P 500 EW Index with the S&P 500. Again, we will use the price relative ($SPXEW:$SPX ratio) for analysis. The equal-weights are outperforming large-caps when this ratio rises and underperforming when it falls. A rising ratio means equal-weights are leading and participation in the advance is broad. A falling ratio indicates that upside participation is narrowing and a few large-caps are leading the market.
Equal-weights vs Large-caps - $SPXEW:$SPX Ratio - Bearish EMA cross on 26-Jun-2015
Small-caps versus Mega-caps
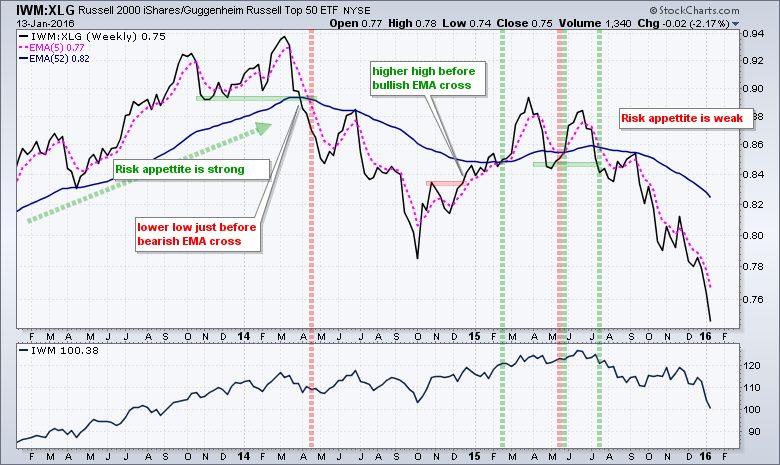
Chartists can also compare the Russell 2000 iShares (IWM) with the Russell Top 50 ETF (XLG) to gauge the risk appetite within the stock market. The Russell 2000 is a broad index of small-caps stocks and the Russell Top 50 is a narrow index representing the 50 largest stocks in the Russell universe. Small-caps typically have higher betas and more risk than large-caps. Using the price relative (IWM:XLG), chartists can easily see when the stock market prefers small-caps (more risk) or large-caps (less risk). The market has had an aversion to small-caps since July 2015 and small-caps continue to underperform large-caps.
Small-caps vs Mega-caps - IWM:XLG Ratio - Bearish EMA cross on 31-Jul-2015
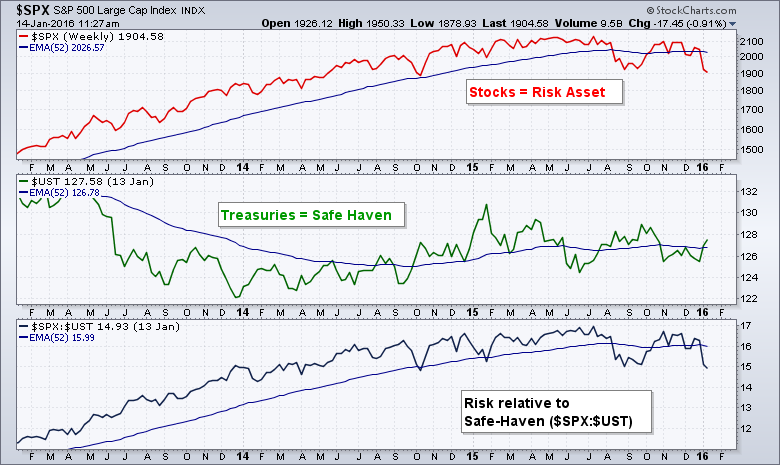
Stocks versus Treasury Bonds
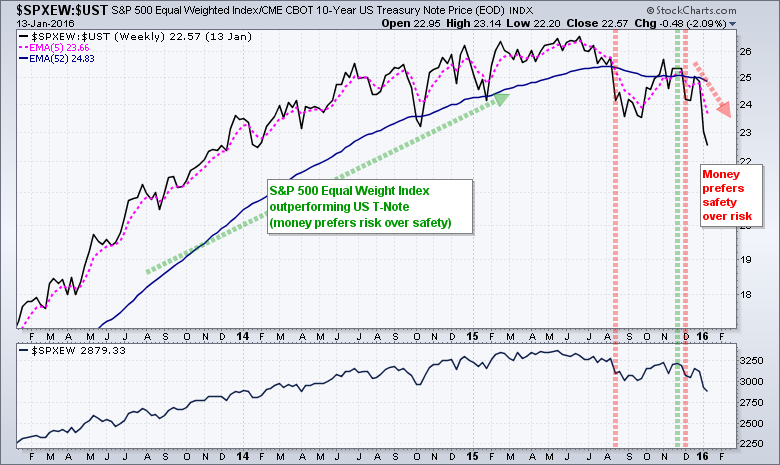
The relationship between stocks and bonds is perhaps the ultimate litmus test for risk appetite. Stocks represent the risky end of the financial spectrum and Treasury bonds represent the ultimate safe haven. Chartists can, therefore, get a clear idea of risk tolerance by comparing the performance of stocks against Treasury bonds. The risk appetite is clearly strong when stocks outperform Treasuries and clearly weak when stocks underperform.
Stocks vs Treasuries - $SPXEW:$UST Ratio - Bearish EMA cross on 11-Dec-2015
Charting the Economy with ETFs
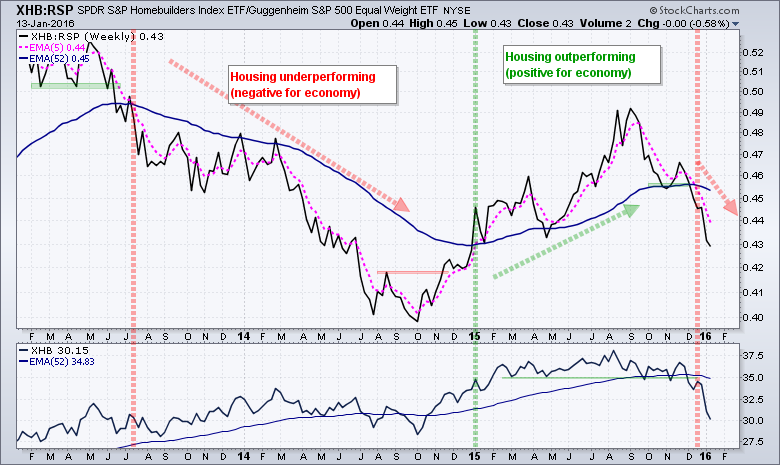
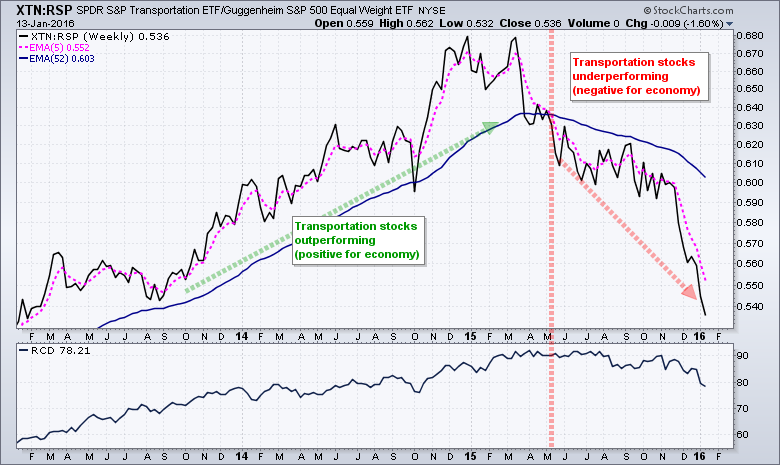
The next four charts are used to gauge four key areas of the economy: the consumer discretionary sector, retail, housing and transportation. Note that I am not looking at Retail Sales, Housing Starts, oil prices or Employment Data. Instead, I am using the Equal-weight Consumer Discretionary ETF (RCD), the Retail SPDR (XRT), the Home Builders SPDR (XHB) and the Transportation SPDR (XTN) as proxies.
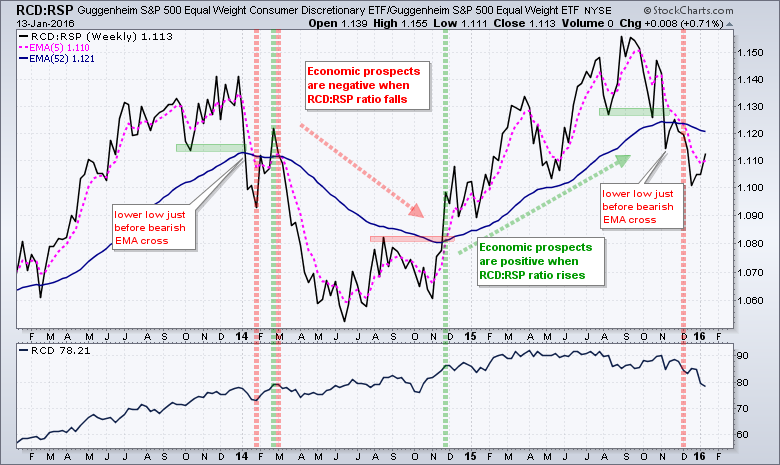
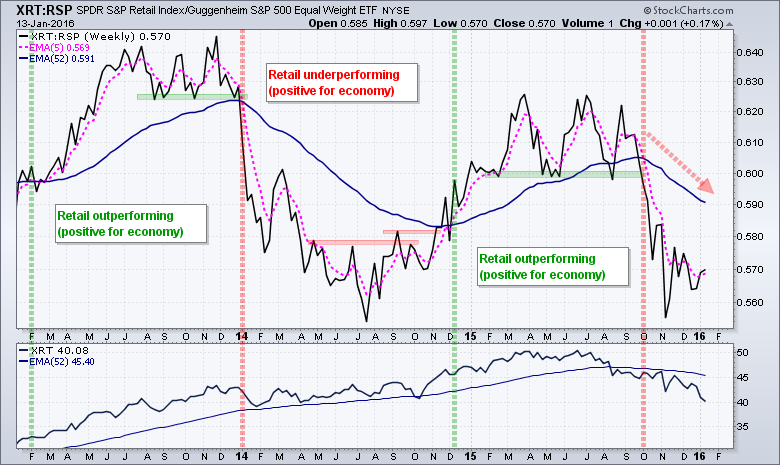
The stock market is a leading indicator and we can consider these ETFs as leading indicators for their respective economic areas. The economic prospects bode well when these four are leading the stock market and outperforming their benchmark, which is the EW S&P 500 ETF (RSP). The economic prospects bode ill when these four are underperforming their benchmark. By extension, I consider it negative for the broader stock market when they underperform and positive when they outperform.
Note that I am using the SPDRs for all of these because they are equal-weight ETFs. The Dow Transports and Transport iShares (IYT) are price weighted and have only 20 stocks. The Transportation SPDR has around 50 stocks and is more representative of the group as a whole. Again, I am using the price relatives to compare relative performance and the 5-week/52-week EMAs to quantify the trend. The chart of the ETF is shown in the lower window for reference.
Consumer discretionary Sector - RCD:RSP Ratio - Bearish EMA cross on 11-Dec-2015
Retail - XRT:RSP Ratio - Bearish EMA cross on 16-Oct-15
Housing - XHB:RSP - Bearish EMA cross on 24-Dec-15.
Transportation - XTN:RSP - Bearish EMA cross on 22-May-15
Junk versus Investment Grade and Treasuries
The next group of indicators measure credit risk and financial stress. Note that these indicators come from the bond market and are not always directly related to the stock market. Extreme credit events, such as 2007, can and will affect the stock market. Small and modest credit events sometimes do not affect the stock market. There can also be a delayed reaction between a credit event and a stock market reaction. Thus, chartists should keep credit risk in mind when looking at the macro environment for the financial markets, but remember that stocks sometimes march to the beat of a different drummer. It is a "it doesn't matter until it does" kind of thing.
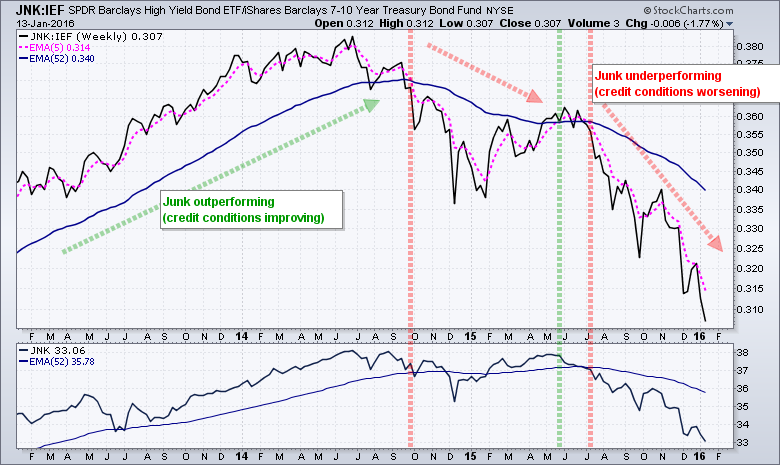
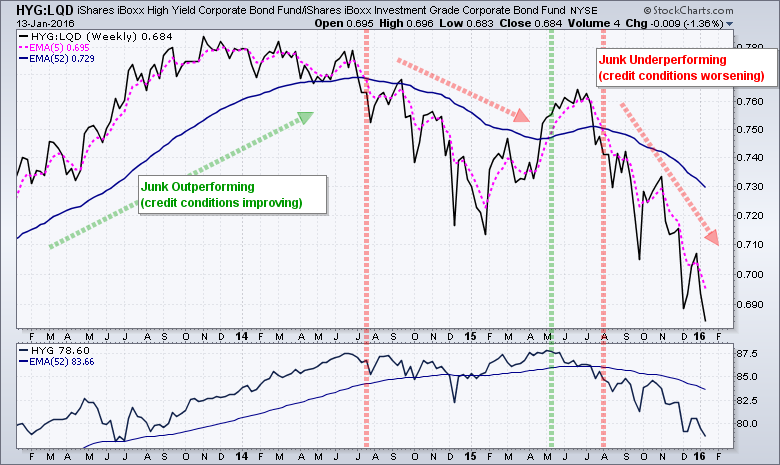
First, we will compare the performance of the High Yield Bond SPDR (JNK) with the 7-10 YR T-Bond ETF (IEF) and the High-Yield Bond ETF (HYG) with the Investment Grade Bond ETF (LQD). Junk bonds represent the riskiest end of the bond market and the first to suffer when credit conditions worsen. The JNK:IEF ratio and HYG:LQD ratios rise when junk bonds are outperforming and credit conditions are improving. Conversely, these ratios decline when junk bonds are underperforming and credit conditions are worsening.
Junk vs Treasuries - JNK:IEF - Bearish EMA cross on 17-Jul-15
Junk vs Investment Grade - HYQ:LQD - Bearish EMA cross on 7-Aug-15
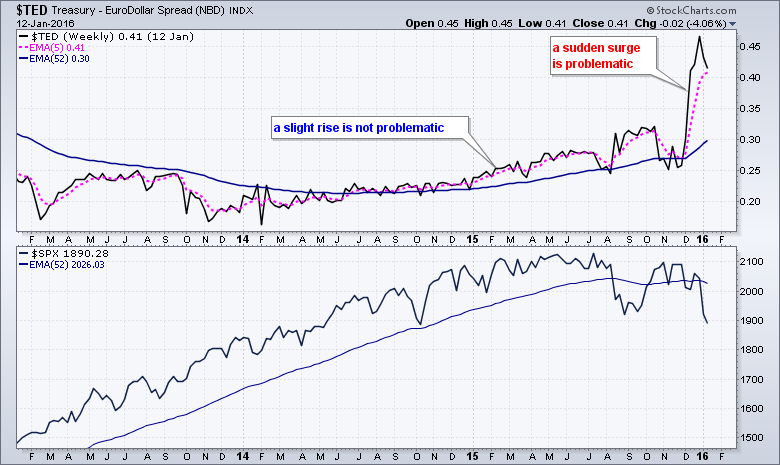
TED Spread Surges
Ted Spread ($TED) and this shows us the difference between 3-month $LIBOR and the yield on 3-month Treasury bills. $LIBOR is the one-month London Interbank Offered Rate, which is the average lending rate that banks charge one and other. This indicator tells us just how much confidence banks have in each other. Lower LIBOR reflects higher confidence in the ability to repay and higher LIBOR reflects lower confidence. The Ted Spread is used to differentiate between a general rise or fall in interest rates and a credit event. A surge in the $TED means $LIBOR as surged relative to the 3-month Treasury Yield ($UST3M). A sudden widening of this spread means the credit markets are tightening and this is a negative for financial markets.
Charting the Financial Stress Index
Last, but not least, we have the Financial Stress Index from the St. Louis Fed. Here's what the Fed has to say about it:
The STLFSI measures the degree of financial stress in the markets and is constructed from 18 weekly data series: seven interest rate series, six yield spreads and five other indicators. Each of these variables captures some aspect of financial stress. Accordingly, as the level of financial stress in the economy changes, the data series are likely to move together. The average value of the index, which begins in late 1993, is designed to be zero. Thus, zero is viewed as representing normal financial market conditions. Values below zero suggest below-average financial market stress, while values above zero suggest above-average financial market stress.
As noted by the Fed, zero is the key level to watch and the index was above zero three times in the last ten years: August 2007 to November 2009, May-June 2010 and October 2011. The index hit +5.82 at its peak in October 2008, but we were given plenty of warning because it turned positive in August 2007.
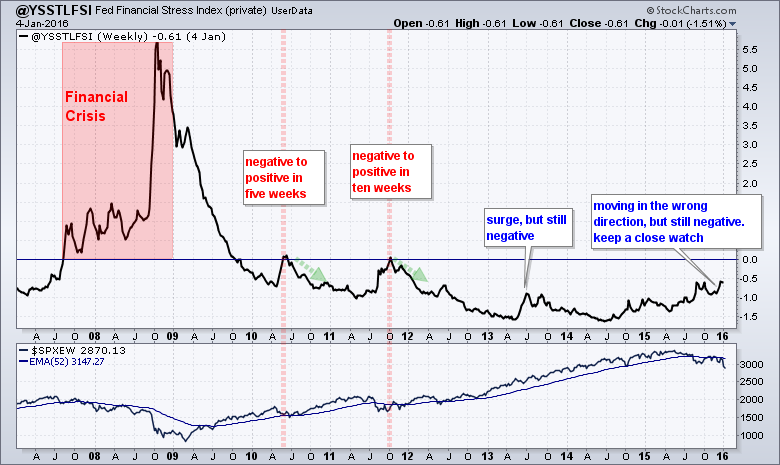
As with most credit events, changes can happen quickly and we are watching for sharp spikes. The Financial Stress Index surged from -.70 to +.10 in five weeks (April-May 2010) and from -.90 to +.05 in ten weeks (August-October 2011). These surges quickly subsided in both instances and the index quickly moved back below zero. The index has been rising since July 2014 and is at its highest level since early 2012. This is concerning, but the index remains in negative territory and true financial stress would not register until the index turns positive.
Note that I created this chart with a user-defined index by downloading the data from the St. Louis Fed database and uploading it a user-defined index in my StockCharts Pro account.
Conclusions
These charts are designed to measure the risk associated with the stock market. I would not put too much emphasis on one chart and one signal. Instead, I would use them as a group and pay attention to multiple signals. For example, I would not worry about the economy if the Home Builders SPDR is underperforming, but the Retail SPDR, Transportation SPDR and EW Consumer Discretionary ETF (RCD) are outperforming. The stock market can still go up with a few key groups underperforming, but will have a much harder time when several key groups start breaking down. Take a weight of the evidence approach instead of a signal indicator approach.
The credit indicators come from the bond market and chartists should not use these for timing the stock market. Junk bonds have been underperforming since the July 2014 and the Financial Stress Index has been moving higher since then as well. These two are clearly related. Despite bond market warnings in July 2014, the S&P 500 EW Index went on a to a new high in May 2015. Thus, the warning can take time to play out and chartists need to watch the actual stock index chart for signs of selling pressure.
See the bottom of this page to add a comment or provide feedback.
****************************************
Thanks for tuning in and have a good day!
--Arthur Hill CMT
Plan your Trade and Trade your Plan
*****************************************


