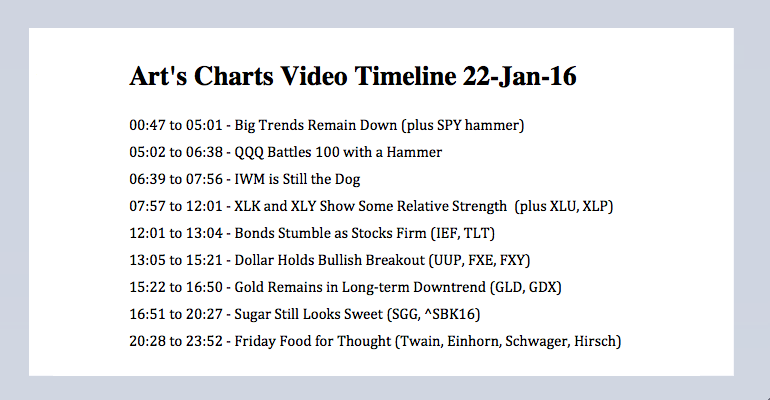
Big Trends Remain Down // IWM is Still the Dog // QQQ Battles 100 with a Hammer // XLK and XLY Show Some Relative Strength // Bonds Stumble as Stocks Firm // Dollar Holds Bullish Breakout // Gold Remains in Long-term Downtrend // Sugar Still Looks Sweet // Friday Food for Thought ////
Big Trends Remain Down
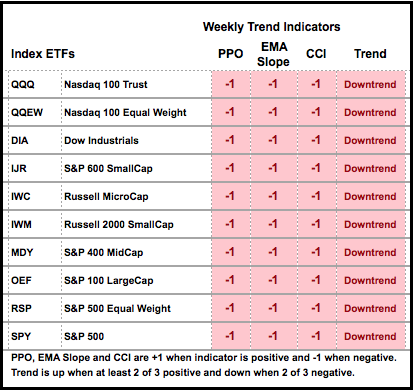
The bulk of the evidence remains bearish for the stock market. After sharp declines to start the year, stocks found their footing this week and managed to bounce a little. At this point, any bounce is considered a counter-trend advance within a bigger downtrend. A number of ETFs and stocks are forming weekly hammers and these could foreshadow an oversold bounce in the coming weeks. Playing such a bounce is quite the challenge because the bigger trend is down. Keep in mind that this bigger downtrend can trump an oversold bounce at any time. The mid-November lows marked broken support for many ETFs and these broken support levels can be used to estimate the first resistance levels. This equates to the 200 area for SPY and 2000 area for the S&p 500.
I will start off with the weekly candlestick chart for SPY. While I prefer the actual S&P 500 for trend indicators, I prefer SPY when it comes to candlesticks because the open, high, low and close are based on actual trades. The S&P 500, on the other hand, is an index based on the price action of 500 stocks. Even though the trend evidence is bearish, a weekly hammer is taking shape and prior hammers marked lows in February 2014, October 2014 and October 2015. Hammers forms when prices dip during the week and recover to close near the high end of the weekly range. A gap up on Monday would provide the first sign of follow through and could lead to a counter-trend bounce back towards the 200 area. Should this gap materialize, it is important that the gap holds. A move back below Friday's close would fill the gap and warrant a re-evaluation.
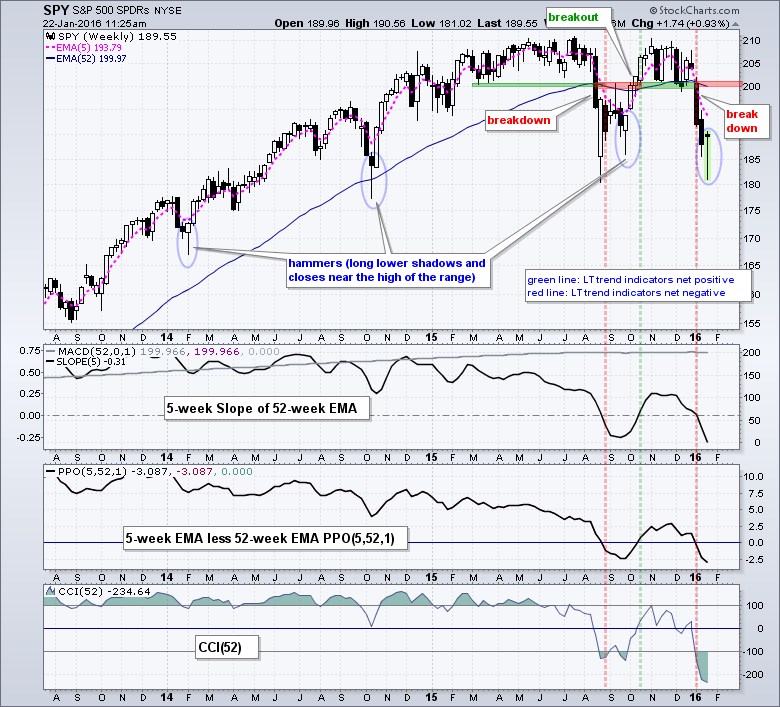 The long-term trend indicators have been whipsawed the last six months with three signals. These are trend-following indicators and whipsaws will happen. For what it is worth, the August support break occurred just before the trend indicators turned net negative and the October breakout occurred just before the trend indicators turned net positive. This is why I combine basic chart analysis with trend indicators. Most recently, SPY broke support in the 200 area and this break coincided with the trend indicators turning net negative. You can read more about these trend indicators here.
IWM is Still the Dog
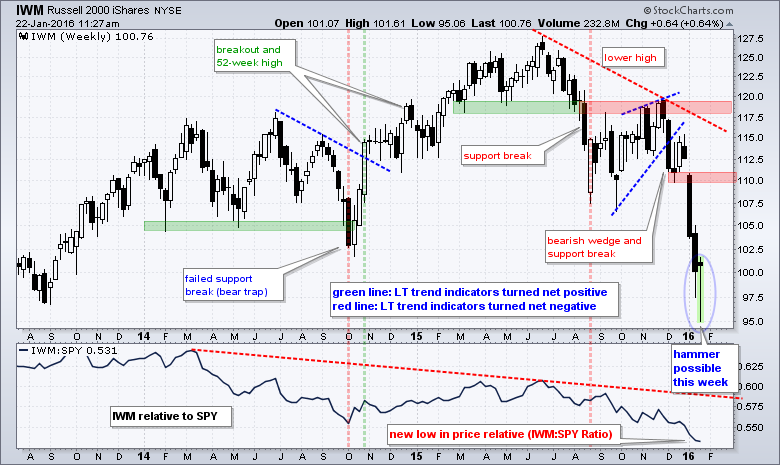
IWM is also quite oversold and poised to form a weekly hammer that could set up an oversold bounce. The overall trend, however, is clearly down and any bounce would be considered a counter-trend move. The long-term trend indicators turned net negative in mid-August and remained net negative into November and December. IWM broke wedge support in mid-December and hit new 52-week lows the last two weeks. Also notice that the price relative (IWM:SPY ratio) hit a new 52-week low this week as IWM continued to show relative weakness. The only positive on this chart is that the index is quite oversold after a 20+ percent decline from high to low over the last eight weeks. This, however, is not that positive because it takes strong selling pressure to become oversold.
 QQQ Battles 100 with a Hammer
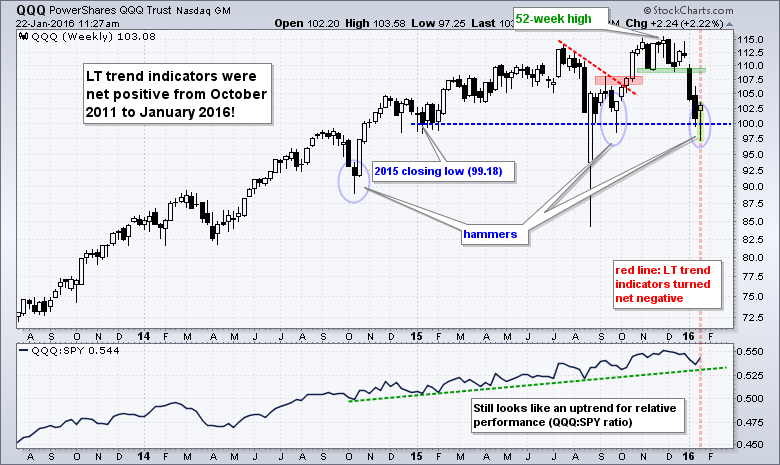
The Nasdaq 100 ETF (QQQ) is holding up the best of the major index ETFs. Note that the weekly closing low in 2015 was 99.81 in January and the ETF has yet to close below this low. On a closing basis, note that DIA, IJR, IWC, IWM, MDY, OEF, QQEW, RSP and SPY all recorded new 52-week lows this month. QQQ is the only one that has yet to record a 52-week closing low. On the price chart, the ETF is forming a hammer near 100 this week. The ETF has dipped below the 100 level at least eleven times since December 2014 - and managed to close above 100 on ten of those occasions. Even though I am hesitant to mark support when the trend indicators are net negative, it is hard to argue with QQQ's ability to hold the 100 level. In addition to testing the 100 level, QQQ shows relative strength because the price relative is still trending higher.
XLK and XLY Show Some Relative Strength
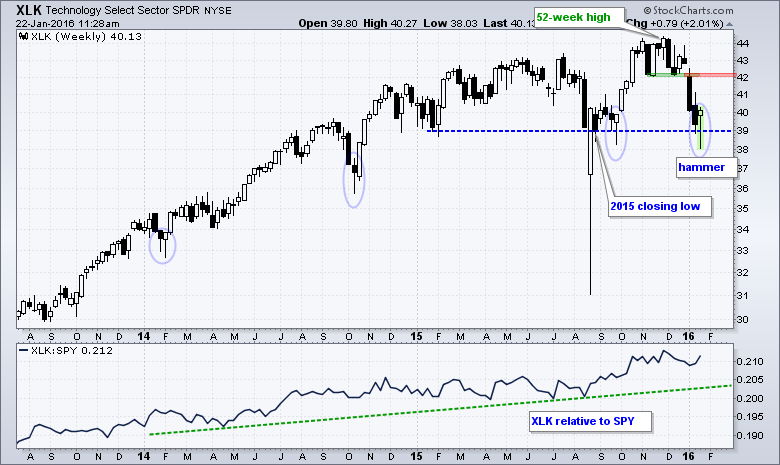
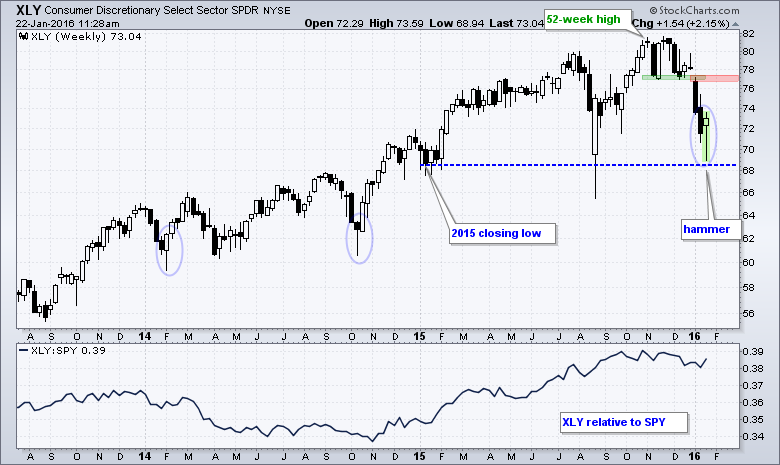
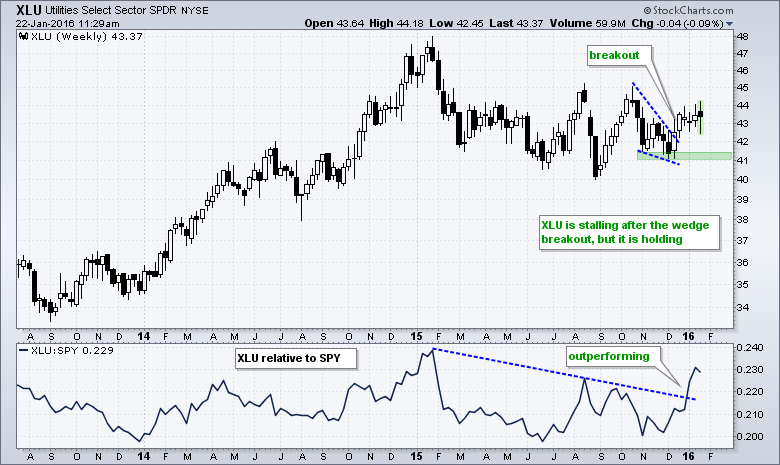
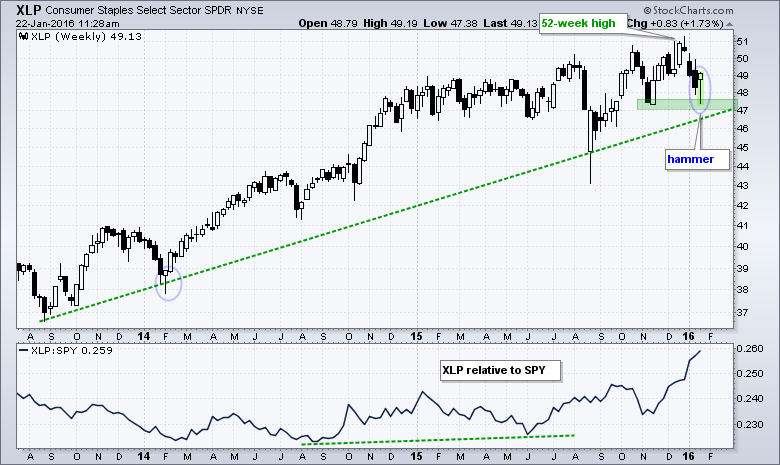
The most beaten down groups are likely to lead an oversold bounce or counter-trend advance in the stock market (oil, copper, mining). It may be tempting to try and ride these groups for the outsized bounces, but I prefer to find the sector and industry group ETFs that held up the best during the January decline. In other words, I am not interested in anything oil or commodity related because the long-term trends are still down, very down. Among the sector SPDRs, the Utilities SPDR (XLU) and Consumer Staples SPDR (XLP) are clearly holding up the best. Trend-wise, XLU and XLP are the only two where the long-term trend indicators are net positive. The Consumer Discretionary SPDR (XLY) and the Technology SPDR (XLK) are also showing some relative strength because they are above their 2015 closing lows (blue dotted line).
Bonds Stumble as Stocks Firm
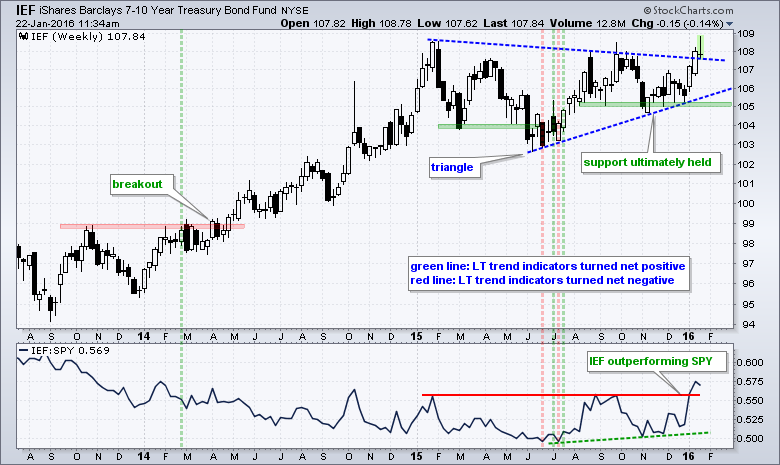
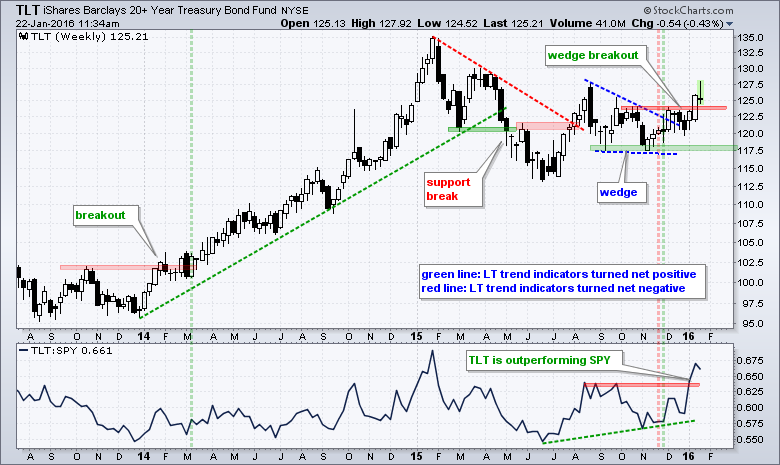
Bonds and gold could take a hit if the stock market gets an oversold bounce. The 7-10 YR T-Bond ETF (IEF) remains in an uptrend and recently broke the triangle trend line. While this breakout would likely fail if the stock market bounces, a failed breakout would not be enough to reverse the overall uptrend. The long-term trend indicators turned bullish in July (and stayed bullish after a few whipsaws). IEF support is set at 105. A close below this level would warrant a reevaluation of the overall uptrend. The indicator window shows the IEF:SPY ratio breaking out as Treasuries outperform stocks this year and this reflects the risk-off environment right now. The 20+ YR T-Bond ETF (TLT) is struggling more than IEF because it is nowhere close to its January-2015 high. The ETF did break wedge resistance last week and this breakout is holding so far. The long-term trend indicators are also net positive, and have been since late November. Key support is set at 117.50 for a reevaluation level.
Dollar Holds Bullish Breakout
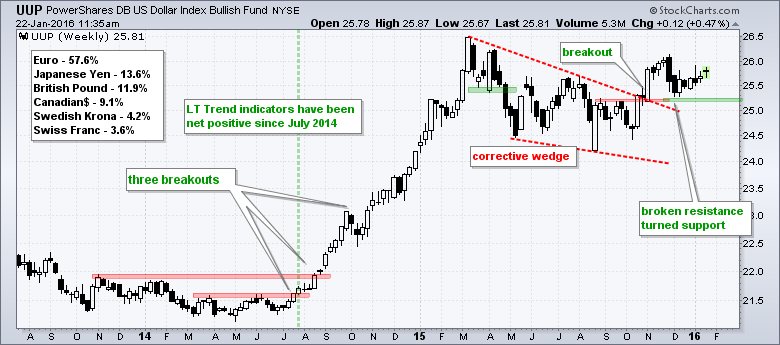
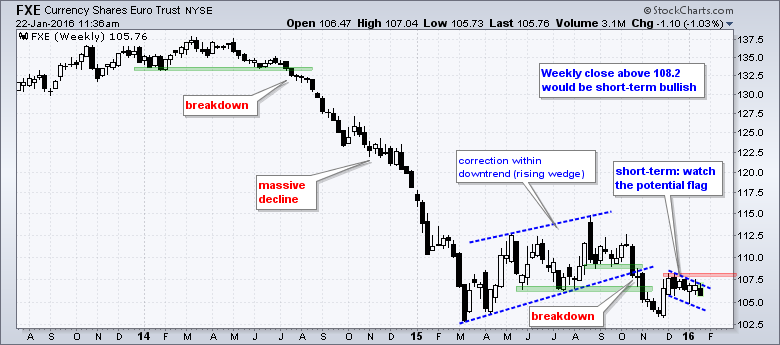
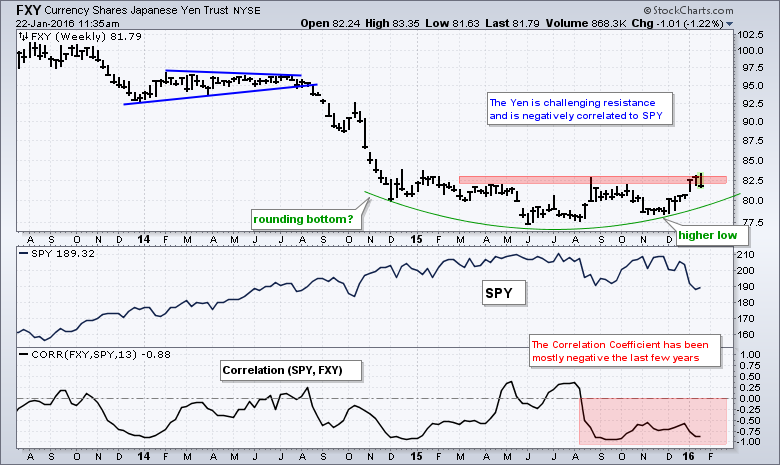
The Dollar is not quite sure what to do, but still has a bullish bias. The decline in the 10-YR Treasury Yield ($TNX) is Dollar negative, but Mario Draghi's "whatever it takes" rhetoric is Euro bearish. Overall, the wedge breakout for the Dollar is still holding and the greenback is up year-to-date. Thus, I have yet to see anything that warrants a bearish stance on the Dollar. The Euro ETF (FXE) broke wedge support in October, bounced a bit and then flat-lined the last six weeks. I would not consider turning bullish on the Euro unless it closes above 108.2 on the weekly chart. The Yen ETF (FXY) got a bounce with the flight to safety this month, but cannot break the August high and has gone nowhere since December 2014. A bounce in stocks would likely send the safe-haven Yen lower and this would benefit the Dollar.
Gold Remains in Long-term Downtrend
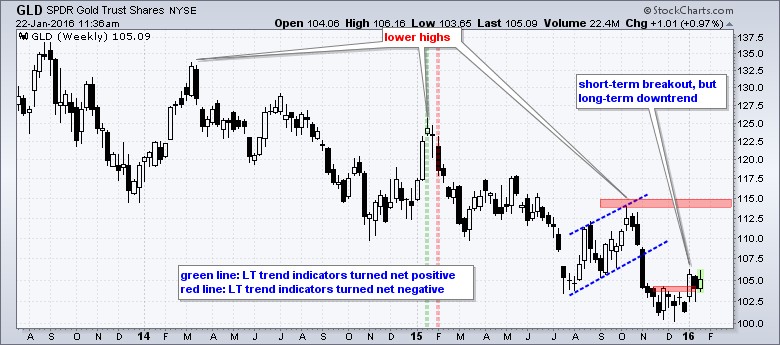
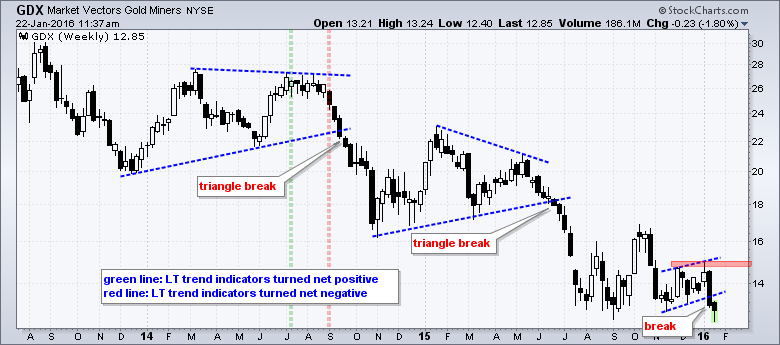
Gold benefited from market chaos this year as stocks and oil plunged, but could suffer should stocks and oil rebound. First, note that the Gold SPDR (GLD) remains in a long-term downtrend with a series of lower lows and the long-term trend indicators have been net negative since early February. GLD hit new lows in November-December and then bounced with a surge above 105 in early January. This short-term breakout is holding for now and chartists can mark first support at 102.5. A break back below this level would clearly negate the short-term breakout and re-exert the bigger uptrend. The Gold Miners ETF (GDX) is certainly not hopeful for gold because the ETF broke flag support last week and remains in a long-term downtrend.
Sugar Still Looks Sweet
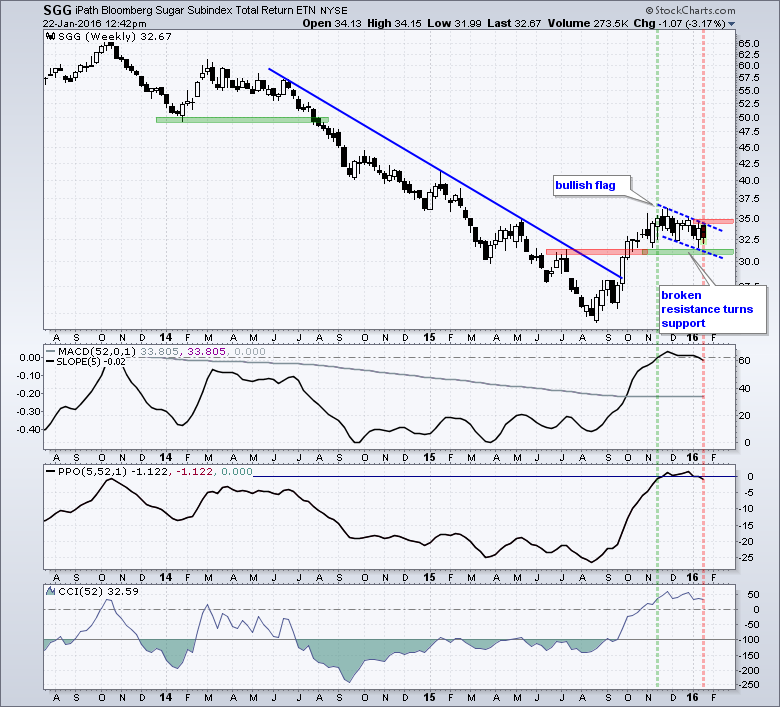
Sorry, I could not resist that headline. There are not a lot of bullish continuation patterns out there right now. The Sugar ETN (SGG) remains an exception as a falling flag continues to take shape. Before looking at the chart, note that commodity ETFs are a challenge for analysis because they do not perfectly track the underlying commodity. Small tracking errors can create small differences on the price charts. When possible, I like to look at the end-of-day (EOD) futures contract. Otherwise, I must look at the spot price or a Bloomberg index. In addition to the Sugar ETN (SGG), we can also look at Spot Sugar ($SUGAR), the Bloomberg Sugar Subindex ($BCOMSB) and the May Sugar Futures Contract (^SBK16).
The first chart shows weekly candlesticks for SGG and a bullish flag taking shape. A bullish flag forms after a sharp advance and slopes down. A flag breakout ends the pullback and signals a continuation of the prior advance. The long-term trend indicators turned net positive in mid-November, but they are on the verge of turning net negative again this week. Nonetheless, the setup looks bullish and a breakout at 35 would signal a continuation of the August-November surge. Note that sugar is by far the strongest commodity over the last five months.
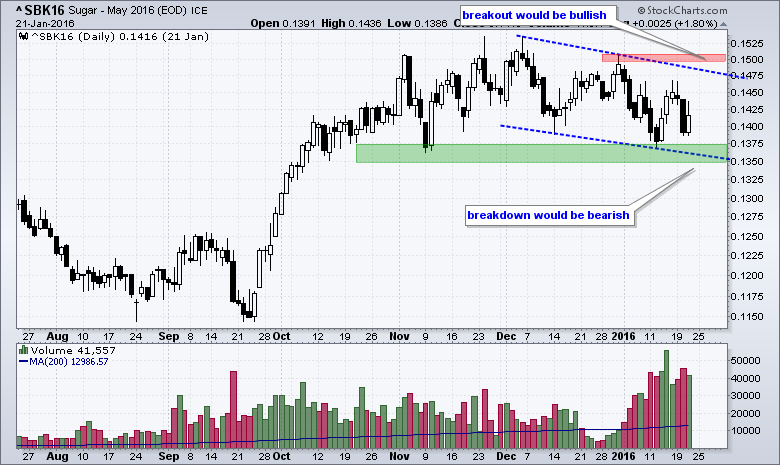
 The futures markets are the real drivers for commodity prices so I will be watching May Sugar (^SBK16) for signals. A breakout above the late December high would be bullish, and confirm the bull flag. A break below the green support zone would be bearish, and negate the bull flag.
Friday Food for Thought
Understanding Bear Market Bounces, Patterns, Signals and Retracements (Arthur Hill, StockCharts.com) - A look at the lessons learned in the last two bear markets. What signals and patterns worked? What were the typical retracements?
Notable Quotes from the Hedge Fund Market Wizards (Ivaylo Ivanov, Ivanhoff Capital)
Traders focus almost entirely on where to enter a trade. In reality, the entry size is often more important than the entry price because if the size is too large, a trader will be more likely to exit a good trade on a meaningless adverse price move. The larger the position, the greater the danger that trading decisions will be driven by fear rather than by judgment and experience.
The Great Myths of Investing (Bob Seawright, Madison Avenue Securities)
As the great Mark Twain (may have) said, “It ain’t what you don’t know that gets you into trouble. It’s what you know for sure that just ain’t so.” That’s particularly true in the investment world because we know, to a mathematical certainty, that avoiding errors provides more bang for the buck than making correct calls and generating outperformance. Fixing what we “know for sure that just ain’t so” provides a remarkable opportunity for investment success.
Greenlight Capital Q4 Letter to Investors (David Eindhorn)
At quarter-end, the largest disclosed long positions in the Partnerships were Apple, CONSOL Energy, General Motors, gold, and Time Warner. The Partnerships had an average exposure of 90% long and 76% short.
“I don’t know where I’m going from here, but I promise it won’t be boring.” — David Bowie
It's an Official Ned Davis Research Defined Bear Market (Jeff Hirsch, Almanac Trader)
In the face of the unrelenting battle on Wall Street for a mutually accepted definition of bull and bear markets we have relied on the Ned Davis Research parameters for years to track bulls and bears. A Bull Market requires a 30% rise in the Dow Jones Industrial Average after 50 calendar days or a 13% rise after 155 calendar days. Reversals of 30% in the Value Line Geometric Index since 1965 also qualify. A Bear Market requires a 30% drop in the Dow Jones Industrial Average after 50 calendar days or a 13% decline after 145 calendar days. Reversals of 30% in the Value Line Geometric Index also qualify. This applied to the 1987, 1990 and 1998 high and low.
The Future of Public Wi-Fi: What to Do Before Using Free, Fast Hot Spots (Joanna Stern, Wall Street Journal)
Like New York, cities all over are getting speedy public Wi-Fi, but proceed with caution.
Links
Measuring Risk On-Off - Using charts to quantify stock, economic and credit risk.
PPO Trading Strategy - How to use 3 PPOs to develop a trend-reversion trading strategy.
Long-term Trend Indicators - Using the PPO, EMA Slope and CCI to determine the trend.
ETF Master ChartPack - 300+ ETFs organized in a Master ChartList and in individual groups.
Follow me on Twitter @arthurhill - Keep up with my 140 character commentaries.
****************************************
Thanks for tuning in and have a good day!
--Arthur Hill CMT
Plan your Trade and Trade your Plan
*****************************************


