Candles Show Firming, but Closes say Otherwise // Trading Counter-trend Patterns and Signals in Bear Markets // Using Retracements to Anticipate Counter-trend Peaks // Understanding ZigZag Extensions ////
Candles Show Firming, but Closing Prices say Otherwise
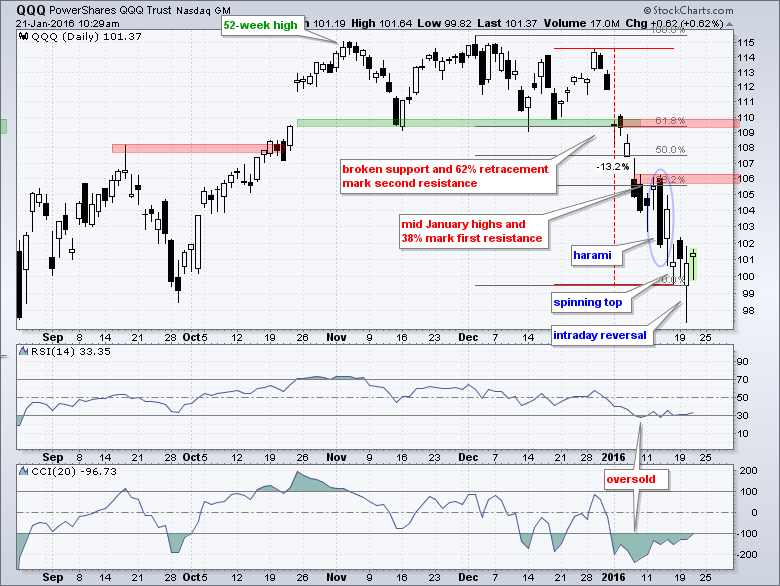
There is certainly a lot of chatter concerning Wednesday's intraday reversal. The S&P 500 SPDR (SPY) was down around 3.7% at one point and rallied back to close down just 1.28%. That's a 2.5% bounce off the intraday low. The Russell 2000 iShares (IWM) managed to close positive, as did some sector and industry group ETFs. Namely, the HealthCare SPDR (XLV), Semiconductor SPDR (XSD) and Biotech SPDR (XBI) closed with gains. The ability of these groups to close positive suggests that they may lead an oversold bounce. But, and this is a big BUT, we have to actually get an oversold bounce. Note that the candlestick chart for QQQ shows a spinning top four days ago and a big intraday reversal on Wednesday.
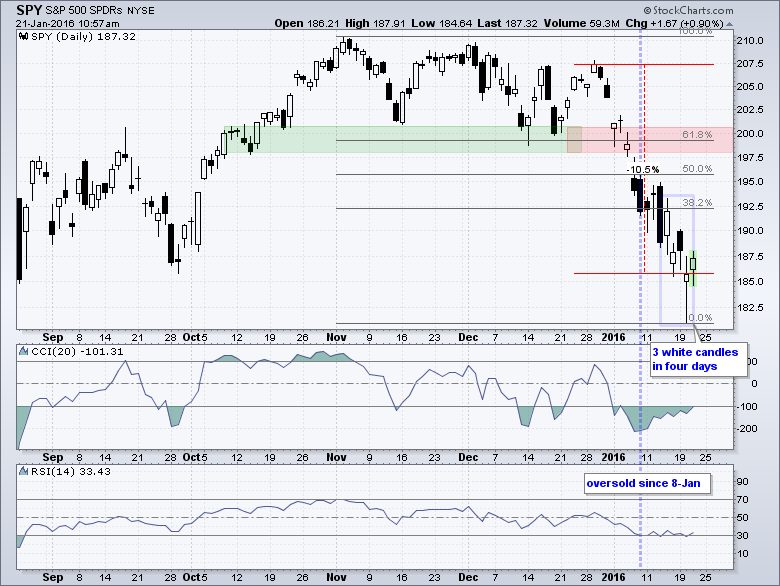
The SPY candlestick chart suggest that the market is trying to firm, but the close-only chart paints a different picture. The chart below shows SPY falling 10.5% in fourteen days on a closing basis. CCI(20) moved below -200 on January 7th, RSI(14) moved below 30 on January 8th and SPY was down 7.5% in seven days on January 8th (blue dotted line). One could reasonably assume that the ETF was ripe for an oversold bounce at the time and SPY even firmed around 192.5 on January 11th and 12th. The bounce, however, never came as SPY simply stayed oversold.
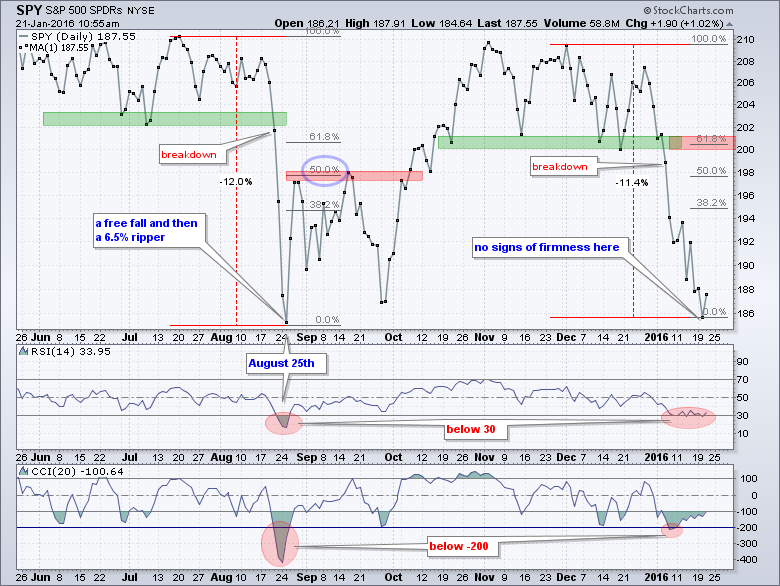
 The SPY candlesticks show signs of intraday firmness because three white candlesticks formed over the prior four days. This means the close was above the open. RSI is back below 30 and still oversold. Thus, SPY seems ripe for an oversold bounce again. Before getting too bullish, keep in mind that intraday volatility is quite high right now. The 5-day ATR is above 5, which means the Average True Range over the last five days has been around 5 points. In percentage terms, this means we are seeing 2.5% swings during the day.
Now let's look at a close only chart for a different perspective. Keep in mind that the long-term and short-term trends are down and these downtrends are the dominant force. A bounce at this stage would still be considered a counter-trend move. SPY closed below its late September low and just above its late August lows on Wednesday. I am not using these lows to mark support because the trend is clearly down and the concept of support is inconsistent with a downtrend. In contrast to the candlestick chart, there are really no signs of firmness on this chart because SPY keeps making lower lows this month. This does not however, preclude a rip higher. Notice how the ETF surged 6.5% in two days in late August and 6% in five days in late September. Bear market rips can come out of the blue and timing is very tricky. Personally, I would prefer to wait for a counter-trend bounce and attempt to time a continuation of the bigger downtrend. See the next sections for details.
Trading Counter-trend Bounces in Bear Markets
Since I am working under the assumption that we are in a bear market, it may help to look at the last two bear markets for some clues on what to expect going forward. No two bear markets are the same and this is certainly true of the last two, which were very different. Despite differences, we can learn from the past and apply these lessons to the current environment.
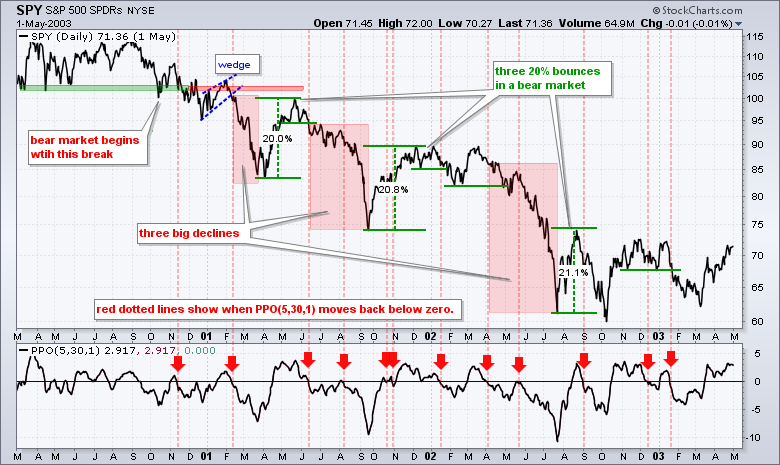
First up is the dot-com bear market after the 1999 bubble. SPY declined around 50% from March 2000 to October 2003 and there were three 20% bounces along the way. While it seems possible to make money on a 20% bounce, the reality is probably a bit different. In any case, I am not really interested in playing the counter-trend bounces. Instead, I am interested in waiting for a counter-trend bounce and playing the subsequent breakdown. Sometimes we get rising wedges, rising channels, flags, triangles and pennants to play. Sometimes we don't and there were few counter-trend patterns from 2000 to 2002. In the absence of patterns, we needed an indicator to define a counter-trend bounce and subsequent downtrend. In this example, I am using the PPO (5,30,1). A move above zero indicates a counter-trend bounce and a subsequent move below zero signals an end to this bounce. The signals are not perfect, but you would have caught the three biggest declines with signals in February 2001, June 2001 and April 2002. A little patience can pay off in bear markets and these signals appear to be worth the wait.
 Next up is the financial crisis bear market from 2007 to 2009. This bear market was different because there were six bearish continuation patterns to supplement the PPO (5,30,1). The blue dashed trend lines show three rising wedges and three triangles from January 2008 until February 2009. The vertical red lines mark the support breaks (lower lows) that signaled a continuation of the bigger downtrend. The three wedges produced the best signals and caught three sizable declines. The first two triangles did not work out, but the third triangle worked well.
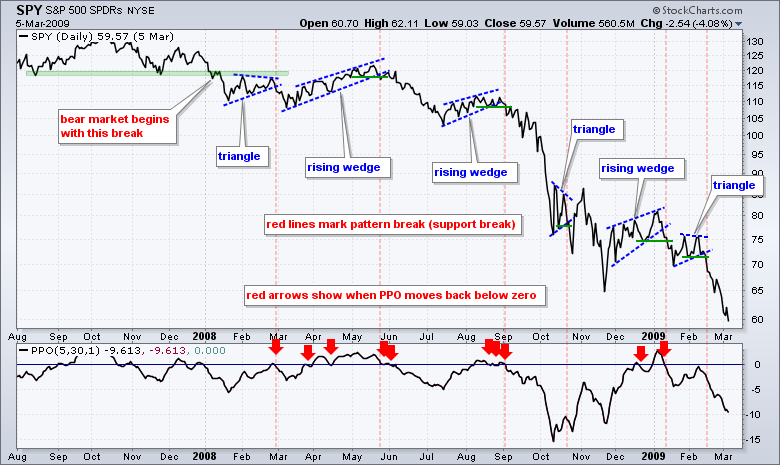 There are two key takeaways here. First, the rising wedge is your friend in a bear market. It is not used to play the advance, but rather to time a breakdown and continuation of the bigger downtrend. Second, the market does not always give us nice obvious patterns so sometimes we must use indicators to identify bounces and time reversals. Ideally, we can use a combination of patterns and indicators for timing. For example, a rising wedge and a PPO (5,30,1) move below zero would be the perfect combination. The subsequent wedge break and negative PPO cross would then provide the signal.
Using Retracements to Anticipate Counter-trend Peaks
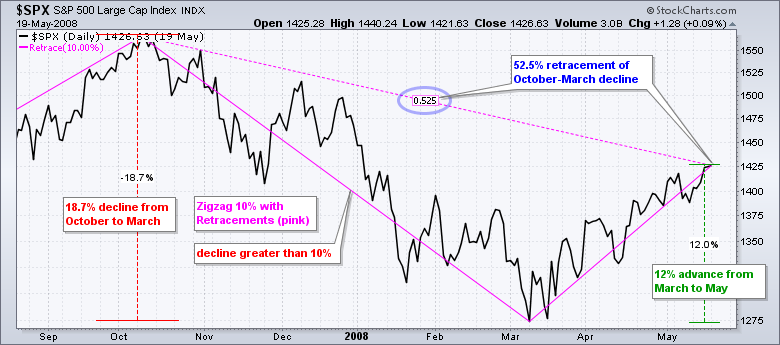
In addition to the patterns, chartists should also look at the retracements to anticipate peaks. The first chart shows an example using the 10% Zigzag indicator with retracements. Set at 10%, this indicator filters out price movements that are less than 10% and only shows the big moves. The S&P 500 declined 18.7% from October to March and this is marked by one zigzag line because the counter-trend bounces were less than 10% during this period. The bounce from March to May exceeded 10% so another zigzag line was drawn. By choosing ZigZag (retrace) we can also see the exact retracement of this move, which is .525 or 52.5%.
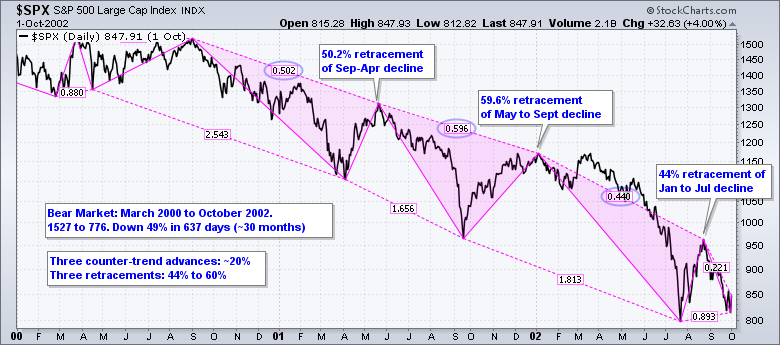
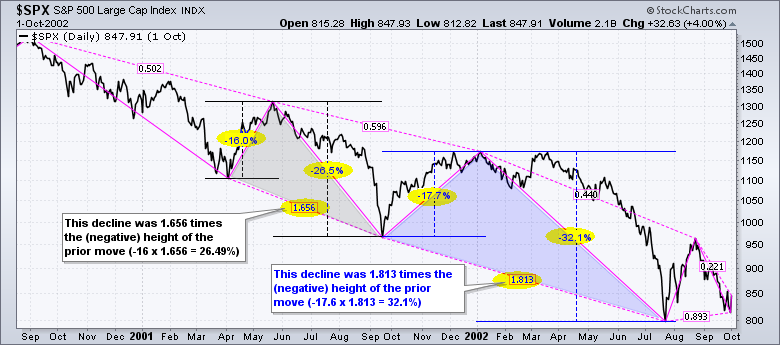
 The next chart shows the bear market from March 2000 to October 2002 (two and a half years). There were three big counter trend advances that exceeded 20%. Thus, three "official" bull markets started during this long bear market. The counter-trend advances were big because the prior declines were bigger, and this is why the bear market never ended after seemingly big advances. Notice that these big advances paled relative to the prior declines because they retraced 44 to 60 percent of the prior decline. In other words, they still formed lower peaks and never came close to reversing the overall downtrend.
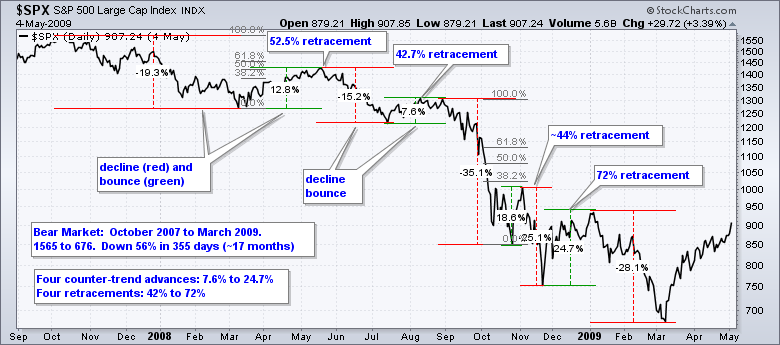
 The next chart shows the bear market from October 2007 until March 2009 (17 months). Even though 2 bear markets is a small sample, the average length of these two bear markets is two years. The S&P 500 peaked in May and this means we are currently eight months into this bear market. The 2007-2009 bear market looks much different than the 2000-2002 bear market. The decline from 1500 to 1200 (-20%) took a year and the index then fell below 700 (-41%) in the subsequent six months. The red percentage change tools mark the individual declines and the green percentage change tools mark the subsequent bounces. I added the Fibonacci Retracements Tool twice to show the retracements and also put in the numbers. There were four counter-trend bounces that ranged from +7.6% to +24.7% and these retraced between 42 and 72 percent.
 There are a few takeaways from the prior bear markets. First, counter-trend rallies can form as slow rising wedges (2008) or as sharp bounces (2000 to 2002). Second, counter trend rallies can retrace between 40 and 70 percent. This means we should grow leery of a counter-trend bounce when it exceeds the 38.2% retracement line on the Fibonacci Retracements Tool. Putting is all together, I would be on alert for bearish signals after a rising wedge or counter-trend bounce retraces 40% of its prior decline. You can send comments or suggestions on this article using "add comments" link at the bottom.
Understanding ZigZag Extensions
The ZigZag (retrace) indicator also includes extensions. Again, the pink line is the 10% ZigZag (retrace) and the extensions are shown with the dotted lines. The gray triangle shows the first extension (1.656) and the blue triangle shows the second (1.813). The extension equals the percentage decline divided by the negative height of the prior move (percentage). The 2002 decline was 32.1% and the negative height of the prior move was 17.7%. Thus, 32.1 divided by 17.7 equals 1.813. Put another way, the current decline is 1.813 times the negative height of the prior move. By the way, the negative height is the percentage decline from the high to the low of the prior move.
 Links
Links
Measuring Risk On-Off - Using charts to quantify stock, economic and credit risk.
PPO Trading Strategy - How to use 3 PPOs to develop a trend-reversion trading strategy.
Long-term Trend Indicators - Using the PPO, EMA Slope and CCI to determine the trend.
ETF Master ChartPack - 300+ ETFs organized in a Master ChartList and in individual groups.
Follow me on Twitter @arthurhill - Keep up with my 140 character commentaries.
****************************************
Thanks for tuning in and have a good day!
--Arthur Hill CMT
Plan your Trade and Trade your Plan
*****************************************


