Nasdaq 100 Still Stands Out // Bearish Environment for SPY // Tracking the ProShares Short S&P 500 // Webinar Highlights (Scans!) ////
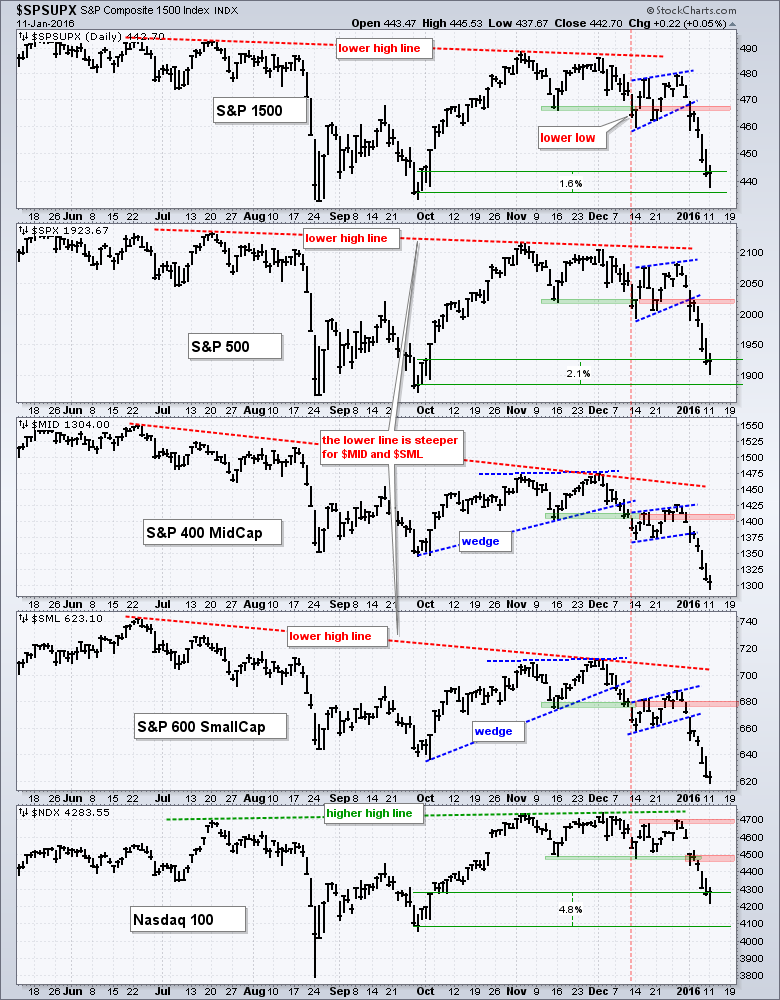
Chartists can get an overview of the "market" by charting the S&P 1500, S&P 500, S&P MidCap 400, S&P Small-Cap 600 and Nasdaq 100 on one chart. Overall, the Nasdaq 100 still stands out as the best performer, while the S&P MidCap 400 and S&P Small-Cap 600 stand out as the worst performers. There are five takeaways from this chart. First, four of the five indices formed lower highs from June-July to November. The Nasdaq 100 was the only one to forge a higher high. Second, the slope of the lower high line is steeper for the S&P MidCap 400 and S&P Small-Cap 600. This means they peaked further below their summer highs and showed relative chart weakness. Third, $MID and $SML formed bearish wedges and led the December breakdown. Fourth, the broken support zones (green) turn into the first resistance zones to watch on an oversold bounce. And finally, the Nasdaq 100 is holding up the best because it is the furthest above its September (closing low). $MID and $SML hit 52-week lows and are by far the weakest. Thus, the Nasdaq 100 is still the strongest of the five because it hit a new high in November and remains the furthest above its September low.
Bearish Environment for SPY
The S&P 500 SPDR (SPY) broke down last week with a close below 200 on January 6th and the daily trend filter turned bearish a day later when the long-term PPO (20,120,1) moved into negative territory. Note that the medium-term PPO (10,60,1) turned bearish on January 5th. With both of these in negative territory, the trend filter on the daily chart is negative and this means the trend bias is down. Traders looking for opportunities can turn to the short-term PPO (5,30,1) and watch for an oversold bounce. The idea is not to play an oversold bounce on the upside, but rather use it to position for further downside. A PPO (5,30,1) move back towards the zero line would indicate that an oversold bounce is underway. On the price chart, broken support turns first resistance in the 200-201 area. This area also marks a 50% retracement of the November to January decline.
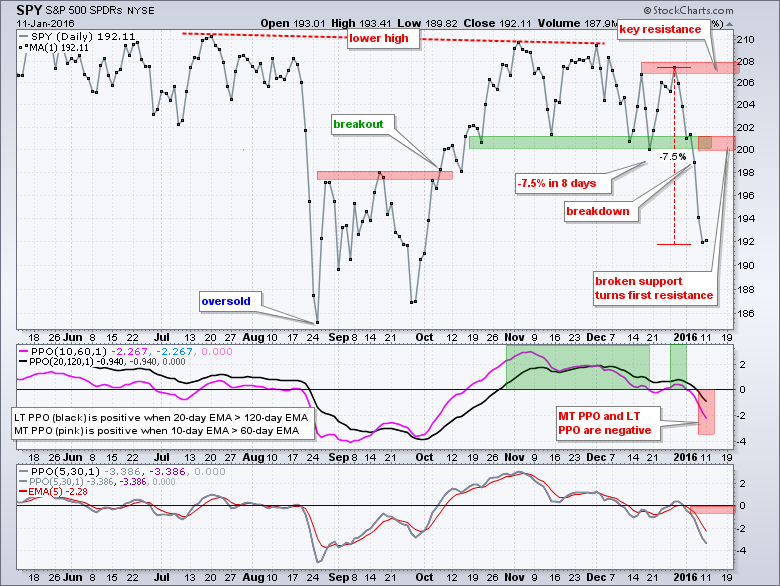
SPY is clearly oversold because CCI(20) moved below -200 and RSI(14) moved below 30 with Friday's close. In addition, SPY fell over 7% in eight trading days. Overbought and oversold conditions, however, are very tricky for trading. Why? Because stocks can become even more oversold in a downtrend or even more overbought in an uptrend. In addition, identifying overbought and oversold conditions is the easy part. Timing an oversold bounce in a downtrend is tricky, very tricky. Just look back to late August and late September for a reminder.
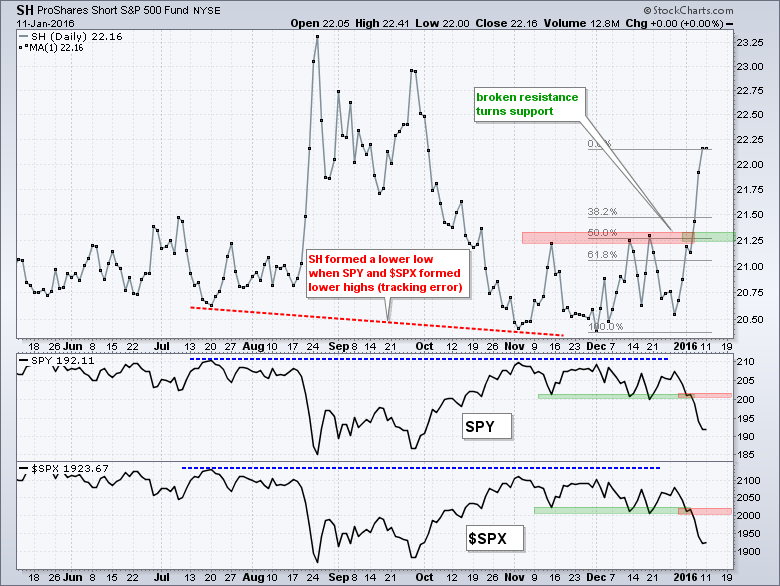
Tracking the ProShares Short S&P 500
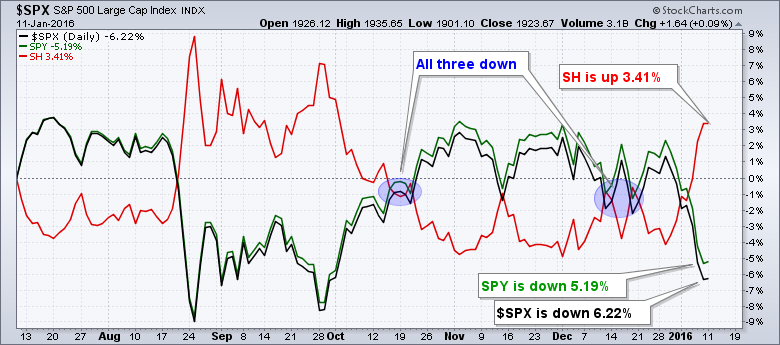
I am not a big fan of inverse and leveraged ETFs, and definitely not a fan of leveraged-inverse ETFs. The tracking errors on these derivative-based products are quite large and they are best suited for nimble short-term players. Of all the inverse ETFs, I think the ProShares Short S&P 500 ETF (SH) has the smallest tracking error and represents the safest way to consider the trading downside. Chartists can see the tracking errors by comparing performance and chart levels. The chart below shows six month performance for the S&P 500 (black), S&P 500 SPDR (green) and ProShares Short S&P 500 ETF (red). Even though SPY is down 5.19% and $SPX is down 6.22%, SH is up less than 4% and not tracking these two step for step. There were even times in December and October when all three were down (blue ovals). Despite these short comings, SH does more inverse to the S&P 500 and will rise should the S&P 500 fall further.
The next chart shows the ProShares Short S&P 500 ETF in the main window with SPY and $SPX in the indicator windows. Notice that SPY and $SPX did not exceed their July highs (closing basis). Given this chart performance and inverse nature, one would expect SH to hold above its July low. It did not and briefly broke below in November. It is a rather small tracking error, but one we should consider when looking at the chart. In fact, I would recommend chartists use SPY or $SPX for chart signals and SH as the trading vehicle. Chartists may consider playing the short side when/if SPY bounces back towards 200 and S&P 500 bounces back towards 2000. This means SH would fall back to the 21.25 area.
Webinar Highlights
In addition to the topics above, I covered the following in the webinar on Tuesday, January 12th. Click here for the recording.
- Risk Indicators: Junk vs Investment, Stocks vs Bonds, RSP vs SPY
- Two ETFs to Define the State of the Market: SPHB vs SPHQ
- Downtrends in Majority of Sectors - XLV Joins
- Consumer Discretionary, Housing and Retail Leading Lower
- A Few Uptrends: RTH, IYR, AGG, SPHD, MUNI and IEF (revised)
- TIP Shows No Inflation and 5-yr Fails at Resistance
- Scanning for Price Ranges, Support Breaks and New Highs-Lows
Links
PPO Trading Strategy - How to use 3 PPOs to develop a trend-reversion trading strategy.
Long-term Trend Indicators - Using the PPO, EMA Slope and CCI to determine the trend.
ETF Master ChartPack - 300+ ETFs organized in a Master ChartList and in individual groups.
Follow me on Twitter @arthurhill - Keep up with my 140 character commentaries.
****************************************
Thanks for tuning in and have a good day!
--Arthur Hill CMT
Plan your Trade and Trade your Plan
*****************************************


