Putting the 3-day Surge into Perspective // The Concept of the Zweig Breadth Thrust // Don’t forget Nasdaq Stocks // A Weight of the Evidence Approach to Breadth Thrusts // Measuring Money Flow Thrusts with AD Volume Percent // Final Confirmation with High-Low Percent // The Bottom Line ////
Putting the 3-day Surge into Perspective
A few readers were wondering if the bounce over the last three days marks an important bottom and the start of a long-term uptrend. For those keeping score at home, the S&P 500 was up 5.34% over the last three days and closed near the high-of-the-day each day. This 3-day Rate-of-Change is the highest since August 28th. Prior to that we have to go back to late 2011 to find a 3-day surge that exceeded 5%. In the third quarter of 2011, the 3-day Rate-of-Change exceeded 5% on August 15th, November 6th and November 30th. As the bottom window in the chart below shows, the 3-day Rate-of-Change also exceeded -5% several times in August-September 2011 and landed near the -5% level another three times in October-November.
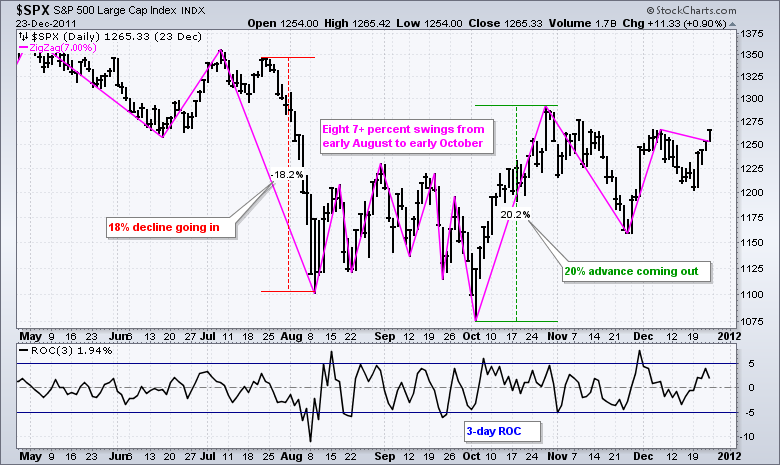
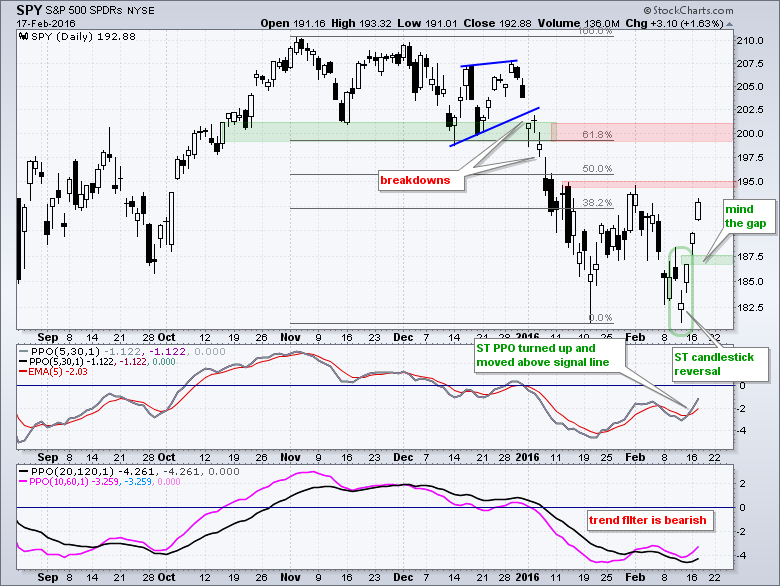
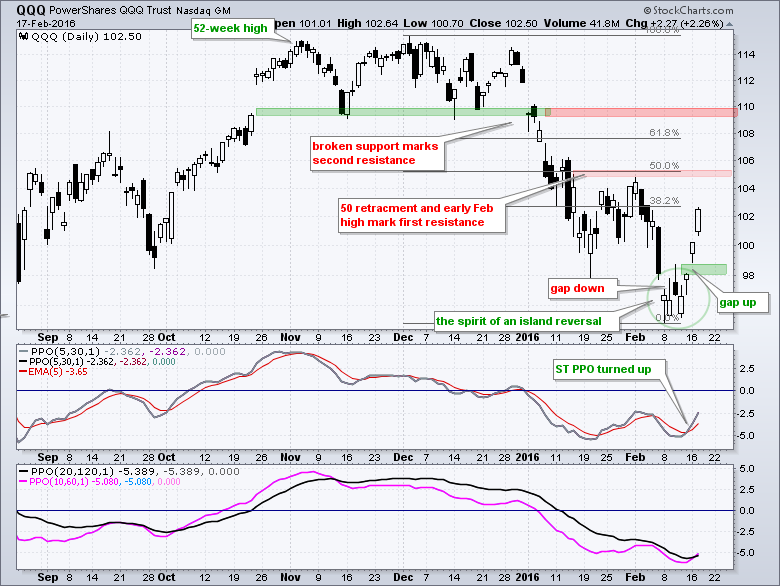
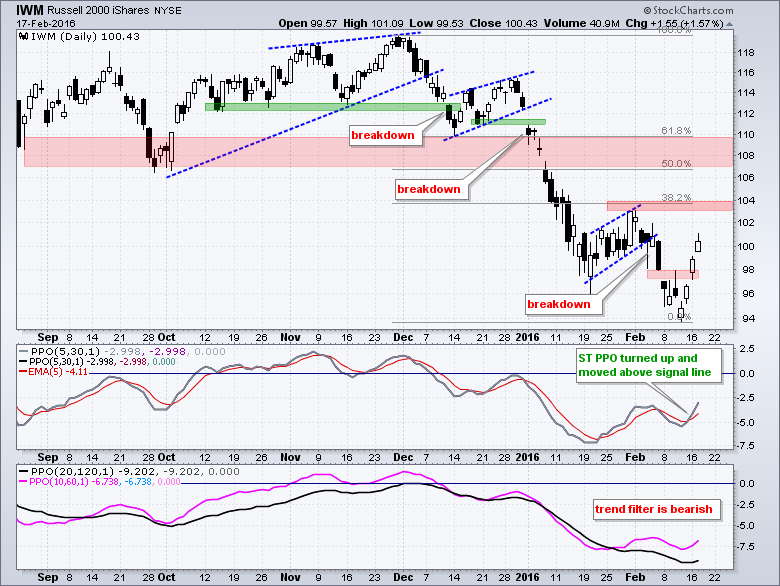
This chart also shows the 7% Zigzag (pink line) to filter out price swings that are less than 7%. Notice that there were ten, yes ten, swings greater than 7% from late July to early October 2011. Excluding the 18% decline going in and the 20% advance coming out, there were eight 7+ percent swings before the trend actually reversed. Yes, trading from August to October 2011 was one big volatile mess. I am not predicting the same right now, but there are two things to note. First, it took the S&P 500 two months to fully stabilize after the 18% decline. Second, the October surge clearly broke resistance and negated the prior breakdown to fully reverse the downtrend. The other 7+ percent moves did not trigger significant breakouts. Short-term candlestick charts for SPY, QQQ and IWM are shown at the end of this commentary.
The Concept behind the Zweig Breadth Thrust
What would it take for me to consider this bounce more than just a bear market rally? I would first turn to the breadth indicators and look for signs of a breadth thrust. A breadth thrust is like a rocket lifting off. An initial power thrust is required to lift the rocket and generate escape velocity. A weak thrust would result in failure because the rocket would not escape the pull of gravity. The same is true for many major stock market reversals. They often start with an exceptionally strong move that triggers a breadth thrust. Absence of a breadth thrust means the bounce is subject to failure.
Greg Morris has written several blog posts and made dozens of breadth indicators available in the StockCharts database. These come from his book, The Complete Guide to Market Breadth Indicators. One of my personal favorites is the Zweig Breadth Thrust (ZBT). Here is Morris' definition:
The Zweig breadth indicator is a 10-day exponential average of the advances divided by the sum of the advances plus the declines. A breadth thrust signal occurs when this indicator goes from under 0.40 to above 0.615 within a 10 day time period or less. The component that is usually overlooked is that it must go from oversold to overbought within 10 days. Once it moves from below 0.4 to above it, the signal occurs when it then moves above 0.615. If it has not done that within 10 days it has to start over from below 0.4. From 1965 to 2014 there have been only 8 Breadth Thrust signals.
The Zweig Breadth Thrust (ZBT) is calculated for the NYSE and the Nasdaq. It can be shown as a normal indicator or in digital format, which means only the signals are registered (+1). The chart below shows the NY Composite with the NYSE ZBT (!BINYBT) and NYSE ZBT Digital (!BINYBTD). Notice that these breadth indicators are based on NYSE stocks and I am showing it with the NY Composite. There is no sense showing this indicator with the S&P 500 because around half the stocks in the S&P 500 are from the Nasdaq.
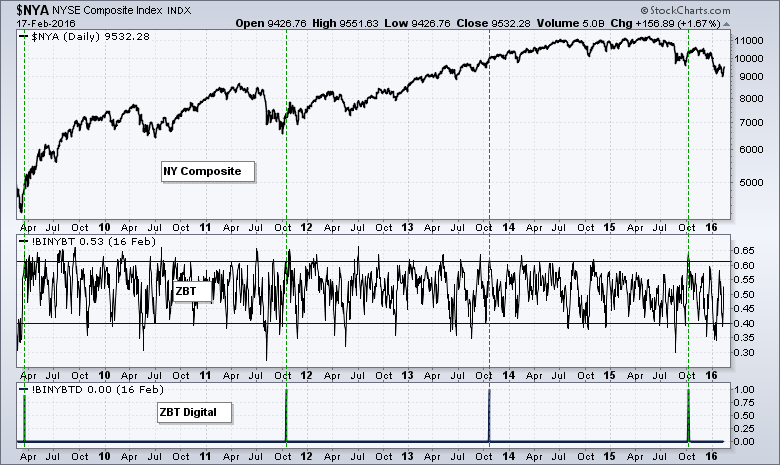
The ninth signal occurred in October 2015. This signal did not work out as the NY Composite ultimately formed a lower high in November and broke support in mid December. The ZBT dipped below .40 last week and surged the last three days. It needs to exceed .615 within the next seven trading days to trigger a bullish breadth thrust signal. There is a Nasdaq version of the ZBT, but it has not triggered a signal since 1984 so I am looking for an alternative. The symbols are !BINABT and !BINABTD.
Don’t forget Nasdaq Stocks
I like the concept behind the ZBT, but I am looking for a breadth indicator that uses both NYSE and Nasdaq stocks, and one that can be compared to a broad index. I think it is of utmost importance that we compare a breadth indicator to the index or group that it represents. For example, it does not make sense to show the AD Line for the NYSE with a chart for the S&P 500. They are completely different animals. The chart below shows the S&P 500 with the 10-day EMA for AD Percent and the 10-day EMA for AD Volume Percent. In general, I consider it bullish when the 10-day EMAs surge above +30% and bearish when they plunge below -30%. Such moves indicate a bullish or bearish breadth thrust that can signal the start of a trend. Ideally, both indicators would trigger signals on the same day. In reality, it is okay if there are a few days separating the signals (not a few weeks though). I would also look for confirmation with a corresponding break on the price chart.
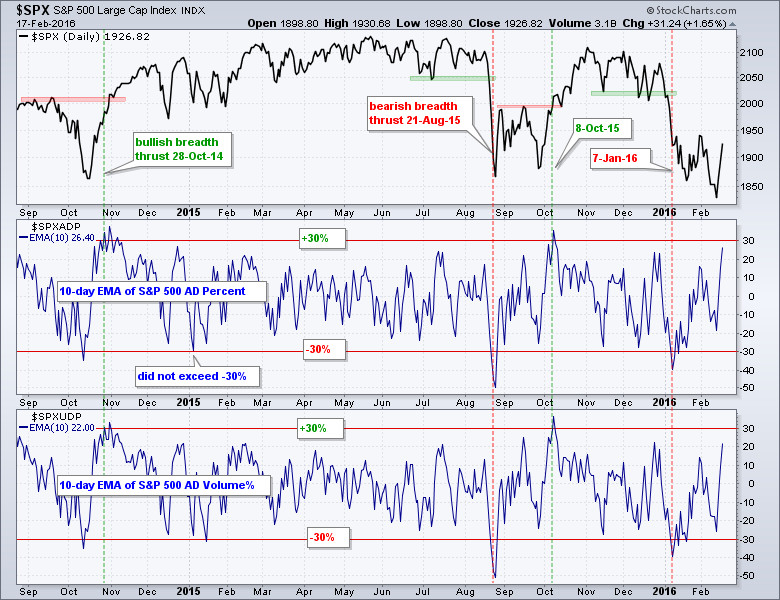
As the chart now stands, the last bearish signal was on January 7th and the indicators have yet to reverse this bearish signal. The 10-day EMAs for AD Percent and AD Volume Percent surged the last three days and it would not take much to push them above +30%. You can plot these indicators for other indices by substituting SPX for MID or another symbol. AD Percent for the S&P MidCap 400 would be $MIDADP and AD Volume Percent for the Technology SPDR would be $XLKUDP.
A Weight of the Evidence Approach to Breadth Thrusts
The next chart shows the 10-day EMA for AD Percent for the S&P 1500, S&P 500, S&P MidCap 400, S&P Small-Cap 600 and Nasdaq 100. Chartists looking for one measure of broad breadth can focus on the S&P 1500 and those using a weight of the evidence can analyze all five. The S&P 1500 is a broad index composed of the S&P 500, S&P MidCap 400 and S&P Small-Cap 600, and it has both Nasdaq and NYSE stocks. As far as I am concerned, it is the perfect index for broad market breadth. Using the same bullish and bearish levels, the 10-day EMA for S&P 1500 AD Percent ($SUPADP) triggered three signals since August (red and green dotted lines). The most recent was bearish on January 7th and it has yet to be countered with a bullish signal.
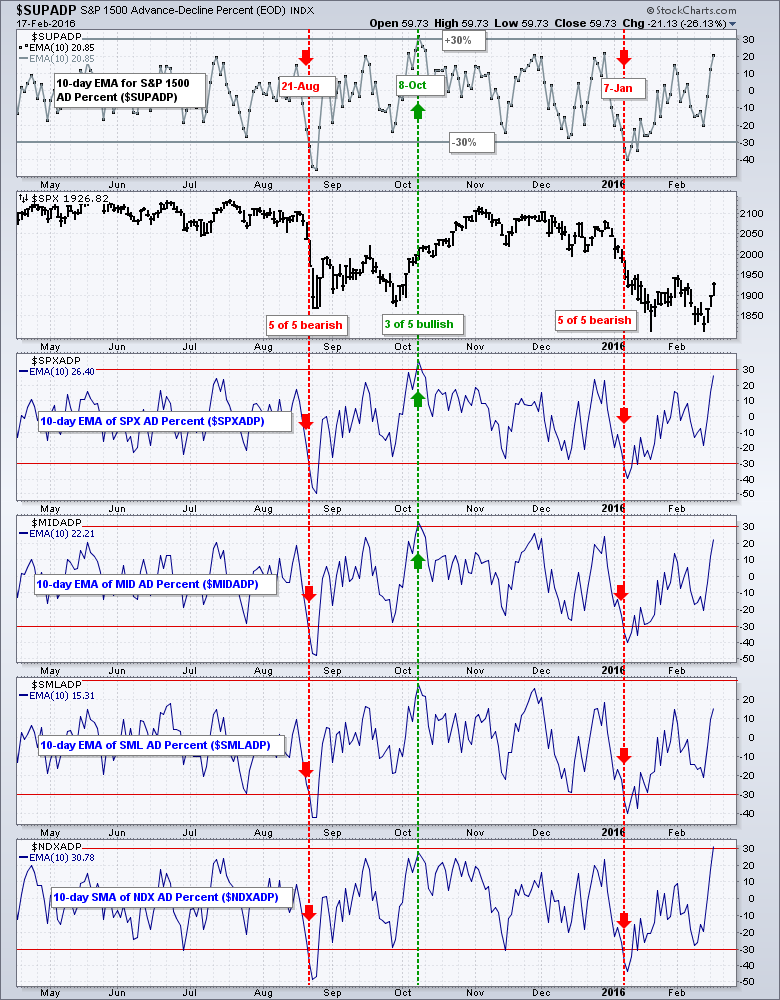
The red and green arrow shows the signals for each index for a weight of the evidence approach. All five turned bearish on August 21st, 3 of 5 turned bullish on October 8th and all five turned bearish on January 7th. These would turn bullish when the majority (3 of 5) exceeds +30%, and not a moment sooner.
Measuring Money Flow Thrusts with AD Volume Percent
Chartist looking to measure positive-negative money flow can analyze AD Volume Percent for the major indices, just as you would with AD Percent. I prefer AD Volume Percent to normal exchange volume because AD Volume Percent reflects the difference between positive money flow (advancing volume) and negative money flow (declining volume). This is what really matters. Total volume, one the other hand, just shows us advancing volume plus declining volume. We need to know which is stronger and AD Volume Percent captures the money flow dynamic.
The chart below shows the 10-day EMA for AD Volume Percent for the same five indices. The red and green dotted lines mark the signals for S&P 1500 AD Volume Percent ($SUPUDP), which is the benchmark. The red and green arrows mark the individual signals at the time. Again +30% and -30% are used for bullish and bearish signals. A clear bearish signal triggered on January 7th when S&P 1500 AD Percent ($SUPADP) moved below -30%. This signal remains in play until there is a move above +30%.
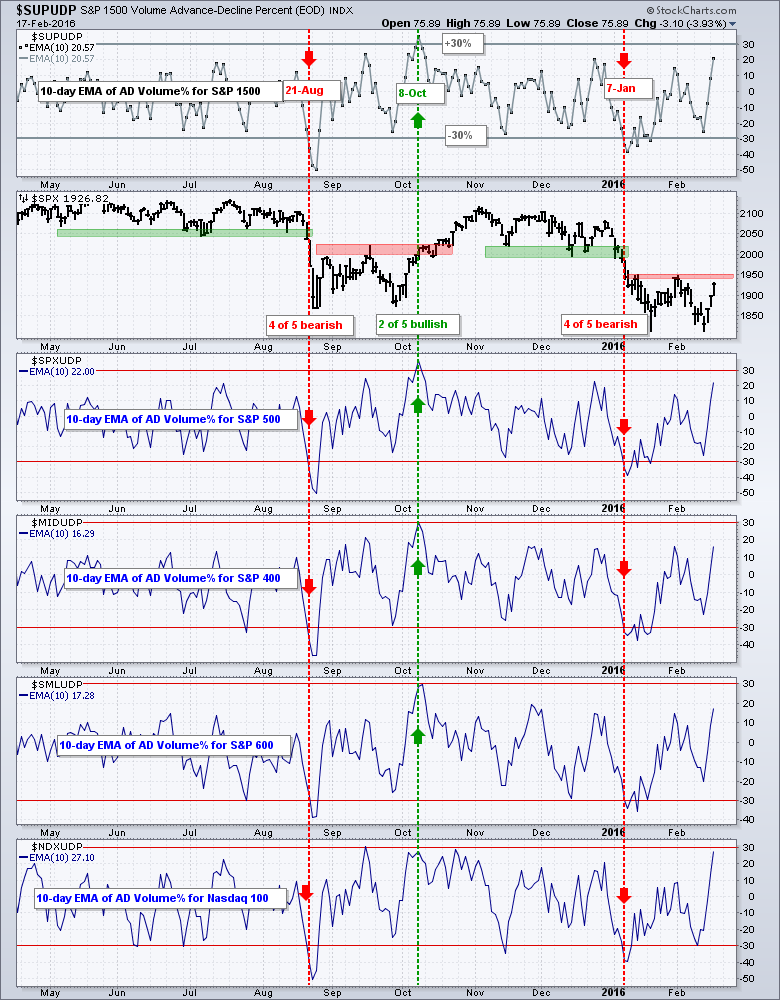
Using a weight of the evidence approach, four of the five money flow indicators moved below -30% on January 7th and this shows very strong selling pressure (the S&P Small-Cap 600 held out for one day). All five surged over the past week with Nasdaq 100 AD Percent ($NDXADP) leading the charge, but we have yet to see moves above +30%. In other words, buying pressure is not strong enough to reverse the prior signal. At least three of the five need to exceed +30% to turn the weight of the evidence bullish.
Final Confirmation with High-Low Percent
High-Low Percent is a breadth indicator that usually lags AD Percent and AD Volume Percent. This makes sense because it takes at least 52-weeks to record an initial new high or an initial new low. Because it lags, we do not need to apply a moving average for smoothing. The key is to set a level that reflects a trend change and limits whipsaws (bad signals). As far as I am concerned, this indicator is in bull mode when High-Low Percent exceeds +10% and remains in bull mode until a move below -10%. The red dotted lines mark the last two bearish signals for S&P 1500 High-Low Percent ($SUPHLP). The indicator re-asserted its bearish signal on January 7th and needs to break +10% to reverse it. This indicator is like final confirmation of a breadth thrust.
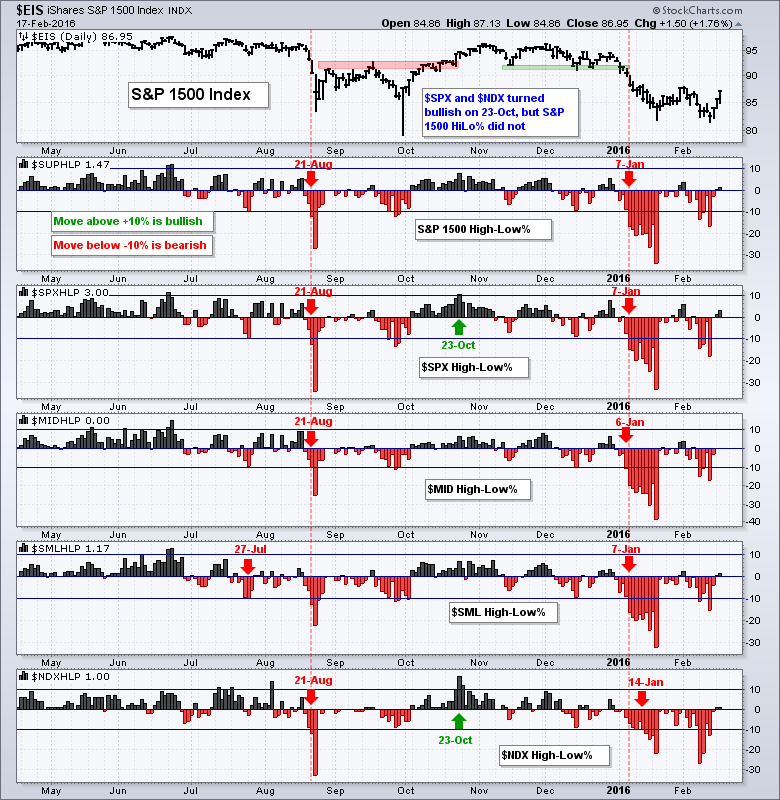
As with the other indicators, we can take a weight of the evidence approach using all five indicators. Notice that Nasdaq 100 HiLo% ($NDXHLP) and S&P 500 HiLo% ($SPXHLP) exceed +10% on October 23rd, but these bullish signals were not confirmed by the other three. The S&P 500 moved back into bear mode on January 7th and the Nasdaq 100 followed a week later. This indicator group is currently bearish, but new lows have dried up over the last three days and we are seeing a few new highs. Many more new highs are needed to turn this indicator group bullish again.
The Bottom Line
We have yet to get one bullish breadth thrust signal or one bullish money flow signal. In addition, the major index ETFs have yet to even break their early February highs and High-Low Percent remains at anemic levels. The 3-day surge is impressive, for three days at least, but it is not enough to reverse the long-term downtrends. The weekly trends are down for SPY, QQQ and IWM, and indicators are all negative. I need a real signal before turning long-term bullish and have yet to get such a signal.
Other Commentary Links
Bear Market Bounces - Understanding Bear Market Patterns, Signals and Retracements.
Measuring Risk On-Risk Off - Using charts to quantify stock, economic and credit risk.
PPO Trading Strategy - How to use 3 PPOs to develop a trend-reversion trading strategy.
Long-term Trend Indicators - Using the PPO, EMA Slope and CCI to determine the trend.
ETF Master ChartPack - 300+ ETFs organized in a Master ChartList and in individual groups.
Follow me on Twitter @arthurhill - Keep up with my 140 character commentaries.
****************************************
Thanks for tuning in and have a good day!
--Arthur Hill CMT
Plan your Trade and Trade your Plan
*****************************************


