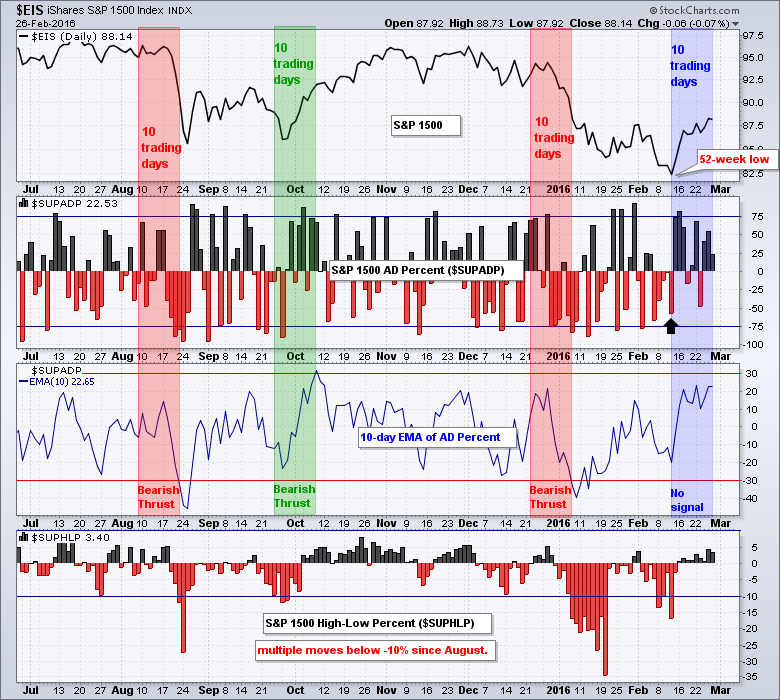
Breadth Thrust Falls Short
We are still in a bear market environment. Breadth remains bearish because we did not get a bullish breadth thrust on Friday and High-Low Percent remains anemic. As the chart below shows, the 10-day EMA for S&P 1500 AD Percent ($SUPADP) did not exceed +30% because positive breadth tailed off the last three days. In a separate, but related note, the Zweig Breadth Thrust also failed to trigger last week. S&P 1500 High-Low Percent ($SUPHLP) has not been above +10% since June 2015 and we have seen multiple dips below -10% since August. The price trends are down because the long-term trend indicators are bearish and the major stock indices sport lower lows and lower highs on their price charts. The S&P 500, S&P MidCap 400, S&P Small-Cap 600 and S&P 1500 did clear their early February highs, but keep in mind that current advance started from 52-week lows.
Setting a Potential Reversal Zone
Assuming we are in a bear market and the long-term trends are down, short-term uptrends are viewed as counter-trend advances and they are expected to fail at some point. However, I do not know exactly when and where. Nobody does. We are all making guesstimates. Ideally, a counter-trend advance would fail (reverse) after it retraces 38.2 to 61.8 percent of the prior decline. IWM has retraced 38.2%, while SPY and QQQ have retraced around 50%. Thus, the long-term trend is down, the short-term trend is up and the big three are trading in a potentail reversal zone. This puts them in no man's land and challenges both bulls and bears.

3 Keys to the Short-term Uptrend
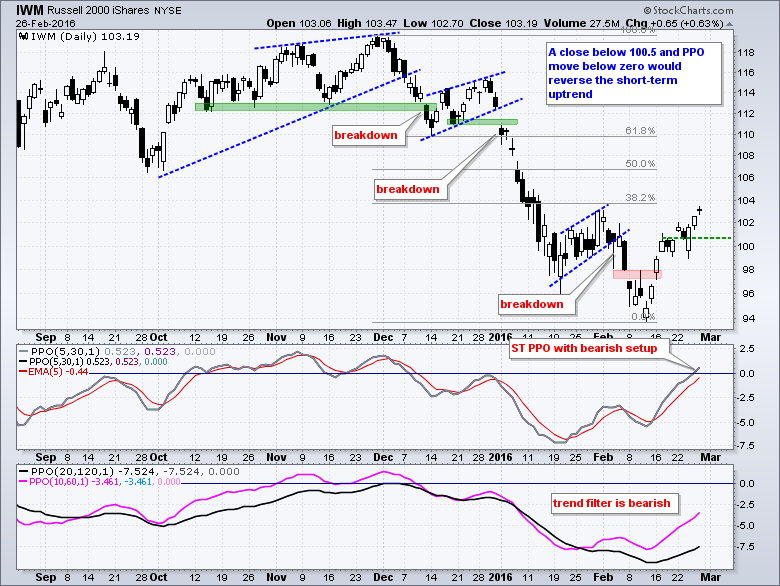
And now for the million Dollar question: At what point does the uptrend reverse and the downtrend continue? I would be a millionaire if I could answer that question correctly on a regular basis. Mean reversion traders are probably going short now because they do not worry about reversals and support breaks. Some of them don't even use stops. Trend traders are waiting for some sort of signal that the short-term trend has actually reversed. Even though the bigger downtrend is the dominant force, this short-term uptrend could extend further because it ain't over until its over. I am looking for three things to suggest that the short-term uptrend has reversed: a close below last week's low, a bearish PPO signal and a bearish breadth signal. The green dotted lines mark the key closing levels to watch on each chart.

Bearish Setup for PPO
The PPO strategy is based on the trend filter and the short-term PPO (5,30,5). The trend filter is bearish when the medium-term PPO (10,60,1) and long-term PPO (20,120,1) are negative. Bearish setups are preferred when the trend filter is bearish. The short-term PPO (5,30,5) generates the setups and signals. A move to the zero area occurs during a short-term bounce or consolidation. This is the setup. A subsequent move below the signal line or below the zero line signals a short-term reversal. Note that the PPO (5,30,5) turns negative when the 5-day EMA moves below the 30-day EMA.
Confirming Short-term Reversals with Breadth
The percentage of stocks above the 20-day EMA forms the last piece of the short-term puzzle for the broader market. Notice that over 80% of stocks in the S&P 500, S&P MidCap 400 and Nasdaq 100 are above their 20-day EMAs. This is both overbought and bullish. Also notice that the indicator first became overbought on February 17th. Thus, it has been near overbought levels for eight trading days. 60% remains my line in the sand. A move below this level in three of the four indicators would signal internal weakness and this would be short-term bearish.

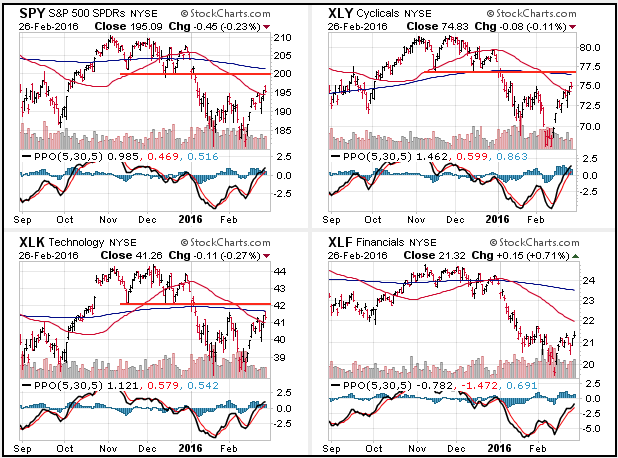
XLK and XLY Tests Falling 200-day
The next images show CandleGlance charts for SPY and the nine sector SPDRs. They are shown with the 50-day SMA (red), 200-day SMA (blue) and short-term PPO (5,30,5). The PPO is above the zero line for eight of the nine sector SPDRs and above its signal line for eight of the nine. XLF has a negative PPO and a signal line cross occurred for XLU. The market turns net bearish when the majority of short-term PPOs are negative and/or below their signal lines. Price-wise, note that SPY, XLY and XLK are near resistance from broken support and their falling 200-day SMAs (blue). XLF is by far the weakest of this group because it is the furthest from its 200-day.
XLE Remains the Weakest
XLI remains one of the strongest sectors in February, but it is now at the falling 200-day SMA. XLB moved above its 50-day, but remains well short of the falling 200-day with a bearish wedge taking shape. Watch support at 40 for a breakdown. XLE is still one of the weakest overall because it did not exceed its late January high. Ditto for XLV.

XLP Forms Outside Reversal
XLP and XLU were hit hard on Friday. I am not sure if this move away from the defensive sector is positive though. XLP formed an outside reversal on Friday. The most important thing to note here is that consumer staples and utilities are part of the stock market and we are in a bear market environment. This makes them susceptible to selling pressure.

Other Commentary Links
Bear Market Bounces - Understanding Bear Market Patterns, Signals and Retracements.
Measuring Risk On-Risk Off - Using charts to quantify stock, economic and credit risk.
PPO Trading Strategy - How to use 3 PPOs to develop a trend-reversion trading strategy.
Long-term Trend Indicators - Using the PPO, EMA Slope and CCI to determine the trend.
ETF Master ChartPack - 300+ ETFs organized in a Master ChartList and in individual groups.
Follow me on Twitter @arthurhill - Keep up with my 140 character commentaries.
****************************************
Thanks for tuning in and have a good day!
--Arthur Hill CMT
Plan your Trade and Trade your Plan
*****************************************


