Major index ETFs Maintain Short-term Uptrends // Small and Mid Caps Show Relative Strength // Sentiment is Quite Bearish // Credit Conditions are Improving (JNK, LQD, TLT) // Keep an Eye on Safe Haven Assets (GLD,FXY,TLT) // Relative Weakness in Finance Sector Remains a Concern ////
Major index ETFs Maintain Short-term Uptrends
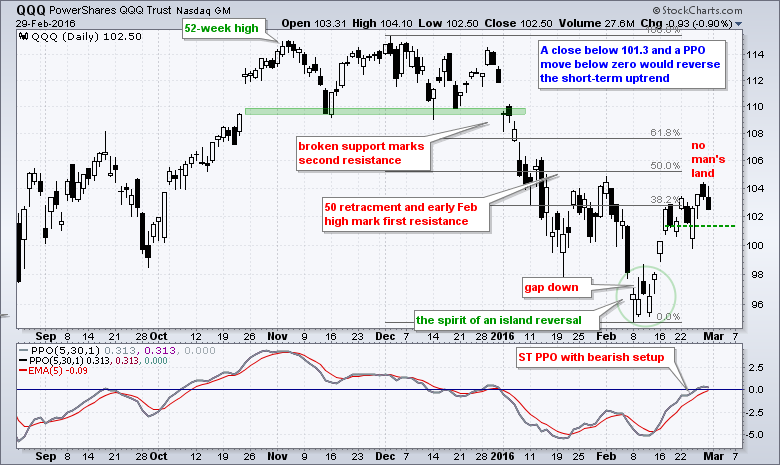
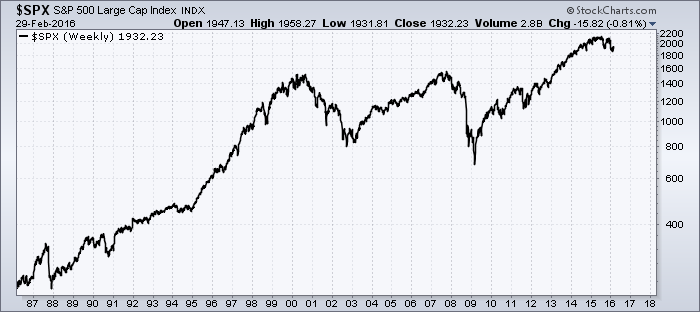
The major index ETFs are still in a tricky area because the long-term trends are down, the short-term trends are up and they have retraced 38.2 to 61.8 percent of the December-February decline. Even though I am working under the assumption that this is a bear market rally, I do not know how far this short-term advance will extend or if it will evolve into a bigger trend reversal. Anything is possible and we need to keep an open mind. I would also go as far as to suggest that the consensus opinion is that this is a bear market rally and it is doomed to fail. Mr. Market does not always play nice and loves to prove the consensus wrong.
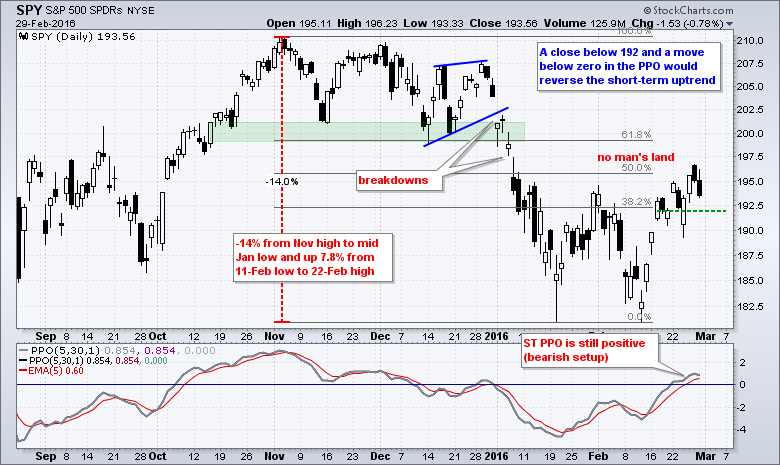
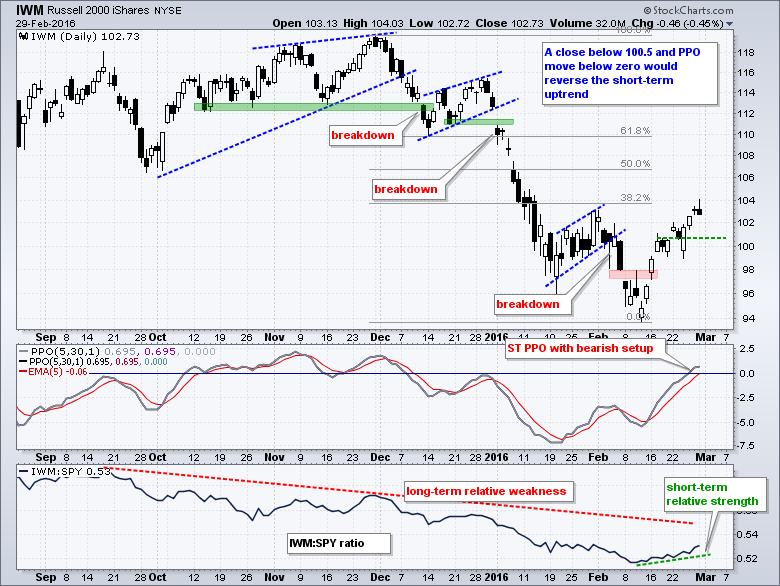
The short-term trends are still up for SPY, QQQ and IWM, and short-term breadth remains strong (%Above 20-day EMA). Even though SPY closed weak on Friday and fell .78% on Monday, the overall trend is still up and the short-term PPO (5,30,5) confirms this. It is above zero and above its signal line. I have marked short-term support for all three ETFs with a green dashed line. A close below these levels in all three and PPO moves into negative territory would reverse the short-term uptrends. Until such signals, the short-term trends are up and I will at least respect these uptrends. Who am I to argue with the evidence!
Small-caps and Mid-caps Show Relative Strength
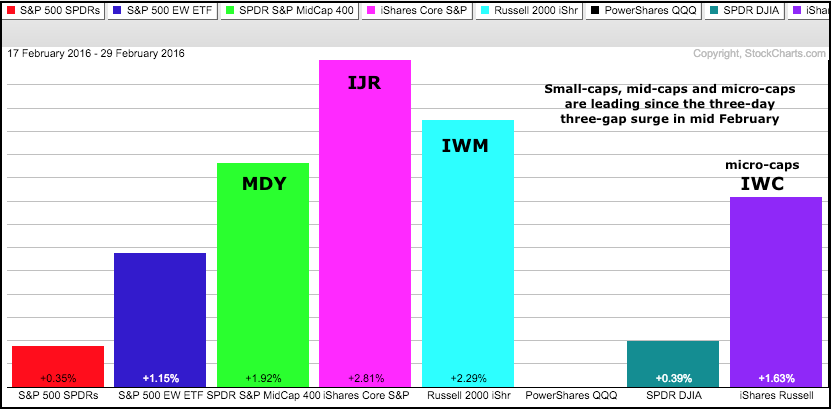
Even though IWM has the shallowest retracement (38.2%), it is the strongest of the big three over the last nine trading days. In fact, small-caps and mid-caps are leading over the last nine days. I picked nine days because this captures price action after the initial three day surge and the three big gaps (February 12, 16 and 17). This relative strength shows a little risk-on mentality in the market right now and it is positive as long as it lasts.
Sentiment is Quite Bearish
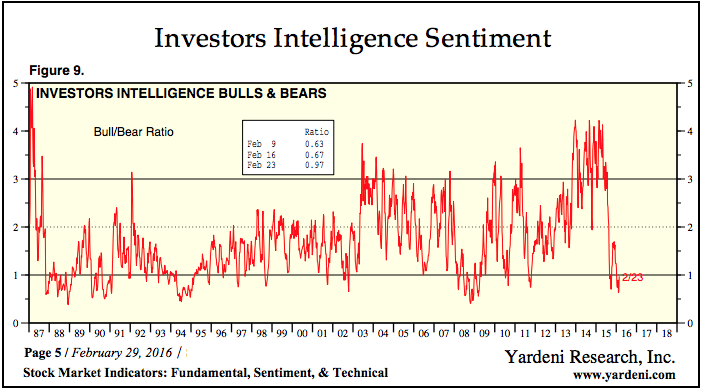
I don't use sentiment indicators that much because they can reach extremes and remain near extremes in strong trends. I prefer breadth, trend and risk indicators to identify significant market shifts. Having said that, note that the Investors Intelligence Bull-Bear Ratio is at levels (<1) that marked important lows in 2010 and 2011, as well as the recent lows January and February this year. There sure are a lot of bears out there, and my long-term indicators are also net bearish.
Credit Conditions are Improving
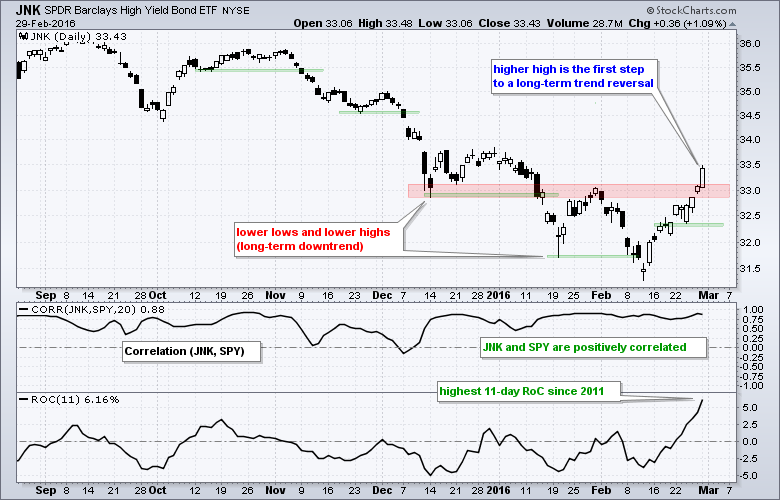
Chartists can measure credit conditions by looking at the High Yield Bond SPDR (JNK) and the Investment Grade Bond ETF (LQD). Obviously, JNK is more sensitive than LQD to tightening credit. Don't look now, but JNK is up ten of the last eleven days and just exceeded its late January high. The 11-day Rate-of-Change is also the highest since 2011 and the ETF is less than 1% below its yearend close, which means it is close to turning positive year-to-date. This bounce shows an easing in the credit markets and this is helping the stock market.
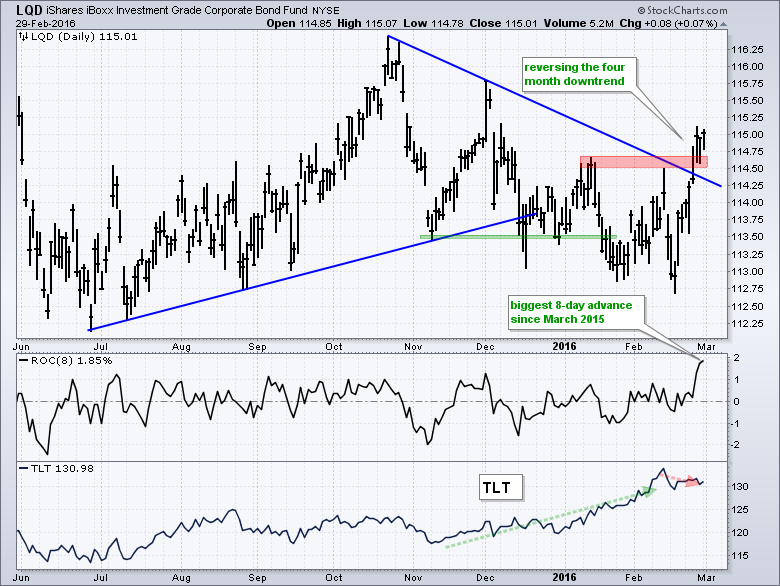
The Investment Grade Bond ETF (LQD) is also perking up with its biggest 8-day advance since March 2015. Notice that the ETF broke above the January-February highs and is now positive year-to-date. Investment grade bonds are obviously safer than junk bonds, but they are riskier than Treasuries. Notice that LQD fell as the 20+ YR T-Bond ETF (TLT) advanced from November to mid February (risk off). More recently, LQD is up since February 11th and TLT is down (risk on). This divergence suggests a strong risk appetite in the credit markets right now.
Treasuries, Gold and the Yen
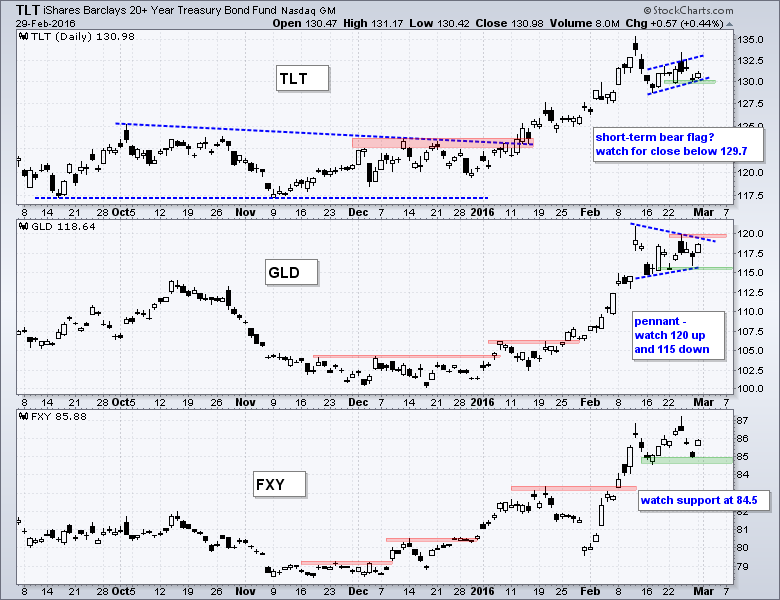
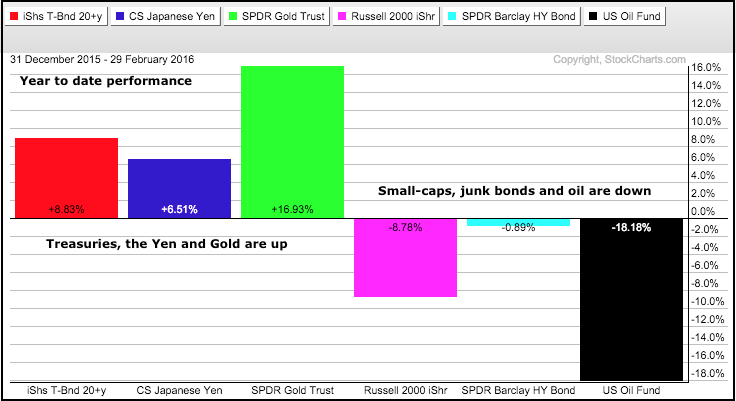
The 20+ YR T-Bond ETF (TLT), the Gold SPDR (GLD) and the Yen ETF (FXY) have been the big beneficiaries of the risk-off trade this year. TLT is up 8.83% year-to-date, FXY is up 6.51% and GLD is up 16.93%. The advance in all three slowed as the stock market bounced, oil firmed and junk bonds bounced, but these three risk-off assets have not broken down yet. While not necessarily a prerequisite, I think we need to see breakdowns here before the stock market rally gets some real legs. I will be watching TLT especially because a breakdown in Treasuries would show money moving out of a safe-haven asset and this could benefit riskier assets.
Relative Weakness in Finance Sector Remains a Concern
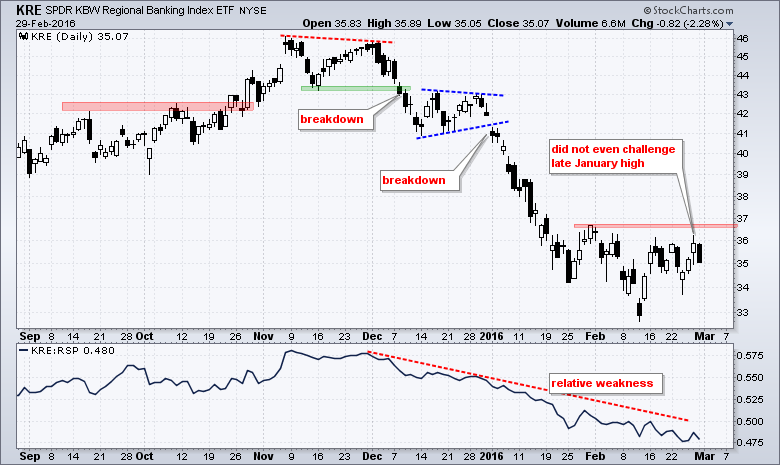
The finance sector and banking industry remain two of the weakest areas in the stock market. As John Murphy pointed out in Thursday's Market Message, falling Treasury yields are one of the mail culprits. Note that Treasury yields and Treasury bonds move in opposite directions. The yield rises as the bond prices fall, and the yield falls as the bond prices rise. This means a breakdown in TLT would signal an upturn in the 10-yr yield and this would be positive for banks.
The chart below shows the Regional Bank SPDR (black line), the 10-year Treasury Yield (pink line) as well as two Correlation Coefficients (KRE/10-yr Yield and KRE/Yield-Curve). First notice that KRE and the 10-yr Yield rise and fall together. This positive correlation is confirmed by the Correlation Coefficient (KRE, $UST10Y) because it is positive for the most part. The Correlation between KRE and the Yield Curve (10YR - 2YR) is also mostly positive, but the positive correlation is not quite as strong.
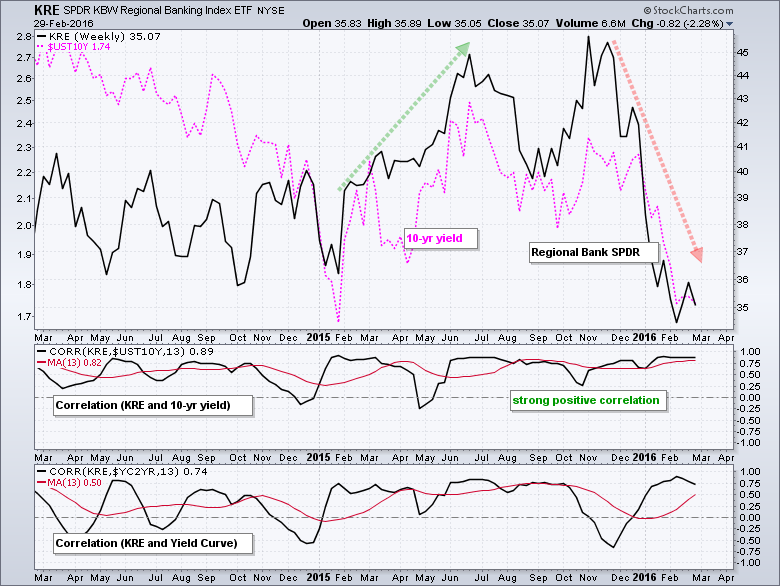
On the price chart, KRE did not even challenge its late January high and the price relative hit a new low in late February (relative weakness). This ETF is not going anywhere unless the 20+ YR T-Bond ETF (TLT) breaks down and the 10-yr Yield turns up. Keep a watch because the employment report is Friday and this means we could get a big move in Treasuries.
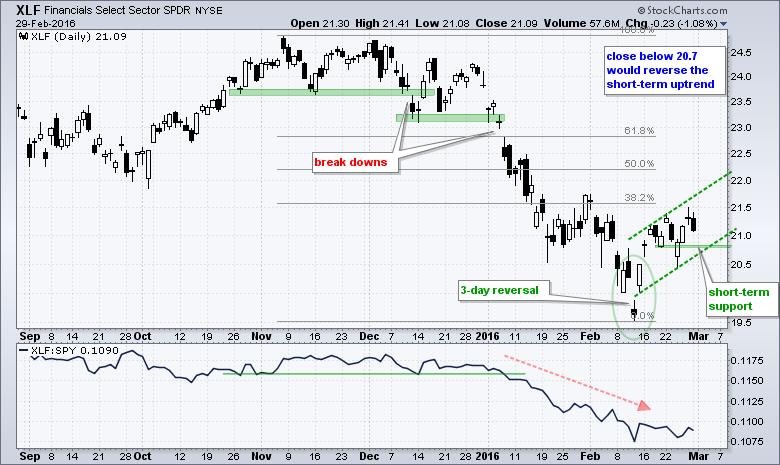
The Finance SPDR (XLF) is not keeping pace with the broader market, but the short-term trend is up right now. I am marking support at 20.78 and will call for a trend reversal on a close below 20.70.
Other Commentary Links
Bear Market Bounces - Understanding Bear Market Patterns, Signals and Retracements.
Measuring Risk On-Risk Off - Using charts to quantify stock, economic and credit risk.
PPO Trading Strategy - How to use 3 PPOs to develop a trend-reversion trading strategy.
Long-term Trend Indicators - Using the PPO, EMA Slope and CCI to determine the trend.
ETF Master ChartPack - 300+ ETFs organized in a Master ChartList and in individual groups.
Follow me on Twitter @arthurhill - Keep up with my 140 character commentaries.
****************************************
Thanks for tuning in and have a good day!
--Arthur Hill CMT
Plan your Trade and Trade your Plan
*****************************************


