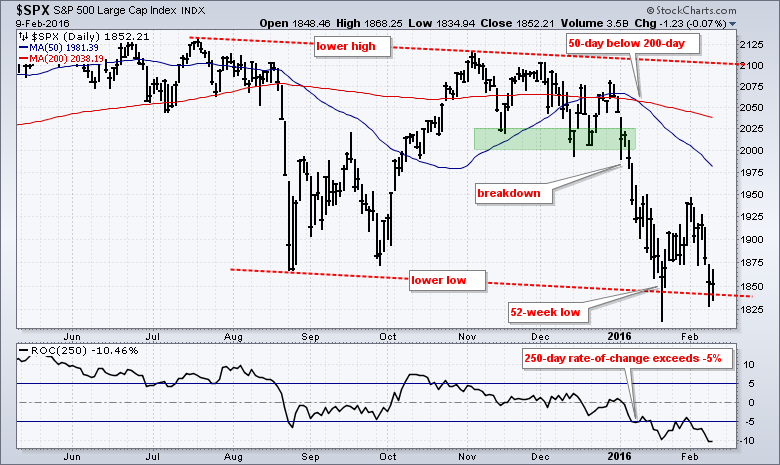
Before looking at the short-term situation for SPY, QQQ and IWM, let's review the bigger trends using the S&P 500 and Russell 2000. Some things are open for debate in the stock market, but I don't think there is much debate on the long-term trends. They are down by most metrics. The S&P 500 formed a lower high in early November and broke the 2000-2025 support zone on January 6th for the first bearish signal of the year. The 200-day SMA (red) turned down in late December, the 50-day SMA (blue) crossed below the 200-day SMA on January 11th and the index recorded a 52-week (closing) low on January 20th. Just looking at the chart, we can see that prices moved from the upper left to the lower right and the general trend is down.
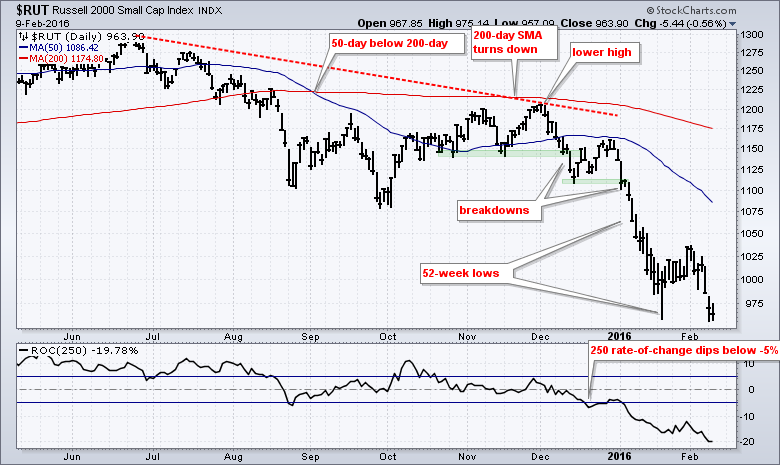
The downtrend is more mature and more prevalent for the Russell 2000. In addition to the usual trend indicators, notice that the 250-day Rate-of-Change exceeded -5% in mid-December. This metric shows when long-term investors are feeling pain. This one year Rate-of-Change metric is currently near -20% and at its lowest level since 2009.
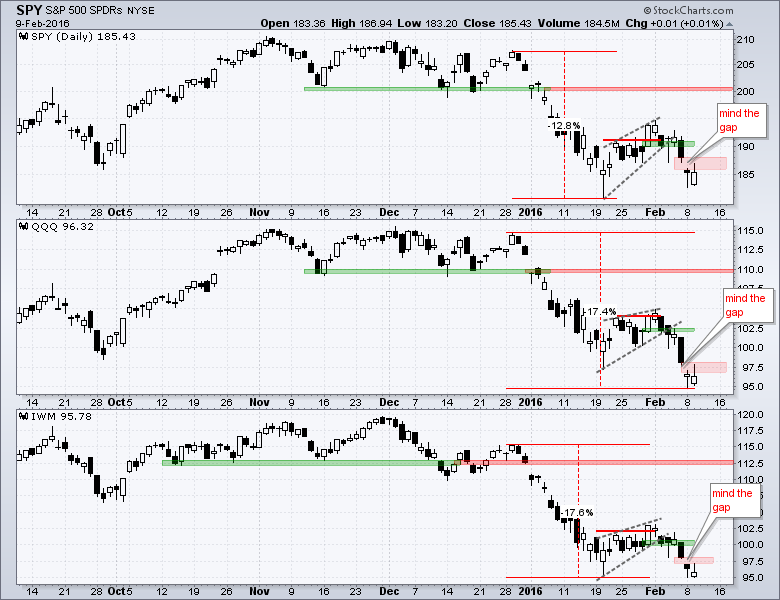
The stock market seems ripe for a bounce, but when and how far is debatable. The overall trend, however, is not really open for debate and this downtrend remains the dominant force. Even so, let's look at what it might take to produce an oversold bounce or a negation of the recent wedge breaks. SPY became oversold after a 10+ percent decline from late December to mid-January. The first bounced failed to hold as the ETF fell back to the 185 area for a test of the mid-January low. Trading was quite indecisive over the last two days as the ETF formed a hammer on Monday and closed in the middle of its range on Tuesday. Short-term, I will be watching the Monday morning gaps in SPY, QQQ and IWM. The bulls are snorting, but they show some serious resolve by filling these gaps. A move back above Friday's close would fill these gaps and be short-term bullish. Keep in mind that the long-term trends are still down and these bearish forces could pull trump at any time. Also note that Fed Chair Janet Yellen is testifying before congress and this could add a little extra volatility to the mix.
Other Commentary Links
Bear Market Bounces - Understanding Bear Market Patterns, Signals and Retracements.
Measuring Risk On-Risk Off - Using charts to quantify stock, economic and credit risk.
PPO Trading Strategy - How to use 3 PPOs to develop a trend-reversion trading strategy.
Long-term Trend Indicators - Using the PPO, EMA Slope and CCI to determine the trend.
ETF Master ChartPack - 300+ ETFs organized in a Master ChartList and in individual groups.
Follow me on Twitter @arthurhill - Keep up with my 140 character commentaries.
****************************************
Thanks for tuning in and have a good day!
--Arthur Hill CMT
Plan your Trade and Trade your Plan
*****************************************


