Trend Trumps All Else // Forget about Support Levels in a Downtrend // Oversold Can Become Even More Oversold // Elevator Down Stairs Higher // Few Places to Hide // Correlations Rise in a Bear Market // Cash is a Real Position // A Penny Saved is Worth more Than a Penny Earned ////
Stocks are getting slammed again and extending their current downtrends. There will be a counter-trend bounce at some point, but timing that bounce is a huge challenge. There will also be a bull market again, but that is for another day. The bear market is acting like a bear market so today I am going to share some thoughts on bear markets and downtrends. We will cover the trump trend, the support fallacy, oversold conditions, elevators, correlations and cash.
Trend Trumps All Else
As far as I am concerned, the prevailing trend is the single most important indicator. Sentiment, seasonality, overbought-oversold conditions, candlesticks, price patterns, breadth, relative performance and volume are all secondary to the underlying trend of a specific index, ETF or stock. I am not going to consider a long position when sentiment is bullish and the trend is bearish. Similarly, bullish seasonality is interesting, but a downtrend will quickly trump a seasonal pattern. The same goes for relative performance. I am not interested in relative strength when the trend on the price chart is down.
Overbought-oversold conditions, candlesticks and patterns are a little different because we can use the trend to filter out weak setups. In other words, I am not interested in bullish chart patterns or candlesticks when the overall trend is down. I am, however, interested in bearish chart patterns, neutral chart patterns and bearish candlesticks. Bearish patterns include rising flags or wedges and descending triangles. Neutral patterns are flag consolidations such as pennants, triangles and rectangles. In a similar vein, I am interested in short-term oversold conditions when the bigger trend is up and short-term overbought conditions when the bigger trend is down.
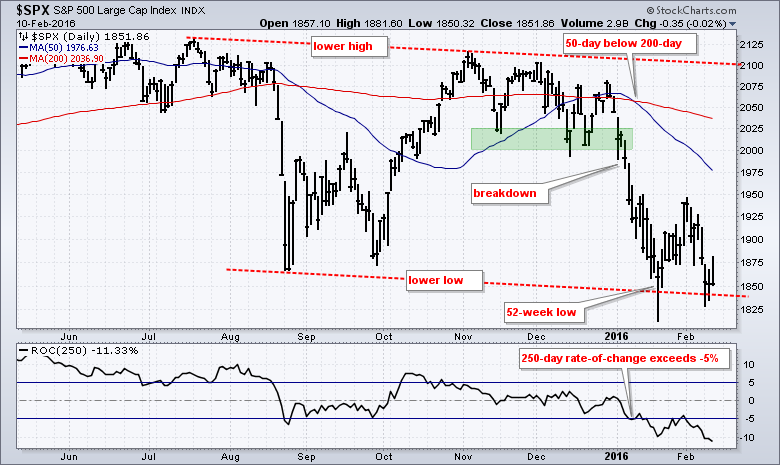
Forget about Support Levels in a Downtrend
As noted many times this year, the concept of support is not compatible with the existence of a downtrend. By definition, a downtrend implies lower lows and lower highs. As such, a prior low is not expected to offer support and not expected to hold. There is no need to show a chart on this one because all we need to know is the trend.
Oversold Can Become Even More Oversold
How many times have we heard this one? Oversold conditions are actually the norm in a downtrend and occur much more often than overbought conditions. It takes strong selling pressure to become oversold and this is in and of itself bearish. Oversold just means we might get a bounce, but the odds are less than 50% when the bigger trend is down.
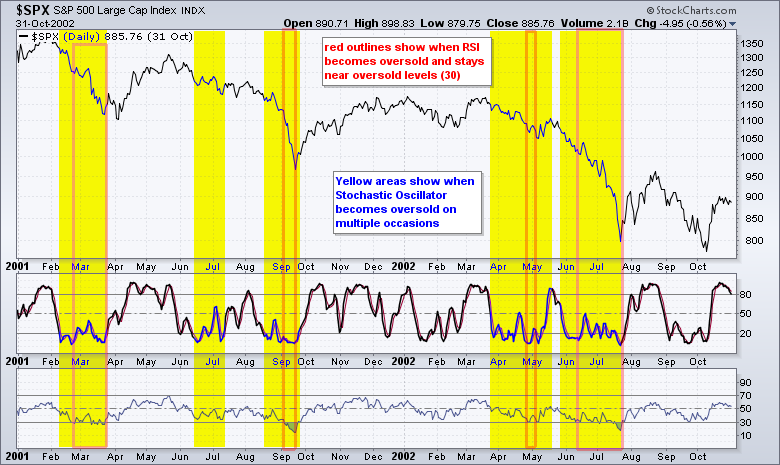
Keep in mind that it is also incredibly difficult to quantify overbought and oversold conditions. Technically, a security is considered oversold when the Stochastic Oscillator moves below 20, the Commodity Channel Index (CCI) moves below -100, RSI moves below 30, price exceeds the lower Bollinger Band and the Rate-of-Change hits an extreme level. These oversold readings, however, do not always occur simultaneously. For example, the Stochastic Oscillator may be oversold, but RSI could still be above 30. Which indicator are we to believe? You know my answer: the trend.
The chart below shows the S&P 500 from 2001 to 2002 with the Stochastic Oscillator and RSI. Notice that the Stochastic Oscillator moved below 20 dozens of times during this bear market. There were also several moves above 80, but these were fewer and further between. The red outlines show when RSI moved to 30 or below to become oversold. The first move to 30 did not mark the bottom as the decline usually extended and RSI remained near oversold levels.
Elevator Down and Stairs Higher
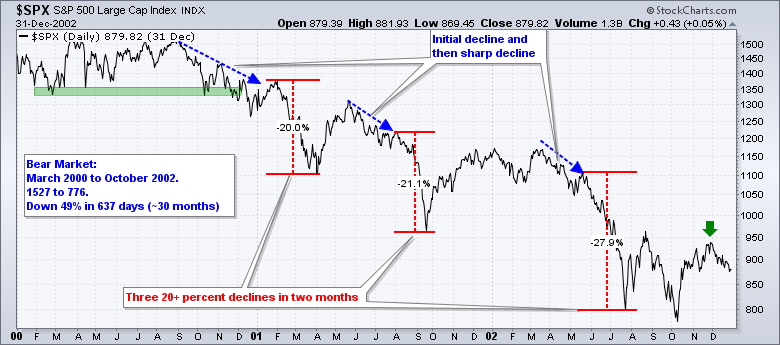
Markets tend to fall a lot faster than they rise. Gold may be the notable exception recently, but equity markets are famous for sharp declines and grinding advances. Just have a look at the last two bear markets. Also notice that there were some nice bounces during these bear markets and a lot of choppy trading. In short, trading your way through a bear market is difficult, very difficult. From June 2008 to March 2009, the S&P 500 fell at least 15% on four separate occasions. Notice that three of these exceeded 25% and took just one to two months.

During the bear market in 2001 and 2002, the S&P 500 fell 20% on three separate occasions. Notice that these 20% declines did not start from a peak. Instead, the S&P 500 started falling and selling pressure snowballed to create a free fall of sorts. This is the kind of stuff that happens in bear markets.
Few Places to Hide
The vast majority of stocks follow the broad indices. There are lots of estimates out there, but the most common is that 80% of stocks decline when the broad market indices decline. As of February 10th, the S&P 500 was down around 9.4% year-to-date and 83.6% of the stocks in the S&P 1500 were DOWN year-to-date (1254 out of 1500). The S&P 1500 includes the S&P 500, the S&P MidCap 400 and the S&P Small-Cap 600. This means just 16.4% were up. It is very hard to pick long positions when 80% of the market is moving lower. As far as I am concerned, it is better to be in cash than trying to pick long positions in a bear market.
Correlations Rise in a Bear Market
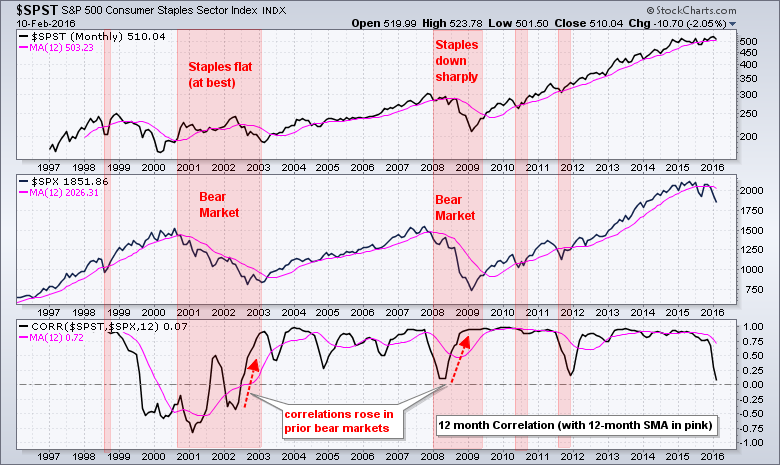
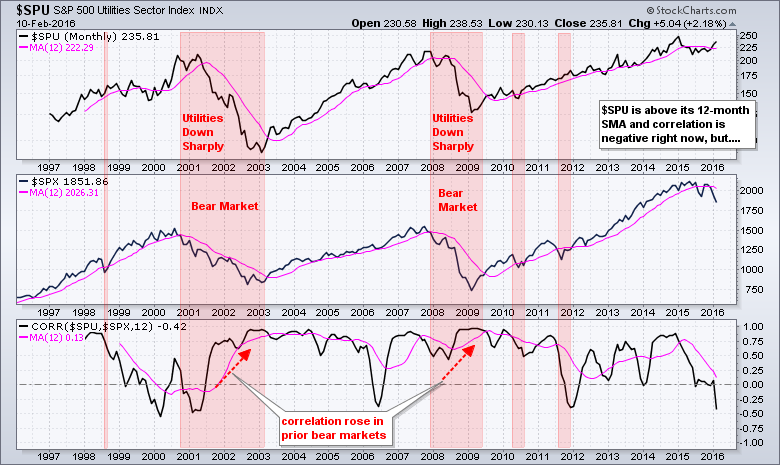
A stock is a stock is a stock is a stock. I think Rubio said that. Defensive stocks like consumer staples and utilities may seem like a good idea during a bear market, but these sectors are still made up of stocks. The chart below shows monthly line charts for the Consumer Staples Sector ($SPST) and the S&P 500 with the 12-month moving average in pink. The 12-month Correlation Coefficient ($SPX, $SPST) is in the bottom window with the 12-month SMA. The red shading marks when the S&P 500 moved below its 12-month SMA and the two bear markets are labeled. Staples were flat at best in the 2001-2002 bear market and down sharply in the 2008-2009 bear market. $SPST is just above its 12-month SMA now and the Correlation Coefficient is near the zero line. The sector is holding up now and correlation is low, but don't be surprised if correlation rises, just as it did in 2002 and 2008 (red arrows). Keep a close eye on the trend for the S&P Consumer Staples Sector.
The second chart shows the S&P Utilities Sector ($SPU) with the same settings. Notice that $SPU held out in 2001 and 2008 because it broke down a few months after the S&P 500. Nevertheless, the sector did breakdown and the Correlation Coefficient moved higher during these bear markets. $SPU is currently above its 12-month SMA and the Correlation Coefficient is negative, but I would be very careful with this sector now that we are in a bear market.
Cash is a Real Position
Plan your trade and trade your plan. Alternatively, plan your investment and invest according to your plan. I cannot stress this enough. We need to have a plan in place BEFORE taking a position, not afterwards. Emotions increase the moment money enters into the equation and emotional decisions are usually not the best decisions. Also note that the bigger the position, the higher the emotions. Your position is too large if you cannot sleep at night. This is why it is important to have a diversified portfolio with relatively small positions. It is much easier to take a loss on a small position than on a large position.
Having said that, we need to understand that cash is part of the plan. How much is the question. There are no set formulas, but I look to raise cash as the broad market weakens and put money to work as the broad market strengthens. Yes, I am a good old fashion trend follower. There is nothing wrong with holding a large amount of cash during a bear market. We can put some of our funds to work in non-stock alternatives, but there are sometimes not that many choices because downtrends are pervasive and solid setups are few.
Cash reduces risk and increases risk-adjusted returns. Raising cash during a broad market downtrend reduces exposure to the stock market and this reduces risk. This means we should not be afraid to build up a cash position as stops are hit and new setups fail to materialize. As far as I am concerned, it is better to be in cash than a defensive stock that is trading sideways.
In a bear market, a penny saved is worth more than a penny earned. Here are some mathematical thoughts on keeping the powder dry for a broad market uptrend or the right setup. First, it takes a 100% advance to recover from a 50% decline. This is an extreme example, but it just means the bigger the loss, the bigger the subsequent gain needed to recover that loss.
Taking a stop-loss means we will have more ammunition when the trend returns to our favor. Let's compare two portfolios that track the S&P 500: a buy-and-hold portfolio and a timing portfolio. The S&P 500 starts at 2000 (hypothetically) and falls 15% to trigger a sell signal. Both the buy-and-hold portfolio and the timing portfolio are now down 15% ($100,000 to $85,000). The buy-and-hold portfolio remains invested and exposed to the market (increased risk). The timing portfolio exits its positions on the sell signal and moves to cash (less risk).
The S&P 500 falls a further 30% and the buy-and-hold portfolio loses $25,000, which puts its down 40% overall ($60,000). The timing portfolio remains flat at $85,000 because it is in cash. The S&P 500 then advances 20% from the low and triggers a buy signal. The buy-and-hold portfolio rises $12,000 on the bounce and its value hits $72,000. It is now down 28% from its starting point. The timing portfolio enters the market with $85,000 and is still down 15% from its starting point.
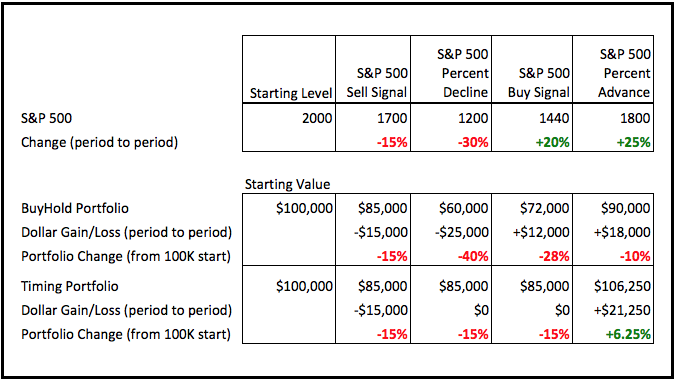
You can see what happens next. If the market advances further, the timing portfolio is starting from a higher balance (85K vs 72K) and can benefit more from the advance. A subsequent 25% advance in the S&P 500 would put it back to 1800 and the index would still be below it starting point. The buy-and-hold portfolio would gain $18,000, but still be in the red overall (-10%). The timing portfolio would gain $21,250 and already be back above its starting point (+6.25%). This is why a penny saved in a bear market is worth more than a penny earned.
Feel free to send comments or suggests using the link at the very bottom.
Other Commentary Links
Bear Market Bounces - Understanding Bear Market Patterns, Signals and Retracements.
Measuring Risk On-Risk Off - Using charts to quantify stock, economic and credit risk.
PPO Trading Strategy - How to use 3 PPOs to develop a trend-reversion trading strategy.
Long-term Trend Indicators - Using the PPO, EMA Slope and CCI to determine the trend.
ETF Master ChartPack - 300+ ETFs organized in a Master ChartList and in individual groups.
Follow me on Twitter @arthurhill - Keep up with my 140 character commentaries.
****************************************
Thanks for tuning in and have a good day!
--Arthur Hill CMT
Plan your Trade and Trade your Plan
*****************************************


