Trend is Not Everything, it's... // Those Pesky Hammers // New Lows in Key Sectors // Even Healthcare is not Healthy // Long-term Laggards Become Short-term Leaders // Staples Start Feeling the Heat ////
Trend is Not Everything, it's...
If Vince Lombardi were a trend follower, he would probably say: "trend is not everything, it's the only thing". QQQ, SPY and IWM keep giving the bulls hope with intraday reversals and hammer candlesticks. First and foremost, the big trends are down for the big three (SPY, QQQ, IWM) and these downtrends are the dominant forces at work. We will get a counter-trend rally at some point, but playing such a bounce is a challenge (cue Brick Heck to lower head and whisper "challenge"). Before we look at these hammers, I will show a close only chart so we can see the current trend at work. QQQ and IWM hit 52-week closing lows on Monday, while SPY closed 22 cents above its 25-Aug low. If you will recall, 25-Aug witnessed a massive spike low and it was a very volatile day for ETFs. The S&P 500 recorded a 52-week low in mid January and again on Monday. 52-week lows occur in downtrends so it is safe to say that the long-term trends are down for the broad market ETFs.
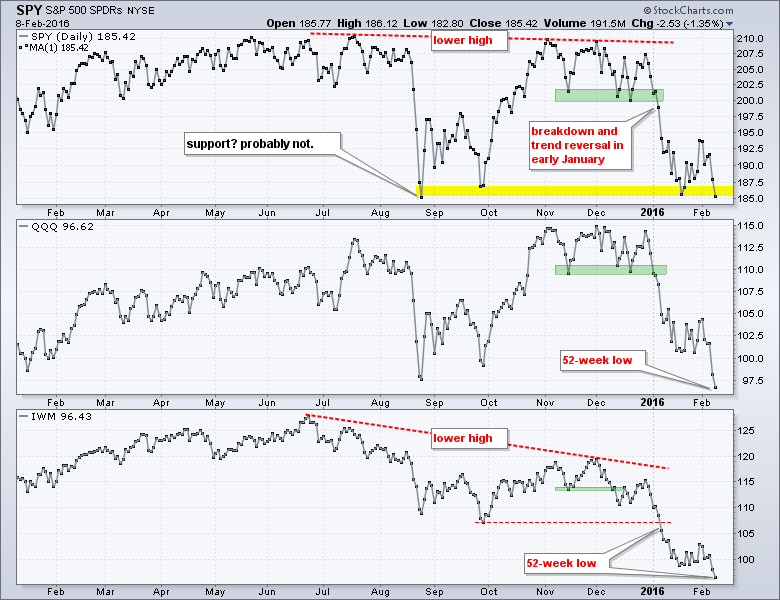
Looking at the SPY line chart, I could draw support in the 185-187 area, but I prefer to refrain from marking support levels in a downtrend. I am working under the Dow Theory assumption that we cannot determine the length or the duration of a trend. In other works, a trend in motion stays in motion and this means new lows are expected in a downtrend. Put another way, the prior lows are not expected to hold. In addition, note that the S&P 500 is already at a new low. So who are we going to believe: SPY or $SPX? Let's make it easy and just watch the trend. The trend reversed with the lower high in November and the breakdown in early January.
Those Pesky Hammers
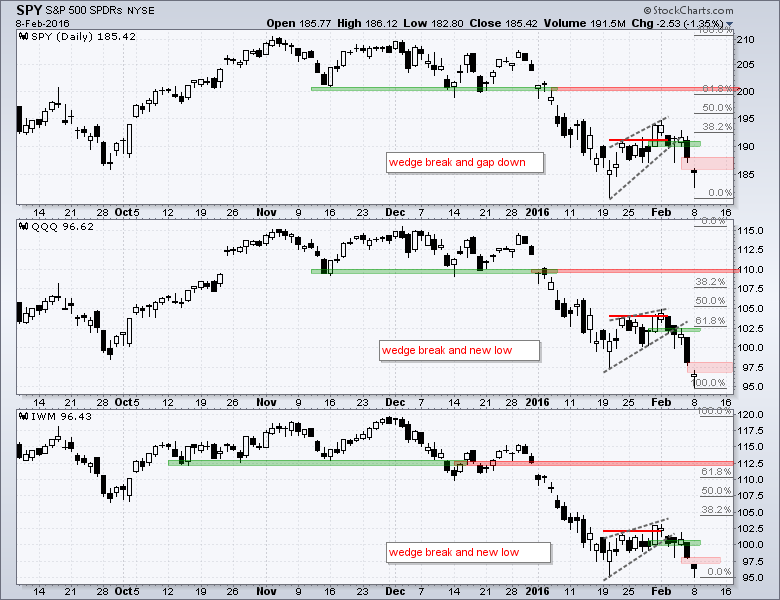
The major index ETFs formed weekly hammers in mid-January and bounced in the second half of the month. This bounce, however, did not amount to much as the rally reversed the first week of February. After a big decline on Friday, the major index ETFs gapped lower on Monday and then recovered to form hammers. Notice, however, that the gaps are still there and all three still closed sharply lower on the day (1.35% to 1.65%). Short-term, a filling of the gap is the first thing to watch. In fact, a gap up today and strong close would forge a rare morning star pattern, but that does not look likely based on the futures.
The Risk-On Sectors
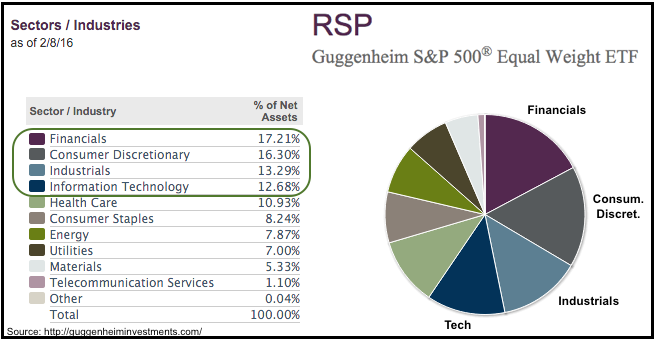
The consumer discretionary, finance, technology and industrials sectors are the four most important sectors in my book. Consumer discretionary represents consumer spending and the most economically sensitive parts of the economy. Finance represents the banking system and the largest sector in the Russell 2000. Technology represents the high growth end of the stock market and the appetite for risk. The industrial sector represents capital equipment and investment in infrastructure. These are the RISK-ON sectors. The market is in good shape when three of the four are trending higher and this is when we want to be long beta. The market is in bad shape when three of the four are trending lower and this is when we want to be out or in defensive names. Note that I am using the equal-weight sectors because they provide a better representation for the average stock in the sector. These four sectors account for around 59% of the EW S&P 500 ETF (RSP).
New Lows in Four Key Sector ETFs
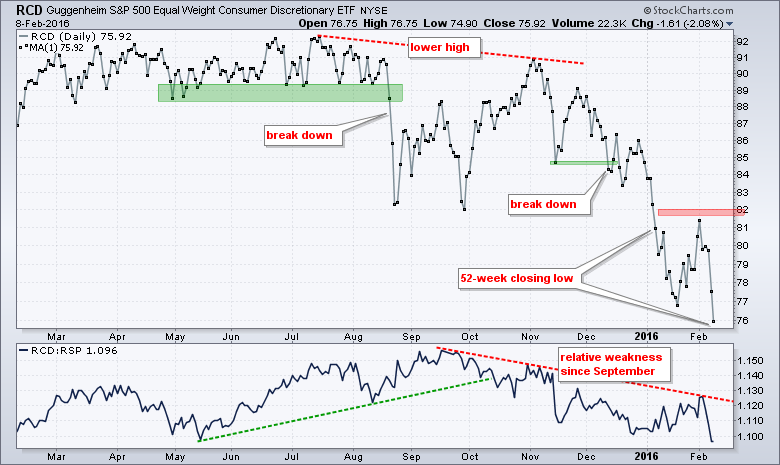
The EW Consumer Discretionary ETF (RCD) broke support in August, formed a lower high in early November and broke down again in mid December. The ETF got what seemed to be a nice bounce in late January, but gave it all back in February and closed at a new low. RCD has also shown relative weakness since September and the price relative hit a new low on Monday. Note that RCD does not include any tech or energy-related stocks. It is basically a proxy for the consumer and consumer spending. A new low and relative weakness in RCD is very negative for the broader market and the economic outlook.
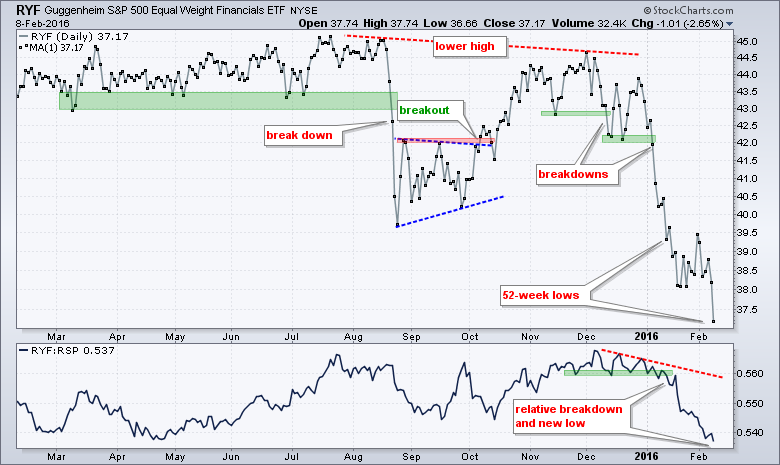
The EW Finance ETF (RYF) formed a lower high in early December and broke down in mid December (and again in early January). The ETF hit its first 52-week closing low on January 13th and recorded another 52-week low on Monday. Note that 52-week highs and lows are usually not isolated events. In other words, expect more after you see the first 52-week milestones because strong trends usually extend.
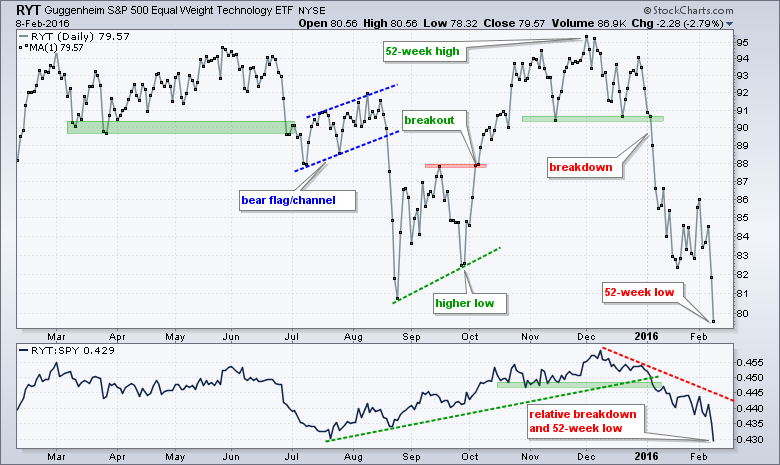
The EW Technology ETF (RYT) held out the longest by hitting a new high in early December, but the ETF broke support in early January along with the rest of the sector ETFs. After a choppy stall in the second half of January, the ETF continued lower in February and hit a new 52-week low on Monday. Also notice that the price relative (RYT:RSP ratio) broke down and RYT is leading lower since early December. Money is clearly moving out of the high-beta end of the stock market.
Even Healthcare is not Healthy
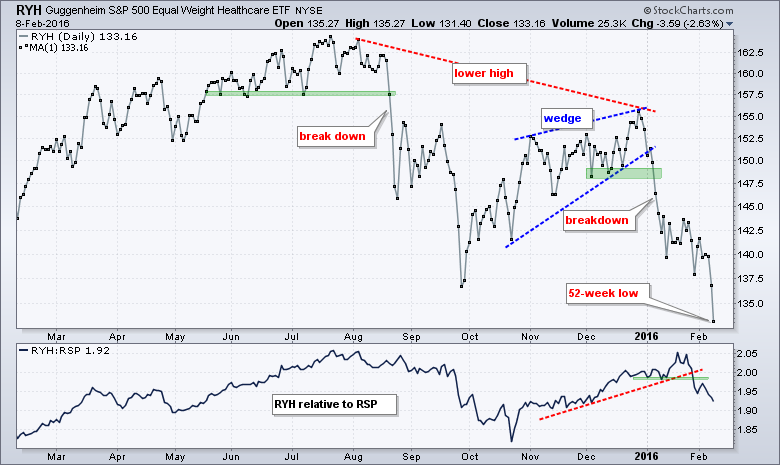
I will add the EW Healthcare ETF (RYH) to this first group because it accounts for 11% of the equal-weight S&P 500 and also hit a new low on Monday. The price chart tells us pretty much all we need to know. The wedge break reversed the counter-trend rally and the long-term trend is down. The ETF held up better than the market until late January when the price relative finally broke down too.
Overall, this means the equal-weight consumer discretionary, finance, technology and healthcare sectors hit new lows on Monday. Throw in new lows in QQQ, $SPX and IWM, and we have long-term downtrends in the most important parts of the market. Sounds like a bear market and my preference is cash or stock alternatives during bear markets.
Long-term Laggards Become Short-term Leaders
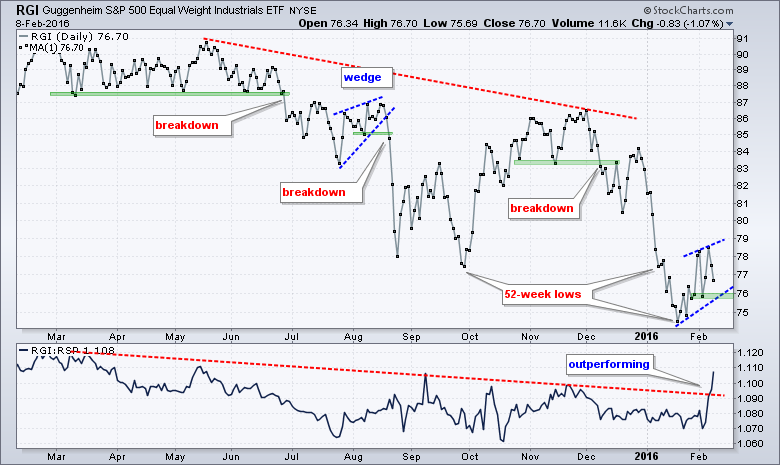
Elsewhere, the industrials, materials and energy sectors became the short-term leaders over the last few weeks. This is, however, a short-term phenomenon and these sectors are nowhere close to uptrends on the price charts. The trend on the price chart trumps relative performance in my book. The EW Industrials ETF (RGI) hit a 52-week (closing) low in late September, got a big bounce into November and moved to new lows in January. Even though the price relative (RGI:RSP ratio) spiked in February, the 52-week low and downtrend on the price chart say "stay away". The 3-week bounce looks like a rising wedge and a break below 75.5 would signal a continuation lower.
Staples Start Feeling the Heat
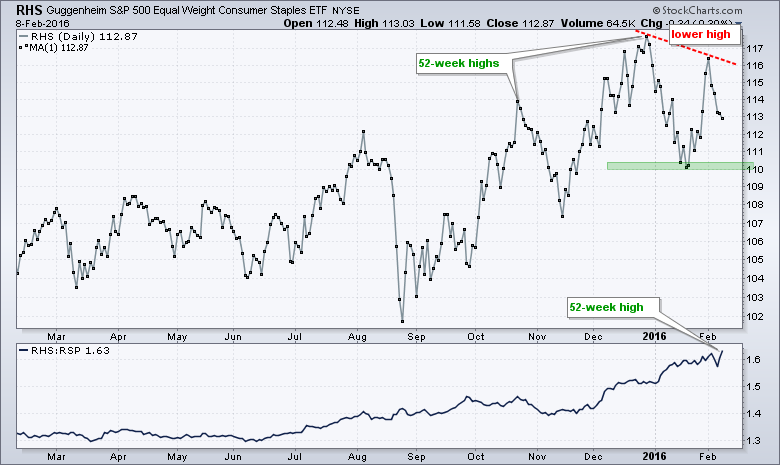
The EW Consumer Staples ETF (RHS) is starting to feel the heat of the bear market as the ETF formed a lower high and fell sharply the last five days. The price relative hit a 52-week high because RHS continues to outperform its benchmark (RSP). I am not impressed because we are in a bear market environment and correlations tend to rise in a bear market. In other words, the bear eventually drags down most of the stocks in the stock market. It would not take much to push RHS back to the 107-108 area, at which point it would be virtually unchanged for a year. It is better to hold cash than be in an equity product that is moving sideways because cash has less risk for the same return.
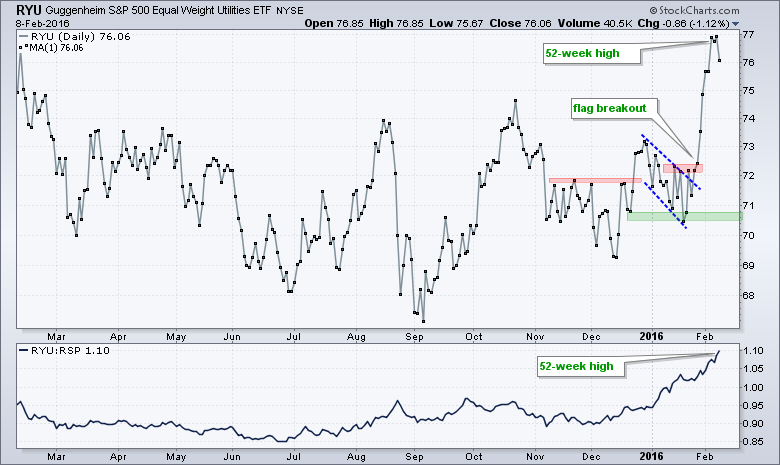
The EW Utilities ETF (RYU) is the other star performer with a 52-week high on the price chart and in the price relative (RYU:RSP ratio). Even though this high-yield ETF is trending up now and showing relative strength, keep in mind that utility stocks are still stocks and we are in a bear market environment. This increases the risk in all stocks and it would not take much to push RYU back to the 73-74 area, which would put the ETF flat for the past year. Is it worth the risk?
Other Commentary Links
Bear Market Bounces - Understanding Bear Market Patterns, Signals and Retracements.
Measuring Risk On-Risk Off - Using charts to quantify stock, economic and credit risk.
PPO Trading Strategy - How to use 3 PPOs to develop a trend-reversion trading strategy.
Long-term Trend Indicators - Using the PPO, EMA Slope and CCI to determine the trend.
ETF Master ChartPack - 300+ ETFs organized in a Master ChartList and in individual groups.
Follow me on Twitter @arthurhill - Keep up with my 140 character commentaries.
****************************************
Thanks for tuning in and have a good day!
--Arthur Hill CMT
Plan your Trade and Trade your Plan
*****************************************


