Keep the Long-term Trends in Mind // A Candlestick Reversal for SPY // XLP Triggers Bullish PPO Signal // Brent versus WTI // Webinar Preview ////
Keep the Long-term Trends in Mind
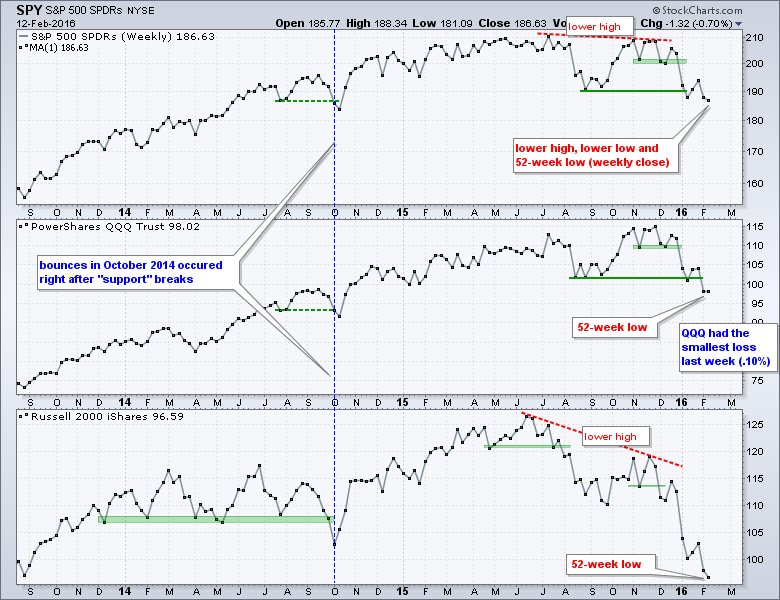
The long-term trends are down for SPY, QQQ and IWM, but a short-term reversal pattern last week and a gap on Monday could signal the start of a corrective bounce. Keep in mind that any bounce at this stage would be considered a bear market bounce until the long-term evidence turns bullish, which would take a minimum of two weeks. Even with Friday's gain and Monday's strong open, we are only talking two days of strength. Two days is enough to affect the short-term trend, but not the long-term trend. The first chart shows weekly closing prices for the big three and all three closed lower last week. I will have more on long-term bullish signals in Thursday's commentary.
A 3-Candlestick Reversal for SPY
Returning to the short-term, SPY formed a short-term reversal over the last three days and this reversal continued with the Monday morning surge. The first chart shows SPY testing the mid January low with a gap down and spinning top Thursday. The spinning top signals indecision because the open and close are almost equal, as are the upper and lower shadows (intraday high and low). The ETF gapped up on Friday and closed strong to forge a three candlestick reversal. It is not a perfect morning star, but the three day pattern captures the spirit of the pattern. Broken support and the 61.8% retracement mark a potential resistance zone around 200.
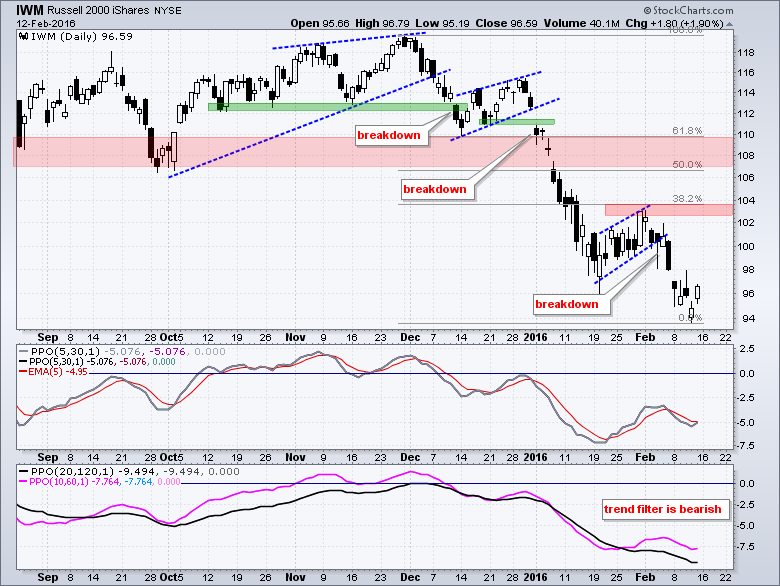
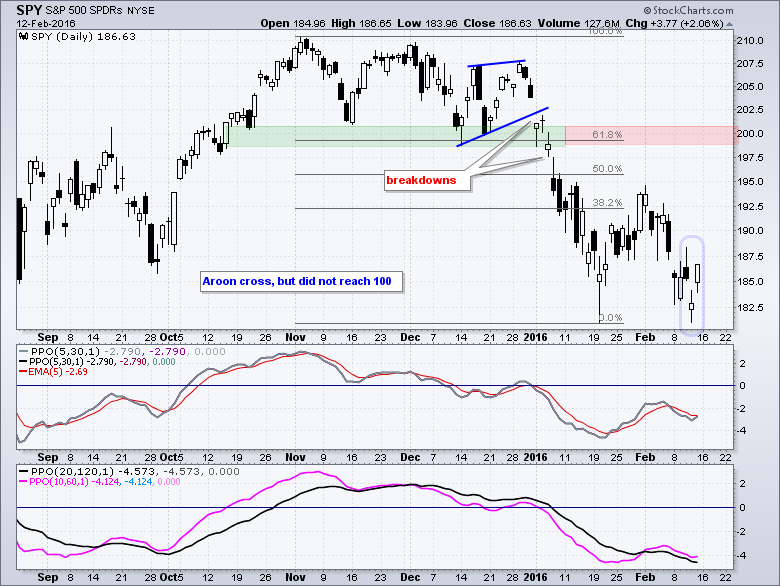 The first indicator window shows the short-term PPO (5,30,1). The second window shows the medium-term PPO (10,60,1) and long-term PPO (20,120,1). First, notice that the medium-term and long-term PPOs are in negative territory. This means the trend filter is bearish. I generally favor short-term bearish setups when the bigger trend is down. We are, however, dealing with stocks and stocks have a long-term upward drift and the global central banks on their side. This makes it difficult to profit on the short side. The PPO (5,30,1) is turning up and will likely cross its signal line today. This is short-term positive, but the long-term is still negative. Instead of a bullish signal, I would prefer to wait for a bearish setup, which would happen if the PPO (5,30,1) moves back to the zero area. You can read more about the PPO strategy here.
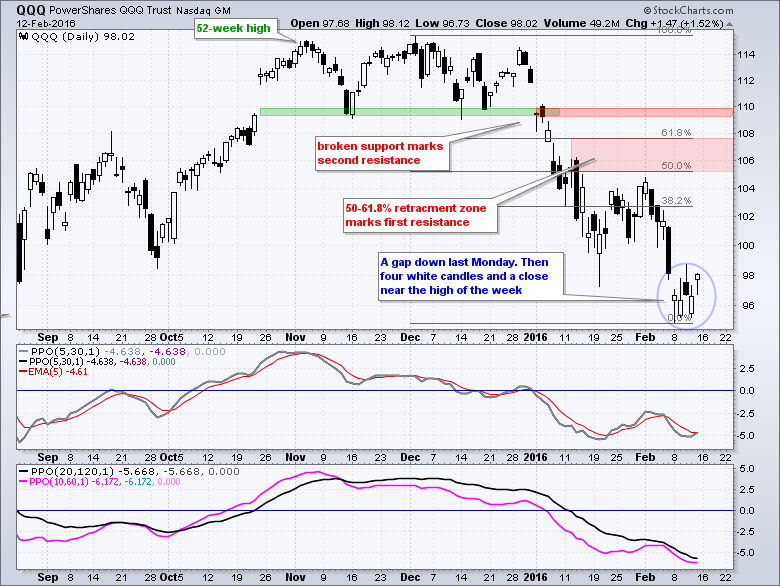
QQQ is also likely to get some sort of short-term breakout on the open Monday. Again, the ETF hit a 52-week low last week and this is still considered a counter-trend bounce. Such a move could retrace 50-61.8% of the prior decline and carry on to the 106-107 area.
 IWM remains the weakest of the three. The ETF also forged a short-term reversal the last three days and is set to open strong on Monday. The ETF is certainly overdue for a bounce after a decline from 120 to 93 (20+ percent). The 38.2% retracement and early February high mark the first resistance level in the 103 area. The 50-61.8% retracement zone and broken support mark second resistance in the 108-110 area. Now that I have marked these levels, the ETF will likely hit resistance somewhere in between the two. That's the way the cookie crumbles because technical analysis is an inexact science.
XLP Triggers Bullish PPO Signal
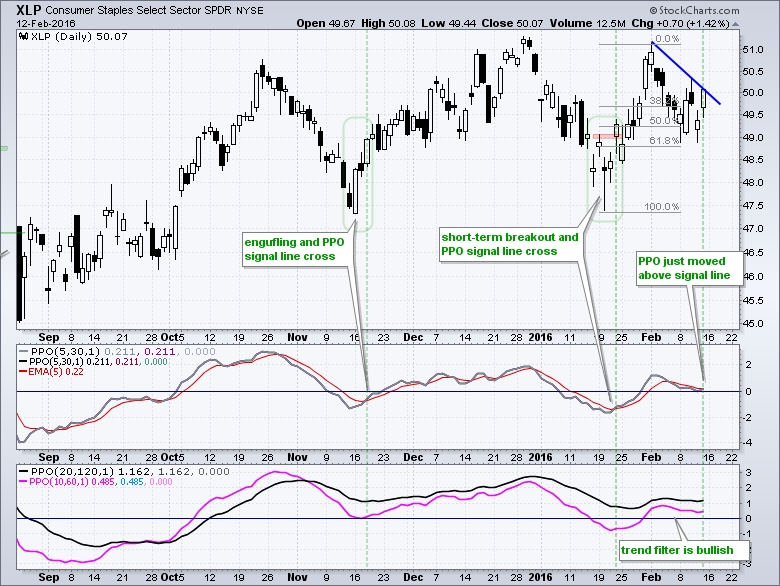
The Consumer Staples SPDR (XLP) is one of the strongest sectors right now (the other is XLU). The chart below shows the ETF in an uptrend overall and with a bullish trend filter (PPO (10,60,1) and PPO (20,120,1) are positive). On the price chart, notice that XLP formed a falling flag of sorts and reversed off the 61.8% retracement. The PPO (5,30,1) moved to the zero line and turned up on Friday with a signal line cross.
Brent versus WTI
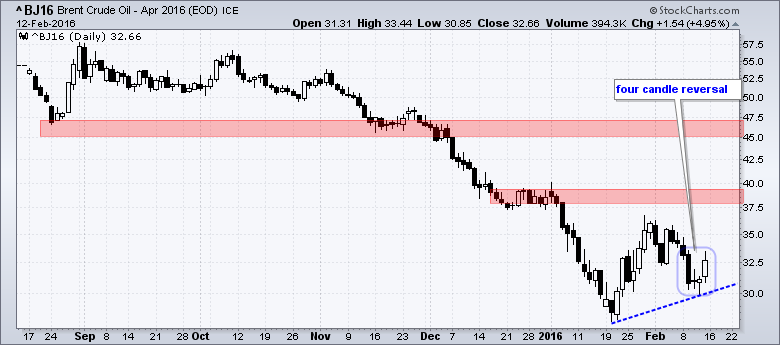
Oil is all over the news today because of the meeting between oil ministers from Saudi Arabia and Russia. I have no idea if this meeting will result in production cuts or if it will even matter. As with the Fed, jawboning is sometimes all it takes to move jittery markets. April Brent Futures (^BJ16) surged at the end of January and pulled back the first two weeks of February. Notice that Brent held above the January low and forged a four-candle reversal. There was a long black candlestick, a doji, another stalling candlestick and a long white candlestick. The makings of a short-term reversal are there, but the long-term trend is clearly down and oil is not even on my radar for long positions because of this long-term downtrend. The first resistance for Brent is in the upper 30s.
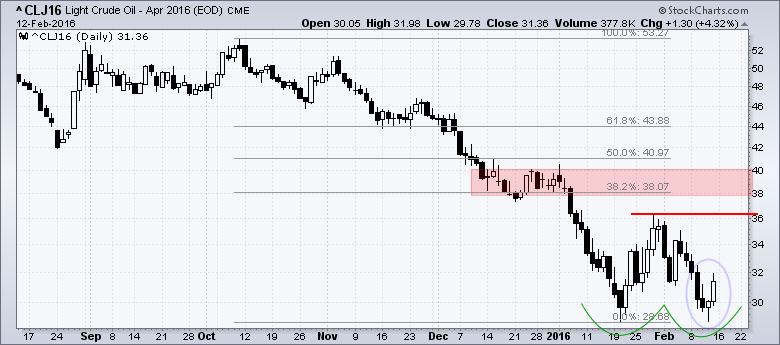
April Light Crude (^CLJ16) tested its mid January low with a hammer last Thursday and surged on Friday. It is possible that a double bottom is taking shape with the late January high marking first resistance. Even though a breakout would be bullish, I would mark a big resistance zone in the 38-40 area. Keep in mind that oil is in a long-term downtrend and a period of basing is likely before we see a meaningful advance.
Other Commentary Links
Bear Market Bounces - Understanding Bear Market Patterns, Signals and Retracements.
Measuring Risk On-Risk Off - Using charts to quantify stock, economic and credit risk.
PPO Trading Strategy - How to use 3 PPOs to develop a trend-reversion trading strategy.
Long-term Trend Indicators - Using the PPO, EMA Slope and CCI to determine the trend.
ETF Master ChartPack - 300+ ETFs organized in a Master ChartList and in individual groups.
Follow me on Twitter @arthurhill - Keep up with my 140 character commentaries.
****************************************
Thanks for tuning in and have a good day!
--Arthur Hill CMT
Plan your Trade and Trade your Plan
*****************************************

