SPY Heads for First Retracement // A Look at the 2011 Double Bottom Bounce // QQQ Forges an Island Reversal // Energy, Materials and Industrials Lead Short-term Bounce // Charting the Key Stocks in XLE, XLB and XLI // XOM, CVX, SLB, DD, DOW, MON, GE, HON, MMM ////
Mind the Gaps
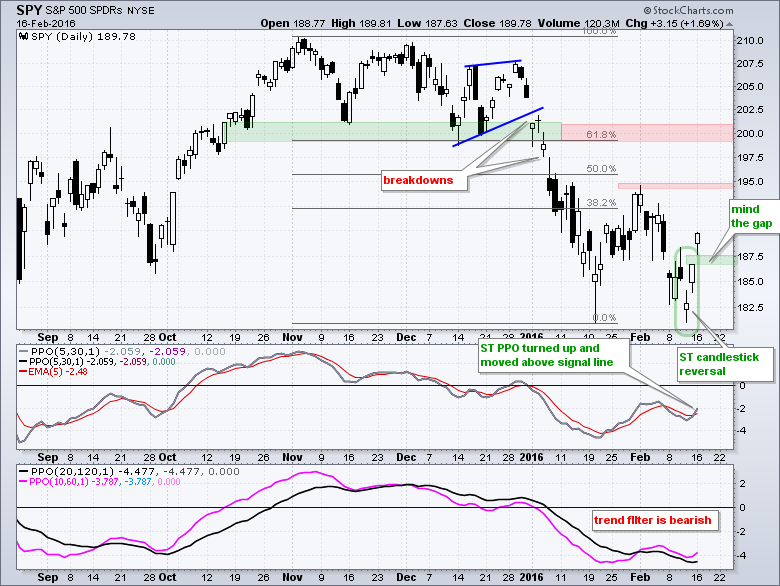
SPY followed through on last week's three-candlestick reversal with a gap and strong close on Tuesday. Note that a three-candlestick reversal does not require confirmation. In contrast, a single candlestick reversal (hammer) or a two-candlestick reversal (piercing pattern) requires confirmation, which comes in the form of subsequent gains. The indicator window shows the short-term PPO (5,30,1) moving above its signal line as short-term direction changes course. Thus, the short-term reversal is in play right now and we can start considering upside targets (resistance). The early February high and 50% retracement mark resistance in the 195 area. Broken support and the 61.8% retracement mark resistance in the 200 area. At this point, Tuesday's gap marks the first area to watch for a failure. A close below last Friday's close would fill the gap and negate this reversal.
A Look at the 2011 Double Bottom Bounce
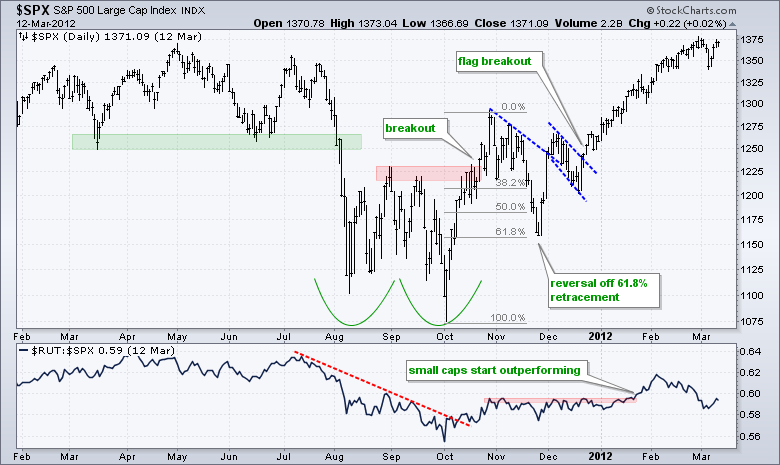
Note that double-bottom type reversals are fairly common in the S&P 500. I am using double-bottom in the loosest sense of the term (two lows in the same area). Looking back over the years, I spotted similar double bottom bounces in July-October 2003, June-July 2006, March 2007, January-March 2008, August-September 2011 and August-September 2015. The chart below shows a double-bottom type reversal in August-October 2011. Notice the breakout AND then the sharp pullback. For those missing the bottom, there was a second chance to partake with the reversal off the 61.8% retracement (higher low). There was even a third chance with the flag breakout in late December. Also notice that small-caps did not start leading until January 2012 and this is when the advance really caught fire. The moral of the story: there is no need to chase the first bounce off a prior low. The bigger trends remain down and this bounce is just a short-term uptrend for now.
QQQ Forges an Island Reversal
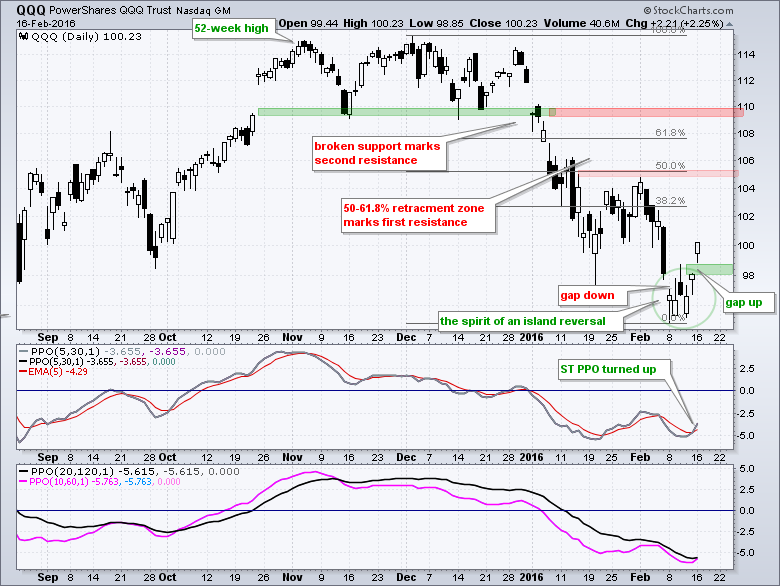
Though not a perfect island reversal, I think QQQ captured the spirit of an island reversal over the last seven trading days. Notice the gap down on Monday (8-Feb), the 4-5 day consolidation in the 95-98 area and Tuesday's gap. Traders establishing short positions are now trapped on last week's island with losses and have a hard decision to make. Actually, the decision is quite easy. The short-term trend has clearly reversed and now is not the time to be short. As noted before, I am not keen on short positions in general because bear market rallies can be very sharp and can occur at a moment's notice. Also keep in mind that stocks have a long-term upward drift and the central banks have their back. In any case, Friday's close is the first level to watch. A close below 98 would fill the gap and negate the short-term reversal.
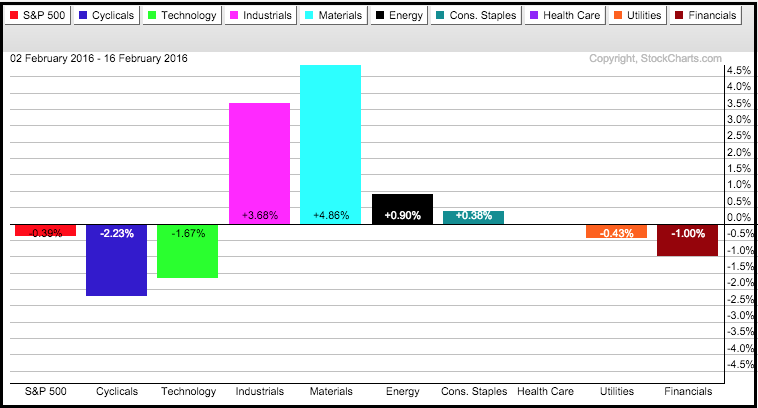
Energy, Materials and Industrials Lead Short-term Bounce
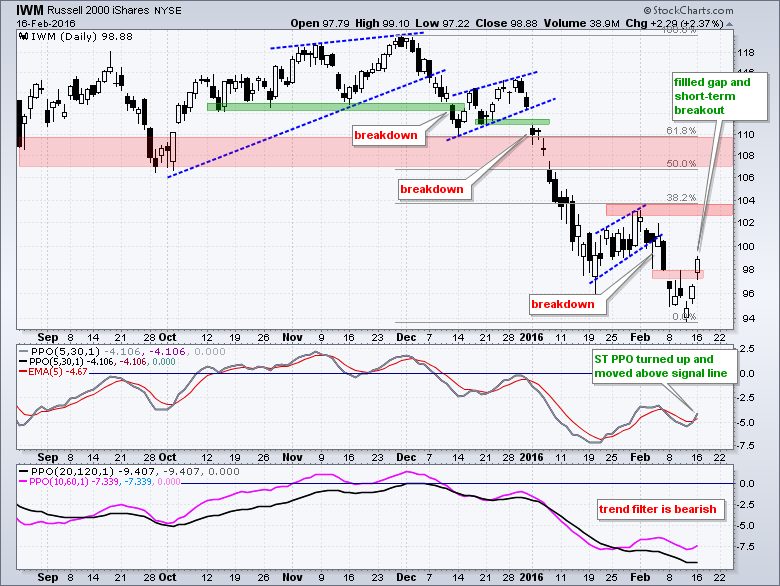
I talked about benchmark lows and how we can use them to compare charts in Tuesday's webinar. Note that SPY, QQQ and IWM formed lows on January 20th and exceeded these lows last week (closing basis). The lows on January 20th now become benchmark lows that chartists can use to look for relative "chart" strength. Stocks and ETFs that held above their 20-January lows show relative chart strength and should be watched for upside potential, even though we are still in a bear market environment. Looking through the sector and industry group ETFs, I found a few that held above their January 20th lows. These include XLE, XLB, XLI, XLU, XLP, MOO, REM, IYT, IGE, KOL, FCG, OIH and IYZ. There are quite a few names associated with energy and materials in this group, and these names are still in long-term downtrends.
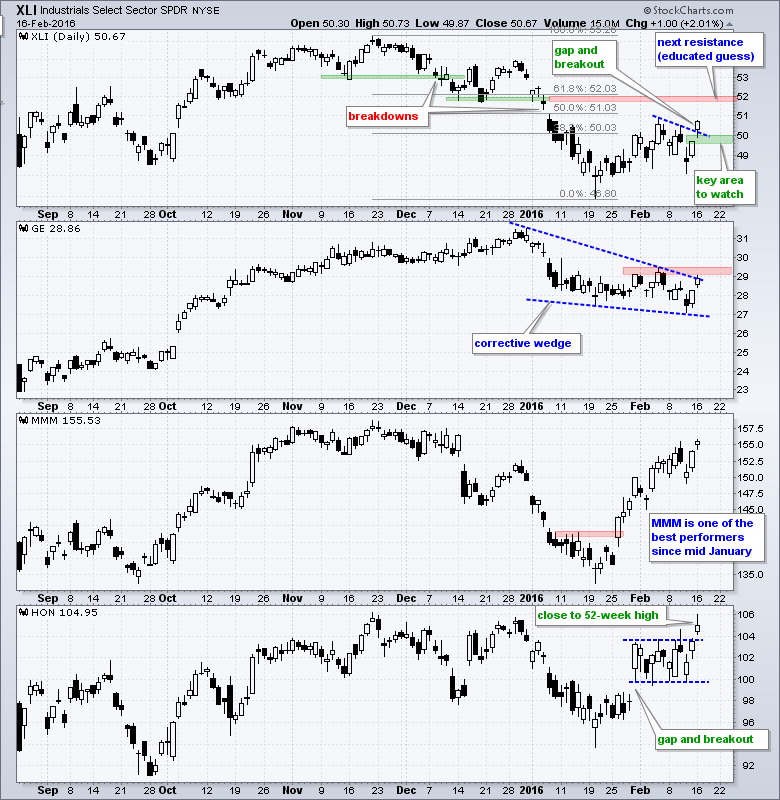
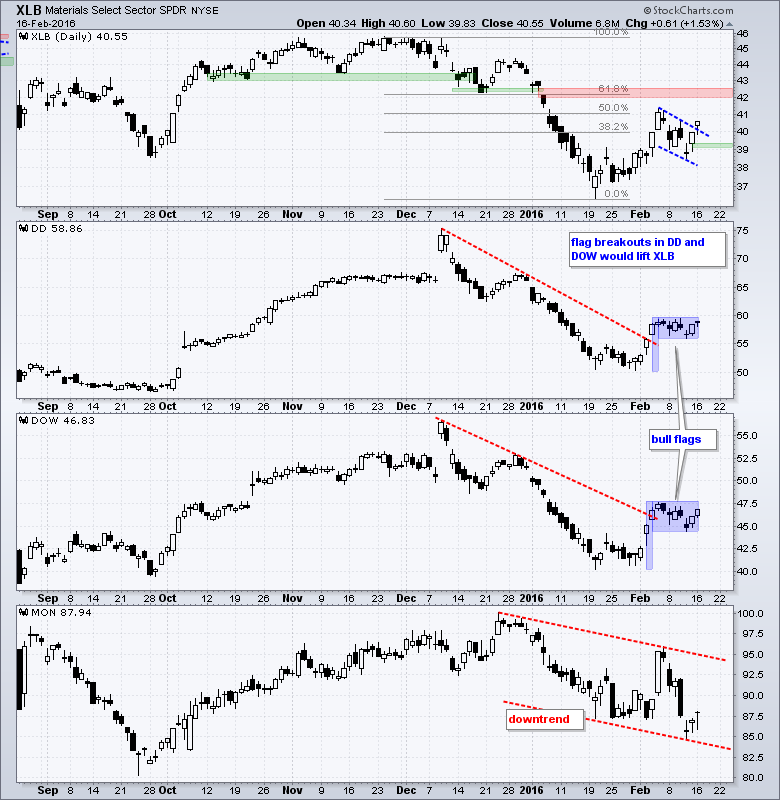
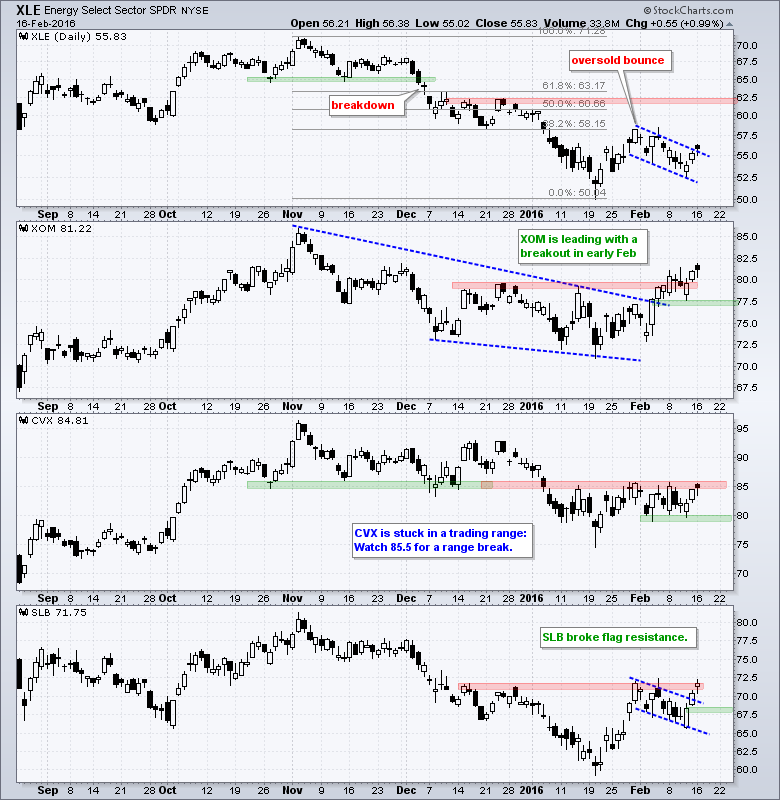
Charting the Key Stocks in XLE, XLB and XLI
The sector SPDRs are unique because the biggest stocks carry the most weight. In other words, large-caps dominate the SPDRs. DD (11.19%), DOW (11.42%) and MON (8.39%) dominate the Materials SPDR (XLB). XOM (20.76%), CVX (14.83%) and SLB (8.59%) dominate the Energy SPDR (XLE). GE (11.68%), MMM (5.69%) and HON(4.94%) dominate the Industrials SPDR (XLI), but to a lesser degree. Note that the top three stocks account for over 30% of XLE and XLB, while the top three stocks account for around 22% of XLI. Chartists interested in these three ETFs should also analyze these key stocks. The next 12 charts show the SPDR and the top three stocks with annotations. Keep in mind that the long-term trends are still DOWN for XLE, XLB and XLI, but the short-term trends are turning up and they are showing short-term leadership. As the timeframe implies, short-term trends can quickly fizzle and reverse so these bear a close watch. No pun intended!

Other Commentary Links
Bear Market Bounces - Understanding Bear Market Patterns, Signals and Retracements.
Measuring Risk On-Risk Off - Using charts to quantify stock, economic and credit risk.
PPO Trading Strategy - How to use 3 PPOs to develop a trend-reversion trading strategy.
Long-term Trend Indicators - Using the PPO, EMA Slope and CCI to determine the trend.
ETF Master ChartPack - 300+ ETFs organized in a Master ChartList and in individual groups.
Follow me on Twitter @arthurhill - Keep up with my 140 character commentaries.
****************************************
Thanks for tuning in and have a good day!
--Arthur Hill CMT
Plan your Trade and Trade your Plan
*****************************************


