52-week Lows Reinforce Downtrends // Downtrends in Five Key Asian Markets // Italy and Spain Lead Europe to New Lows // Lower Lows all Around in the US // Using the %Above 50-day EMA to Gauge Participation // Using the %Above 50-day EMA to Rank Performance // Friday Food for Thought
52-week Lows Reinforce Downtrends
The big trends are down as SPY, QQQ and IWM hit 52-week lows in February. The first chart shows weekly closes to weed out some of the noise (day to day gyrations). All three broke below their August-September lows and are down double digits since late November. Notice that the depth of the decline increases as the beta (risk) rises. SPY is down around 12.5%, QQQ is down around 16% and IWM is down around 20%. IWM got hit especially hard because the finance sector is by far its biggest sector (26.68%).
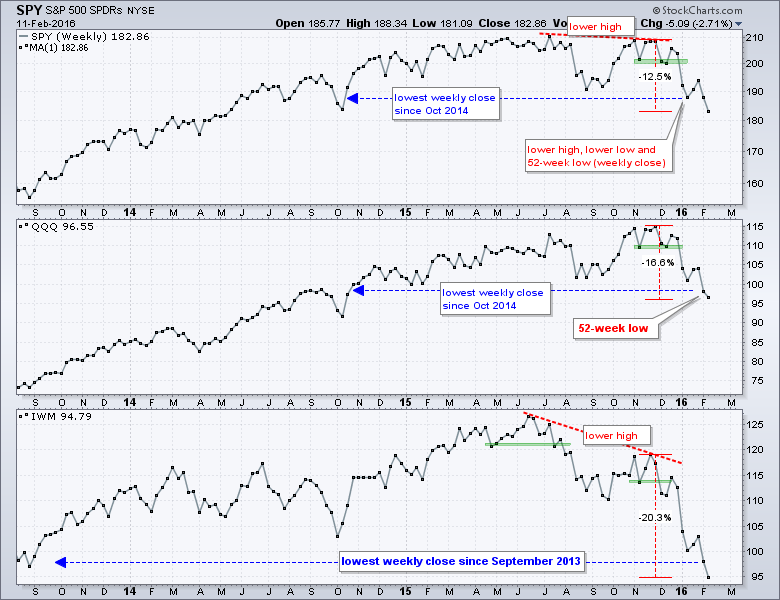
The only positive is that the stock market is ripe for a counter trend bounce. I would still view any bounce as a bear market rally at this stage. Before leaving this chart, note that short-term reversals and bounces can happen at any stage of the decline and even right after a "support" break. While I think the current decline is more serious than the decline in September-October 2014, notice that the major index ETFs bounced right after breaking so-called support levels. IWM broke a very well-defined "support" zone in late September and then surged 11%. If you take a very careful look at the blue dotted line, you will notice that SPY and QQQ declined the first week of October and IWM actually advanced that week. A little relative strength in small-caps foreshadowed that bounce.
Downtrends in Five Key Asian Markets
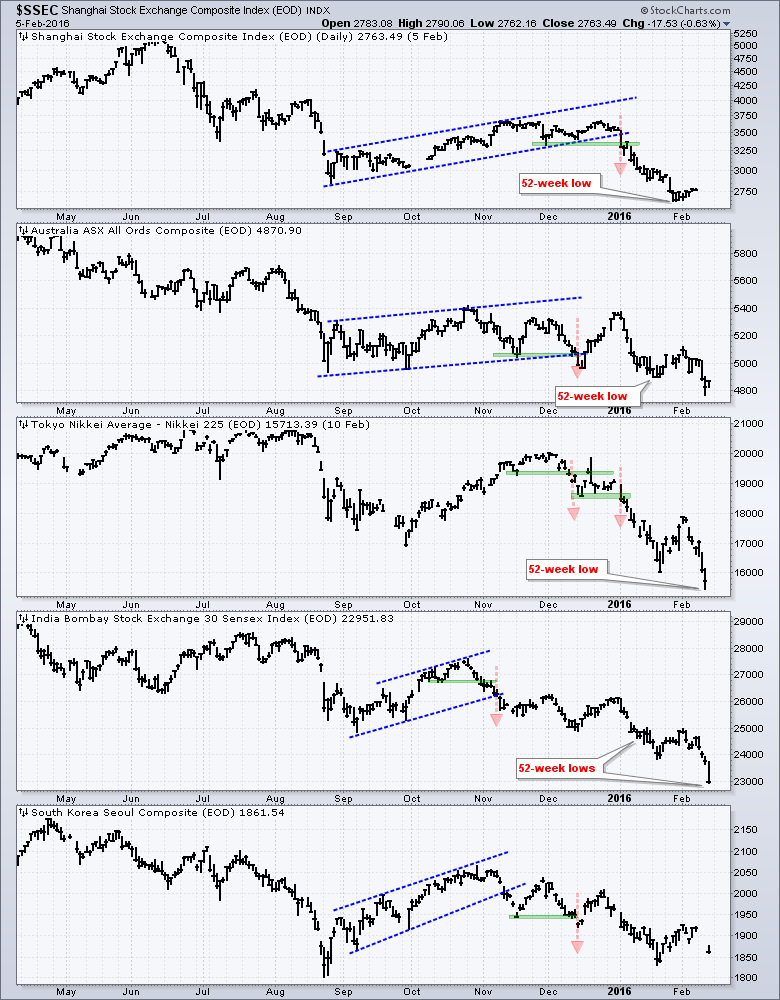
Note that Chinese markets have been closed for a week and re-open on Monday. The US markets are closed on Monday for President's day. Shanghai will have to absorb a week's worth of volatility on Monday's open. I have no idea how the Chinese markets will react, but this is known information and my guess is that the reaction in Chinese stocks is already price into the US markets. The chart below shows five Asian indices in downtrends already so weakness is nothing new. All five bounced in September-October, formed lower highs and then broke down in November-December (red arrows). The Shanghai Composite ($SSEC) actually broke down in early January. Also notice that four of the five hit 52-week lows in late January or early February. The South Korea Seoul Composite ($KOSPI) is the only one that held above its August low. Nevertheless, it is not a pretty picture in Asia.
Italy and Spain Lead Europe to New Lows
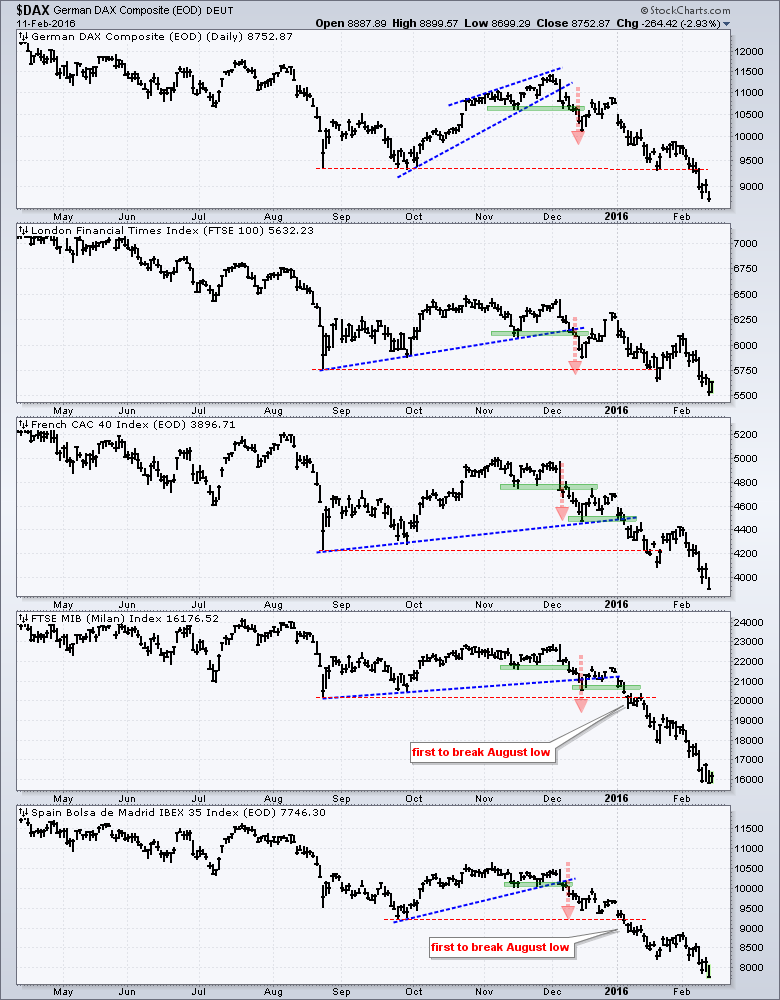
The situation in Europe is just as negative. The next chart shows five major European stock indices and all five hit 52-week lows in February. European markets bounced in September-October, formed lower highs and broke down in December - across the board. The Milan Index ($MIB) and Madrid Index ($IBEX) led the way lower in January because they were the first to break their August-September lows. These two represent the high beta end of the market in Europe, kind of like small-caps here in the US. They are like the canaries in the coalmine so-to-speak and we should watch these two closely.
Lower Lows all Around in the US
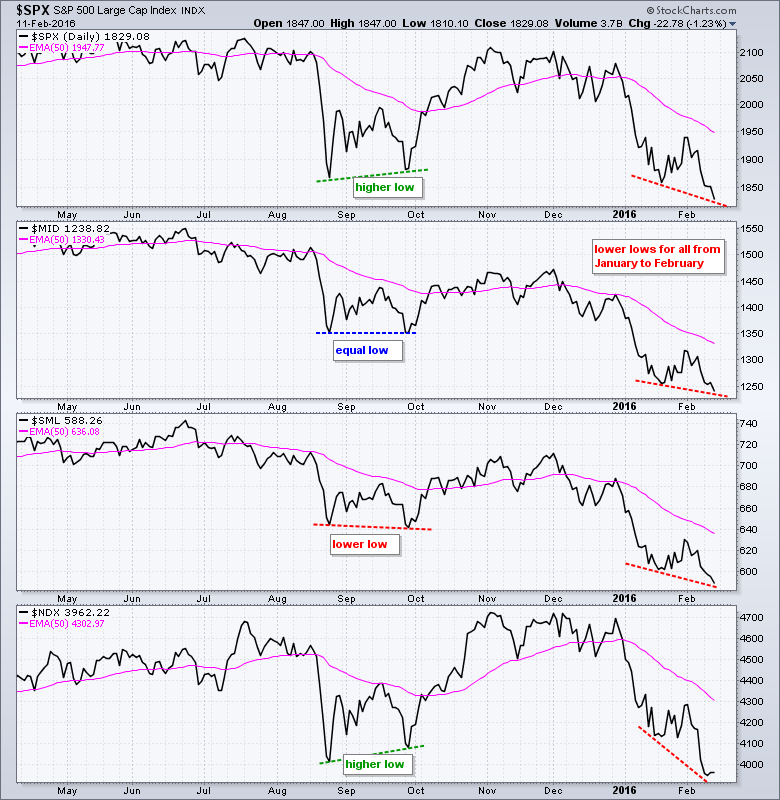
The big trends are down pretty much everywhere, but markets do bounce and there will be counter-trend rallies. Timing them is another story. Before looking at some short-term indicators, I am showing line charts for the S&P 500, S&P MidCap 400, S&P Small-Cap 600 and Nasdaq 100. On a closing basis, all four formed lower lows from January to February. In contrast, notice that the S&P 500 and Nasdaq 100 formed higher lows from August to September, while the S&P MidCap 400 formed an equal low. The mixed picture in late September was much different that it is now. Selling pressure was widespread in February and all four indices moved to new lows.
Using the %Above 50-day EMA to Gauge Participation
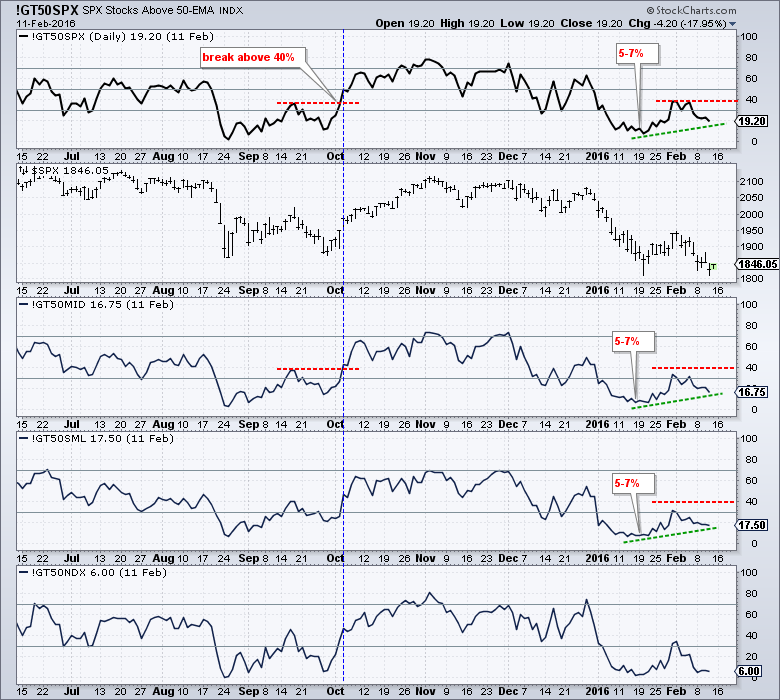
With lower lows across the board in January-February, an indicator that sports a higher low during this timeframe would show a bullish divergence. I am not going to use momentum oscillators because I am not interested in less downside momentum. Instead, I am going to look at the percentage of stocks above the 50-day EMA for the S&P 500, S&P 400, S&P 600 and Nasdaq 100. I am looking for small changes to suggest that fewer stocks are participating in the decline. This indicates less internal weakness and could foreshadow a bounce. The indicator dipped to the 5-7% range for the S&P 500, S&P 400 and S&P 600 in mid January. After a bounce in the second half of January, the indicator turned back down in February, but remains well above the mid January lows. The indicator is in the 16-20% range now with the S&P 500 %Above 50-day EMA (!GT50SPX) the highest at 19.20%. A bullish divergence is setting up here and a break above +40% would signal a increase in upside participation and this could signal the start of a counter trend bounce.
Using the %Above 50-day EMA to Rank Performance
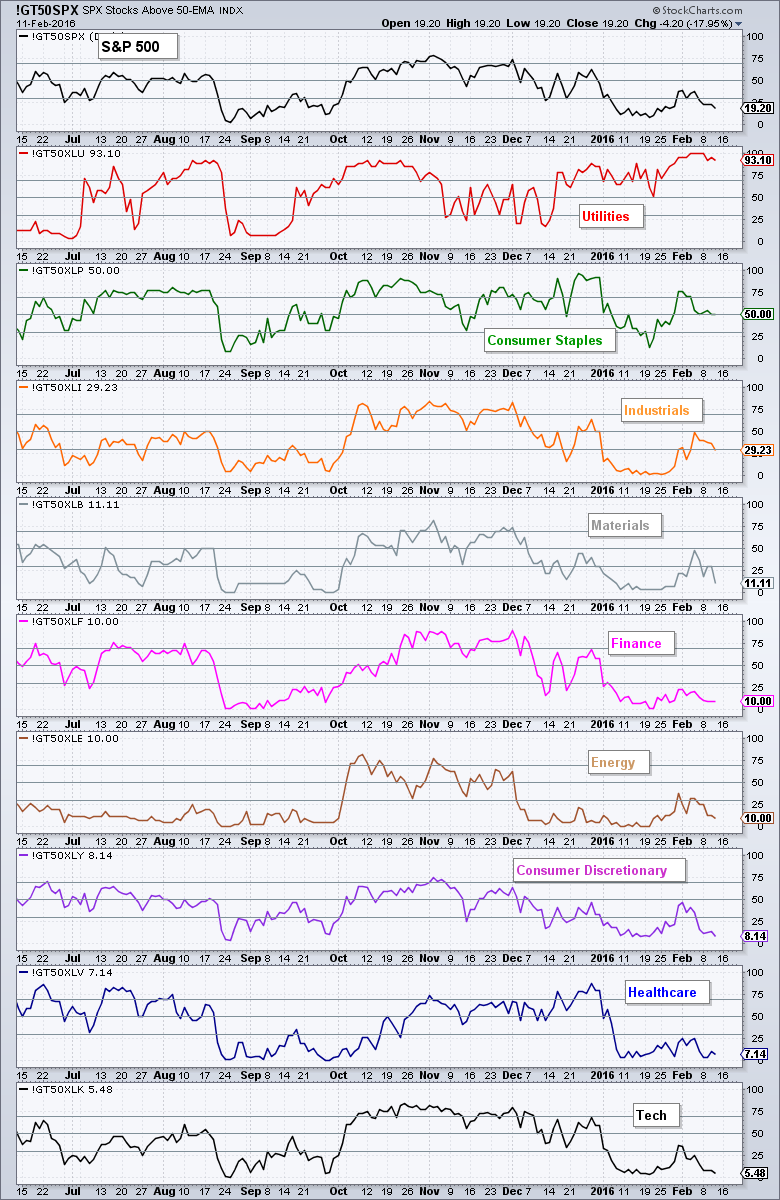
Chartists can also use the percent-above indicators to rank sectors or indices. The chart below shows the percentage of the 50-day EMA for the S&P 500 and the nine sectors. The sectors with the most stocks above the 50-day EMA are at the top and those with the fewest are at the bottom. You can see the values highlighted on the right hand scale. Only one sector has more than 50% of its components of above the 50-day EMA (utilities). Exactly 50% of the stocks in the consumer staples are above their 50-day EMA. Industrials is next with 29.23% and shows some surprising strength. The remaining six sectors are quite weak with readings at 11.11% or lower.
Friday Food for Thought
The Realities of Support, Oversold Conditions, Hiding Places, Correlations and Cash in Bear Markets (Arthur Hill, StocksCharts.com)
Why Currency Hedging Foreign Equities Hurts Diversification (Lawrence Hamtil, Fortune Financial) - My Comment: Even though you will get some big movements in the currency markets, equity moves are usually much greater than currency moves and it make sense to focus more on the asset than the currency.
Currency-hedged ETFs were extremely popular for much of 2015 as investors sought to win two times over by owning shares from countries such as Japan and Germany (which they expected to do well given a devaluing currency), and also benefit from being short the depreciating currency. However, as many studies have shown, this strategy has been a mixed bag over the very long term as currency movements tend to mean-revert.
Goldman Sachs Abandons Five of Six 'Top Trade' Calls for 2016 (Bloomberg) - My comment: You know nothing, Jon Snow. Nobody knows when a trend will end or how far a trend will extend. It is ok to read other analysis, but we should also think for ourselves and do our own due diligence. Also see the Josh Brown's post on the subject.
Goldman Sachs to clients: whoops. Just six weeks into 2016, the New York-based bank has abandoned five of six recommended top trades for the year. The dollar versus a basket of euro and yen; yields on Italian bonds versus their German counterparts; U.S. inflation expectations: Goldman Sachs Group Inc. was wrong on all that and more.
Avoiding Bear Markets to Improve Risk-Adjusted Returns (EconomicPicData Blog)
22 Things a Man Should Know about Trading (Victor Niederhoffer, Daily Speculations) - My comment: Women traders should also read this list! Number 5: Try not to sell markets that have big drifts upwards like stocks.
More Wall Street Strategists Are Cutting Their S&P 500 Estimates (Bloomberg) - My comment: These strategists are cutting their estimates after a sharp decline. Sounds like they are closet trend followers.
Just five weeks into 2016, seven of the 21 strategists tracked by Bloomberg have lowered their projections for the Standard & Poor’s 500 Index amid a rout that wiped more than $2 trillion from prices. The cuts have reduced the average annual estimate, the first time that’s happened this early in a year since the Iraq war in 2003.
5 Things To Do During Market Corrections (Joe Fahmy, Zor Capital)
5) Learn Patience – The technical damage so far this year is extreme and needs time to repair. How long? Nobody knows. It could be a few weeks, a few months, or even longer. Either way, all the major indexes are below their 200-day moving averages. My experience tells me that when bad news happens AND we are below this level, the bad news tends to exaggerate moves to the downside.
Other Commentary Links
Bear Market Bounces - Understanding Bear Market Patterns, Signals and Retracements.
Measuring Risk On-Risk Off - Using charts to quantify stock, economic and credit risk.
PPO Trading Strategy - How to use 3 PPOs to develop a trend-reversion trading strategy.
Long-term Trend Indicators - Using the PPO, EMA Slope and CCI to determine the trend.
ETF Master ChartPack - 300+ ETFs organized in a Master ChartList and in individual groups.
Follow me on Twitter @arthurhill - Keep up with my 140 character commentaries.
****************************************
Thanks for tuning in and have a good day!
--Arthur Hill CMT
Plan your Trade and Trade your Plan
*****************************************


