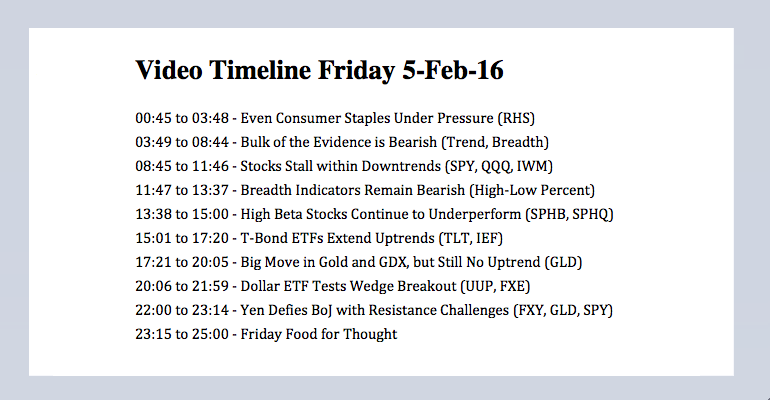
Even Consumer Staples are Under Pressure // Bulk of the Evidence is Bearish // Stocks Stall within Downtrends // Breadth Indicators Remain Bearish // High Beta Stocks Continue to Underperform // T-Bond ETFs Extend Uptrends // Big Move in Gold and GDX, but Still No Uptrend // Dollar Negates Wedge Breakout // Yen Defies BoJ with Resistance Challenges // Friday Food for Thought ////
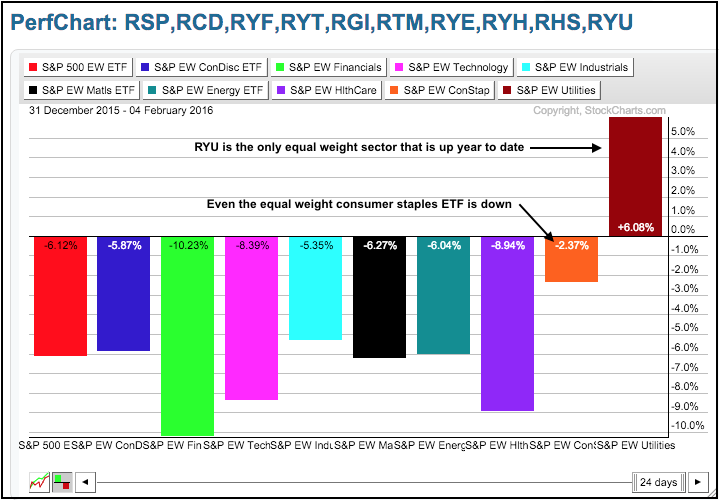
Even Consumer Staples are Under Pressure
The major index ETFs are in long-term downtrends and we are in a bear market for stocks. Even though the utilities stocks are holding up well and the consumer staples sector is in an uptrend still, these two sectors represent less than 15% of the S&P 500 and are considered defensive stocks. In other words, these are not the sectors we want to see leading the market. Regardless, seven of the nine sectors are in long-term downtrends and this represents the vast majority of the stock market. The pickings are slim in a bear market and it is usually better to be in cash or stock alternatives. The PerfChart below shows eight of the nine equal-weight sectors are down year-to-date. This means that even the average stock in the consumer staples sector is struggling. Outside the stock market, Treasury bonds continue to perform well as TLT and IEF extended their uptrends again this week. Gold and gold miners caught big bids the last few weeks, but both remain in long-term downtrends.
Bulk of the Evidence Remains Bearish
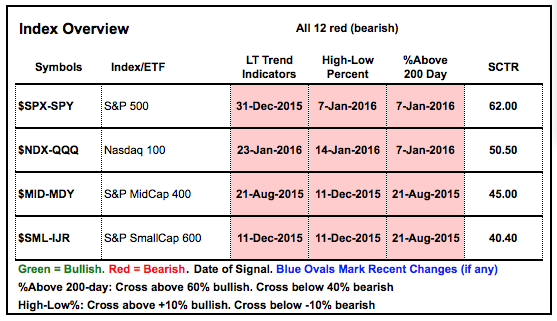
For an overview of the broad market, I will start with a signal table for the major index ETFs. Overall, the long-term trend and breadth indicators are net bearish for the major index ETFs. These indicators turned bearish for the S&P SmallCap iShares (IJR) and S&P MidCap SPDR (MDY) on December 11st. The S&P 500 SPDR (SPY) and Nasdaq 100 ETF (QQQ) followed suit more indicators turned bearish on January7th. The QQQ trend indicators held out until January 23rd. Since all are in bear mode, I sorted this table by the StockCharts Technical Rank (SCTR). Notice that small-caps are at the bottom and mid-caps are underperforming as well.
Stocks Stall within Downtrends
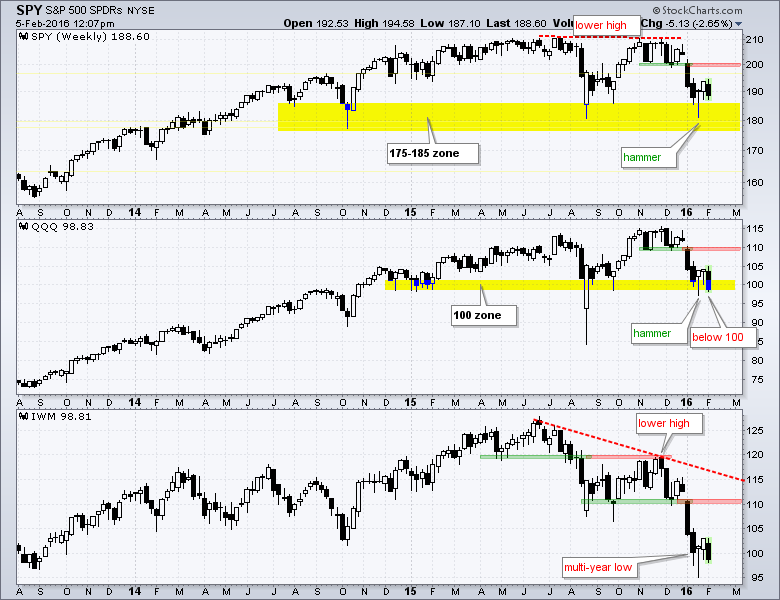
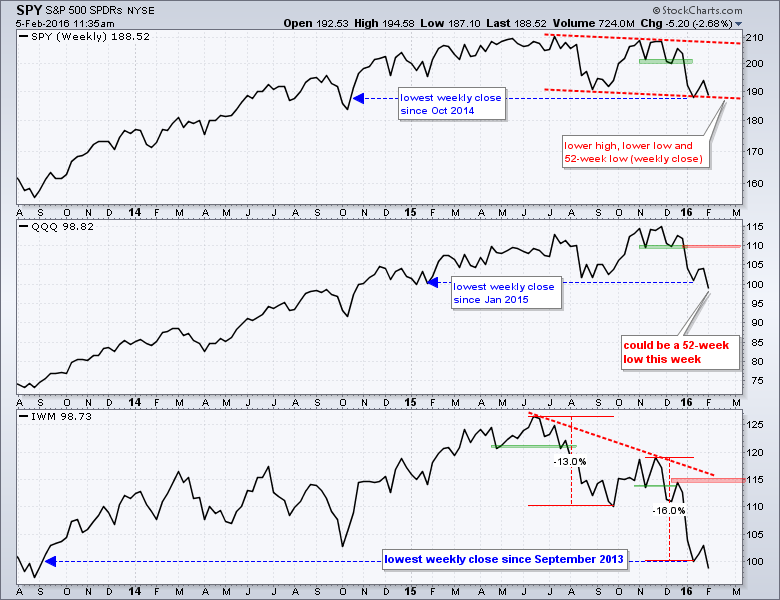
On the weekly candlestick chart, SPY and QQQ fell to their August-September lows in January and stalled the last three weeks. With the bigger trends down and the overall evidence bearish, the most I would expect is an oversold bounce at this stage, but even this is proving difficult. Notice that SPY bounced off the 175-185 zone in October 2014 and August 2015. The ETF attempted bounce with a hammer three weeks ago and small gain last week, but fell back this week. QQQ started the week on a down note and is back below 100 today. The ETF formed a hammer three weeks ago, but has not been able to follow through and shows relative weakness in February. IWM hit multi-year lows in mid January and also firmed with a hammer. IWM remains by far the weakest of the three.
 The weekly close-only charts filter out day-to-day price action and focus on the Friday close. There could be a little change to this chart because it was created on Friday morning. Here we can see a clear falling price channel for SPY since July and a 52-week low in January (7-month downtrend). QQQ did not record a 52-week low in early January, but the ETF is trading at a 52-week low on Friday morning. IWM fell to its lowest level since September 2013 after a 16% decline.
Breadth Indicators Remain Bearish
The breadth indicators are bearish overall. The High-Low Percent indicators turn bullish with a move above +10% and remain bullish until a move below -10%, which turns them bearish. High-Low Percent for the S&P MidCap 400 and S&P Small-Cap 600 has been net bearish since August 21st and High-Low Percent for the S&P 500 turned bearish on January 7th. Five of the nine sector High-Low Percent indicators were net bearish as of December 11th. The High-Low Percent indicators for the finance and consumer discretionary sectors turned net bearish on January 7th and now seven of nine are bearish. There are some new highs, but these are concentrated in the utilities and consumer staples sectors, which are defensive. There are some chart links below the chart.
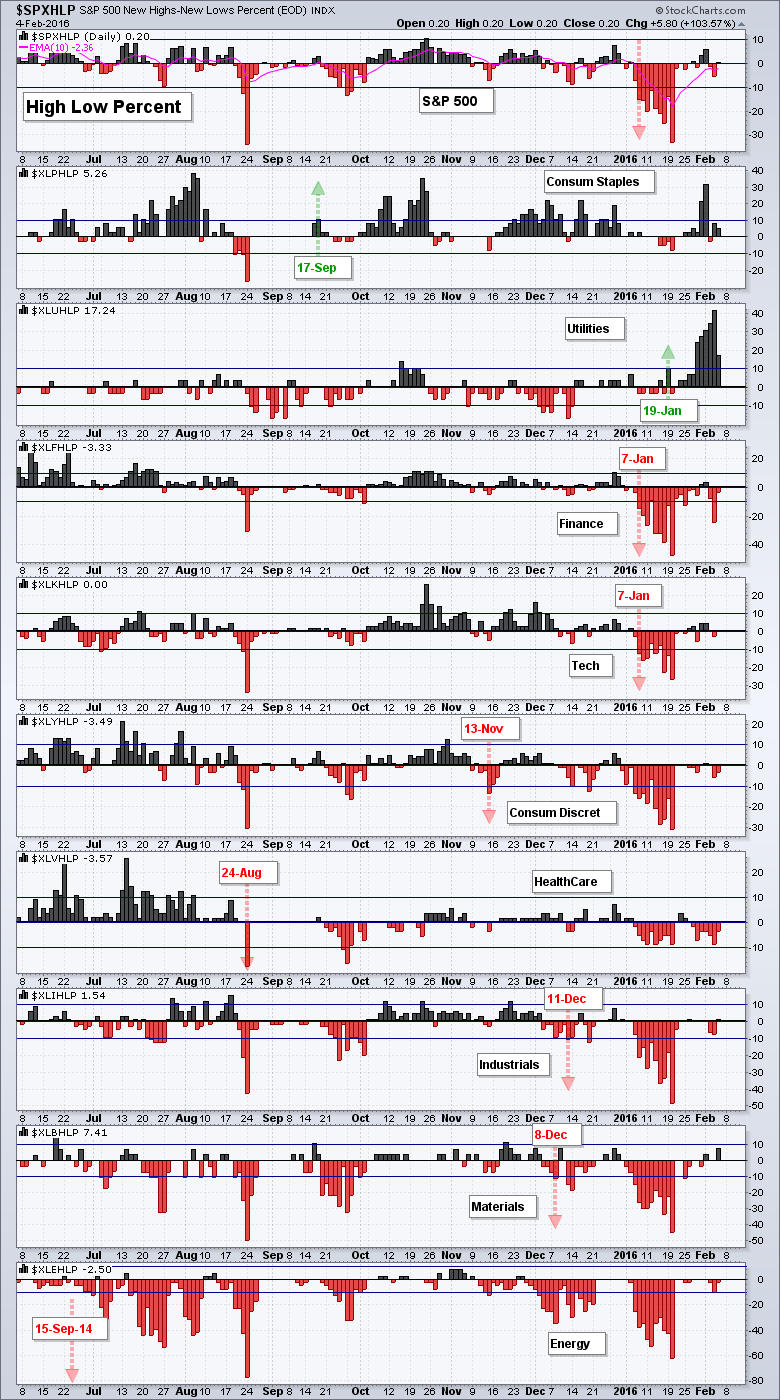
Charts: Index High-Low% - Sector High-Low% - Index %Above 200-day - Sector %Above 200-day
High Beta Stocks Continue to Underperform
The risk indicators are still pointing down. Stocks are underperforming Treasury bonds, Housing stocks are underperforming the broader market, Retail stocks are underperforming and Junk bonds are underperforming Treasury bonds. Note that the JNK:IEF ratio hit another new low this week. For a chart example, the S&P 500 High Beta ETF (SPHB) continues to seriously underperform the S&P 500 High Quality ETF (SPHQ) as the SPHB:SPHQ ratio hit a new low this week. At the very least, this relative performance metric tells us to avoid the high beta (riskier) end of the market and focus on high quality stocks. Of course, focusing on high quality stock during a bear market just means you will likely lose less (gains are few and far between in a bear market). Note that SPHQ was down around 9% from its high in mid January and is currently 4% below its high. There are some chart links to the other risk indicators below the chart.
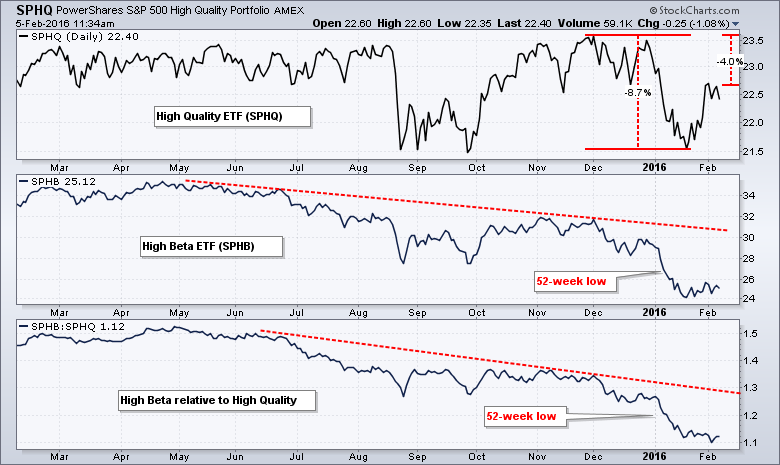
Charts: Equal-weight/Large-cap - Small-cap/Mega-cap - High Beta/High Quality - Stocks/Treasuries - Discretionary/RSP - Housing/RSP - Retail/RSP - Junk/Treasuries - Junk/Investment Grade - TED Spread
T-Bond ETFs Extend Uptrends
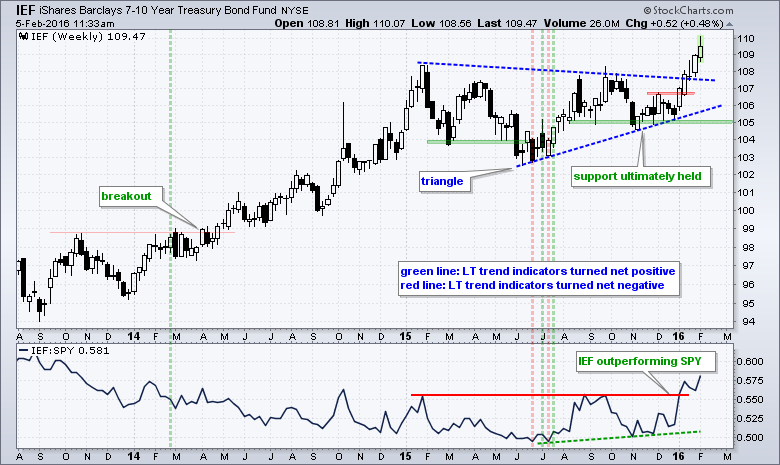
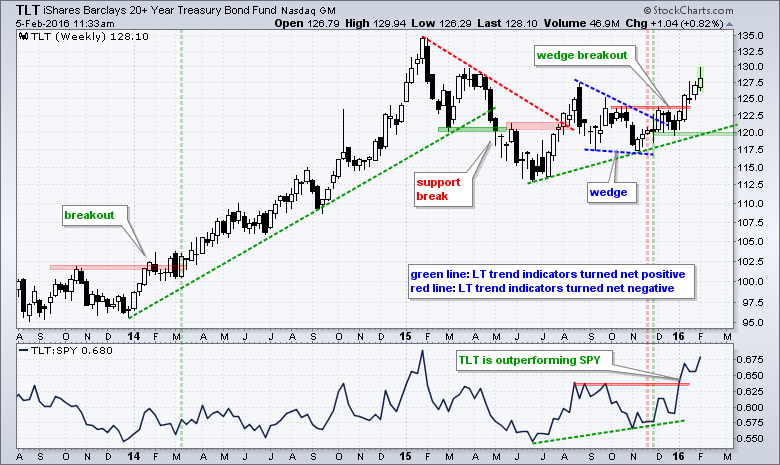
The 7-10 YR T-Bond ETF (IEF) extended its uptrend with a new high and the 20+ YR T-Bond ETF (TLT) exceeded its August high. Note that these prices are dividend adjusted, which means they are total return charts. The T-bond ETFs continued higher even as the stock market stalled the last three weeks. Thus, they continue to show relative strength and continue to outperform the stock market. As tempting as it is, I try to refrain from price targets because picking a future price level is really just a guessing game. Instead, I prefer to focus on trends and signals within that trend. IEF got a breakout the first week of January and broke the triangle trend line the second week.
TLT broke the wedge trend line in early December and exceeded horizontal resistance the second week of January. The December lows mark key support.
Big Move in Gold and GDX, but Still No Uptrend
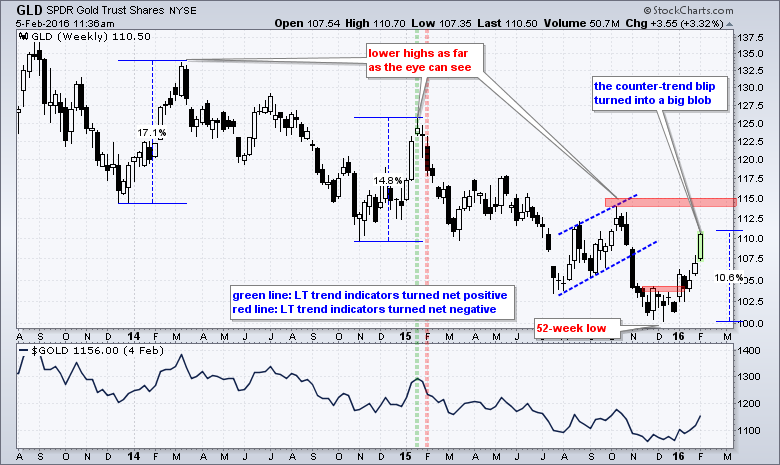
The Gold SPDR (GLD) surged around 10% from the December low to this week's high. The move is certainly big in percentage terms, but it is still a counter-trend bounce within a bigger downtrend. Even though it is turning into one heck of a move, we have seen double digit surges fizzle in the past (March 2014 and January 2015). I do not know if this move will trigger a breakout or a trend reversal. All I know is that I have yet to get a long-term bullish trend signal on gold. The trend indicators remain net bearish and GLD has yet to forge a higher high. As noted before, a breakout at 115 is needed to forge a higher high and reverse this downtrend. Until we see a higher high, the dominant chart features are the lower highs and the 52-week low in December.
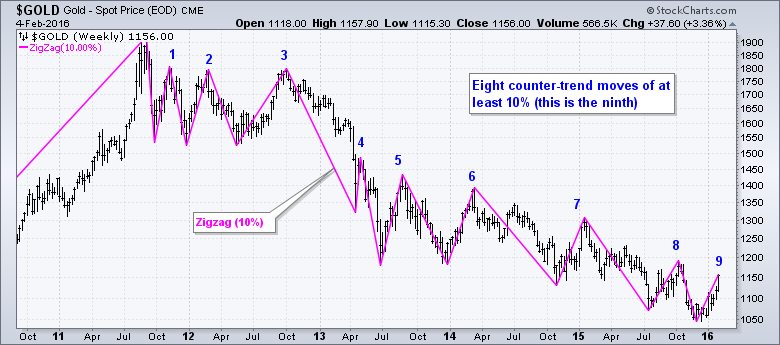
The 10% Zigzag indicators shows eight bounces of at least 10% since the peak in July 2011. We are currently in the ninth, but the downtrend ain't over until a break above the last peak. By the way, ninth does not refer to the ninth inning!
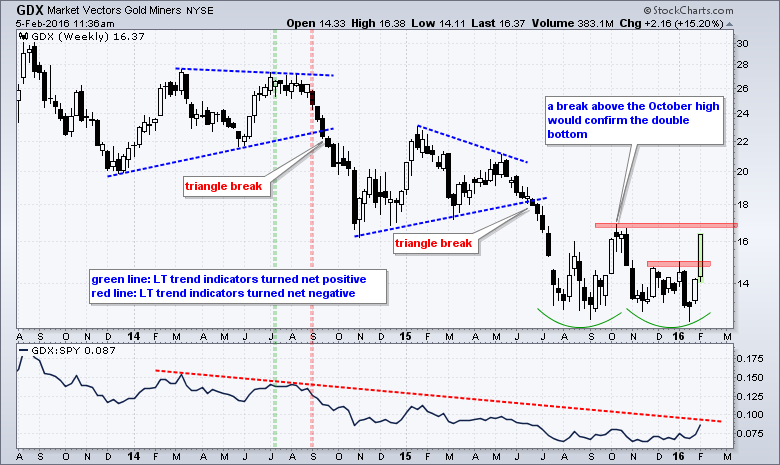
The Gold Miners ETF (GDX) surged as well and broke above its first resistance level at 15. A bigger double bottom may be in the making, but this pattern would not be confirmed unless GDX breaks the October high. Also note that the long-term trend indicators are still net bearish and GDX hit a 52-week low in mid January (less than 3 weeks ago).
Dollar Tests Wedge Breakout
The long-term trend indicators remain net positive for the US Dollar ETF (UUP), but the ETF broke below its December low and could negate its breakout this week. It depends on where the ETF closes on Friday. The wedge breakout was the dominant chart feature and it would be bearish if negated. In any case, this week's decline is sending a message and I will mark resistance at 26. UUP needs a break above this level to regain its uptrend.
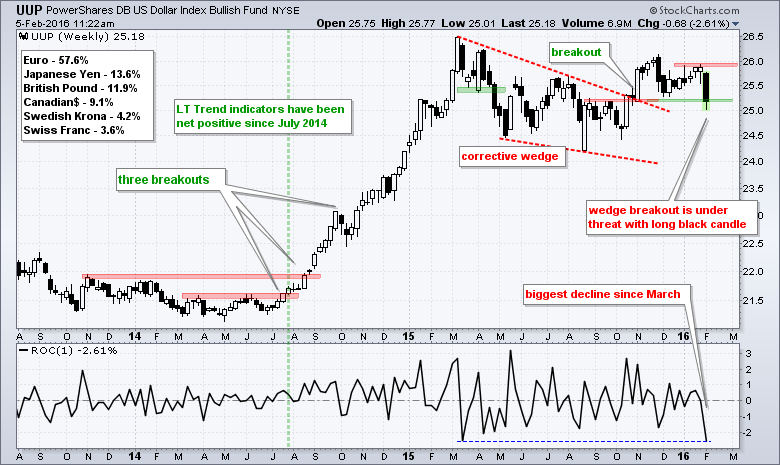
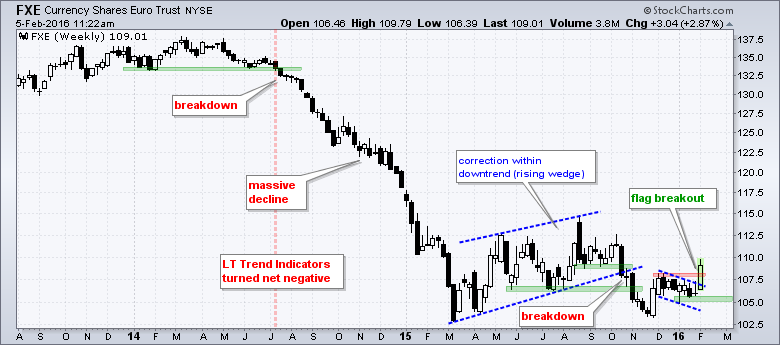
The Euro ETF (FXE) got a flag breakout and I will now mark support at 105.
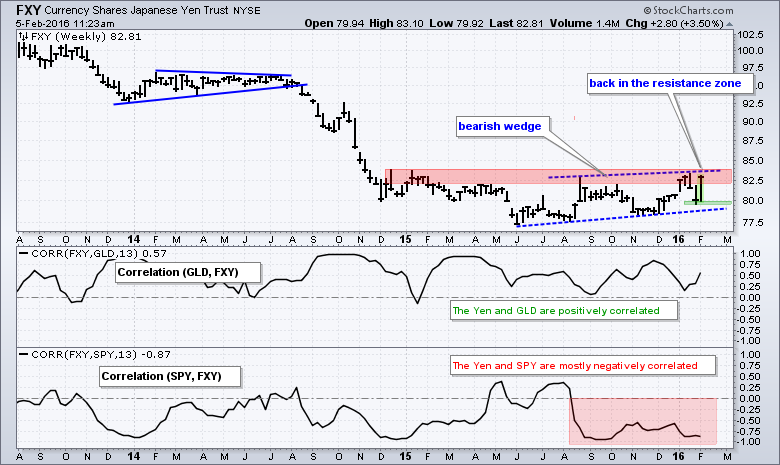
Yen Defies BoJ with Resistance Challenges
The Yen ETF (FXY) fell sharply last week as the Bank of Japan announced a negative interest rate policy, but recovered its losses this week with a monster gain. The market appears to have a different opinion than the BoJ. This is partly due to Dollar weakness and partly due to the demand for risk-off assets. In any case, the Yen has yet to actually break out and is once again challenging resistance. The Yen and gold have a strong positive correlation so a breakout in the Yen would be bullish for gold. Another failure at resistance would be negative for gold.
Friday Food For Thought
The Confounding Bias for Investment Complexity (Jason Hsu and John West, Research Affiliates)
Simplicity leads to better investor outcomes not because simplicity in and of itself produces better investment returns, but because a simple strategy encourages investors to own their decisions and to less frequently overreact to short-term noise.
Even God Would Get Fired as an Active Investor (Wesley R. Gray, Ph.D., Alpha Architect)
....sometimes, research uncovers absolutely stunning and counter-intuitive results–and this is where things get truly exciting. The study below is what we consider “exciting” research because the results are so profound (at least to us).
Do Defensive Sectors Outperform in Down Markets? (Andrew Birstingl, Factset Insight)
With U.S. stock indices in the red to start the year and market volatility beginning to climb, some are suggesting that investing in the defensive sectors may be a smart bet. The intuition here is that companies in the defensive sectors, like Consumer Staples, Utilities, and Health Care, have lower betas and are, therefore, less prone to changes in the business cycle. Do defensive sectors outperform in down markets and, if so, by how much? How do defensive sectors perform during varying levels of market volatility?
The Future of Movies Is Here: Netflix and Amazon Are Winning It (Jeremy Bowman, The Motley Fool)
At the Sundance Film Festival this week, the nation's largest independent film festival and a prime market for independent movies, Amazon and Netflix have thus far been the two biggest buyers. As of writing, Amazon has acquired five movies and Netflix has nabbed four.
Other Commentary Links
Bear Market Bounces - Understanding Bear Market Patterns, Signals and Retracements.
Measuring Risk On-Risk Off - Using charts to quantify stock, economic and credit risk.
PPO Trading Strategy - How to use 3 PPOs to develop a trend-reversion trading strategy.
Long-term Trend Indicators - Using the PPO, EMA Slope and CCI to determine the trend.
ETF Master ChartPack - 300+ ETFs organized in a Master ChartList and in individual groups.
Follow me on Twitter @arthurhill - Keep up with my 140 character commentaries.
****************************************
Thanks for tuning in and have a good day!
--Arthur Hill CMT
Plan your Trade and Trade your Plan
*****************************************


