Eight Risk Ratios to Watch // Replay of October Surge // SPY and the PPO Strategy // QQQ and IWM Trends Remain Mixed // Feds Talk and Bonds Balk // Oil Set to Test Breakout // Finance Stalls Near Key Retracement // Precious Metals Take a Hit // Vacation Notice ////
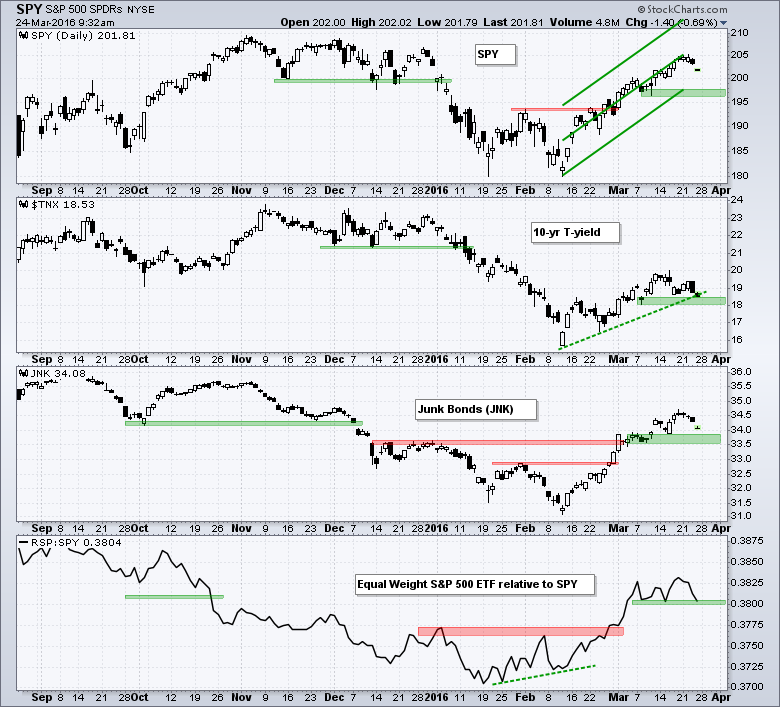
I am seeing a bit of deterioration in the risk indicators, but no breakdowns just yet. The 10-YR Treasury Yield ($TNX) fell sharply and is poised to test the lower limits of its uptrend (green zone). A close below 18 (1.8%) would reverse this uptrend and be negative for stocks. The High Yield Bond SPDR (JNK) fell back over the last two days, but this is not enough to call for a downtrend or trend reversal. The EW S&P 500 ETF (RSP) started outperforming SPY again last week, but fell back over the last few days. The mid March lows mark the key levels to watch. A break here would show relative weakness in the average stock and this would be negative for the broader market.
Eight Risk Ratios to Watch
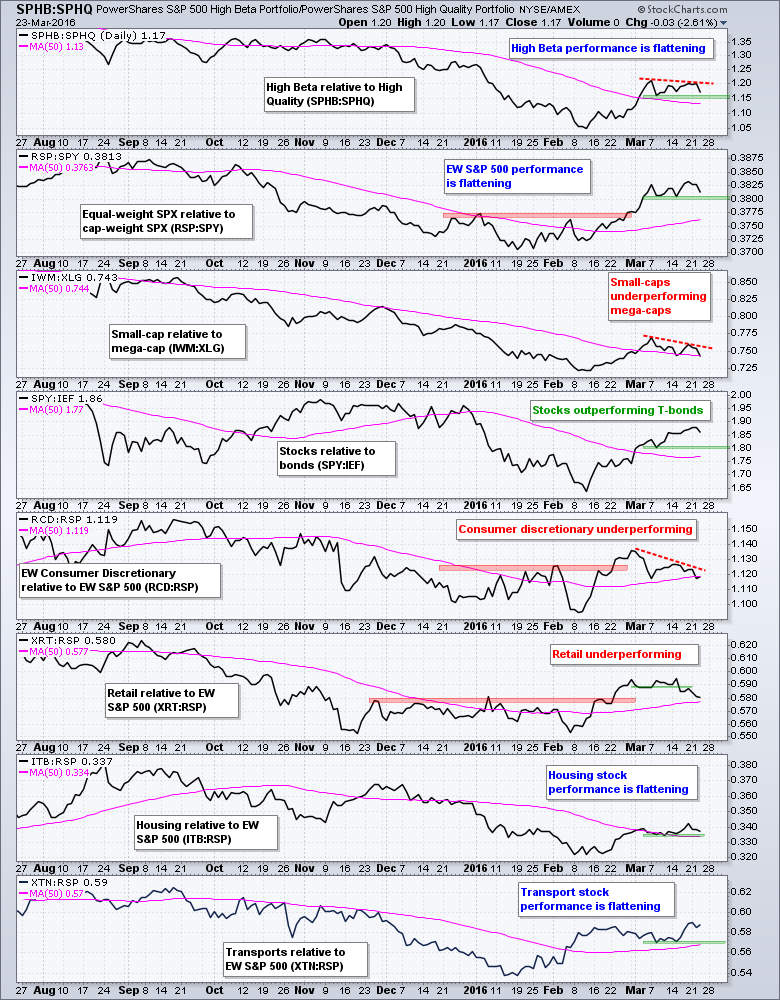
The next chart shows eight ratios I use to track the risk appetite in the stock market. The risk appetite is strong when these ratios rise, which means the numerator is outperforming the denominator. The risk appetite is weak when these ratios fall. I am mostly focused on what is happening in March for clues on the current rally. Three turned down, four are flat and one is rising. In particular, retail and consumer discretionary are underperforming in March, and small-caps are underperforming mega-caps. I will be watching the four flat ratios for the next directional clue. Breakdowns in these ratios would suggest risk aversion and this would be negative for stocks.
Replay of October Surge
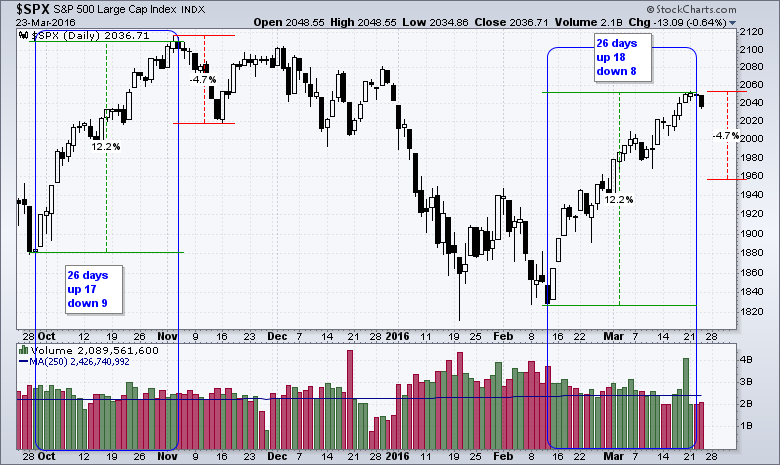
I showed this chart on Tuesday and will show it again because the similarities are quite amazing. The Sep-Oct-Nov advance lasted 26 days and added 12% with 17 up days and 9 down days. The current advance lasted 26 days and added 12% with 18 up days and 8 down days. The highest close of the current move was on Tuesday. While I realize the index has been overbought for four weeks and picking a top is a dangerous game, the October advance shows just how sharp a pullback can be. Notice that the index fell around 4.7% in eight days. A similar decline would put the index back near 1960.
SPY and the PPO Strategy
The next chart shows SPY with the Percentage Price Oscillators. The price chart analysis is unchanged with the Raff Regression Channel, 10-Mar low and a buffer marking support in the 196-198 area. This zone is around 4% from the March high and I am giving the uptrend some room to maneuver after a 12% advance in six weeks.
The indicator windows show the short-term PPO (5,30,1) with a 5-period EMA, the medium-term PPO (10,60,1) and the long-term PPO (20,120,1). The medium-term PPO turned positive in early March and the long-term PPO turned positive in mid March. This means the trend filter is bullish and bullish setups are preferred. The short-term PPO is quite extended now and a bullish setup would not materialize until it moves back towards the zero line. The blues lines are set at +1 and -1 to mark the zone around zero.
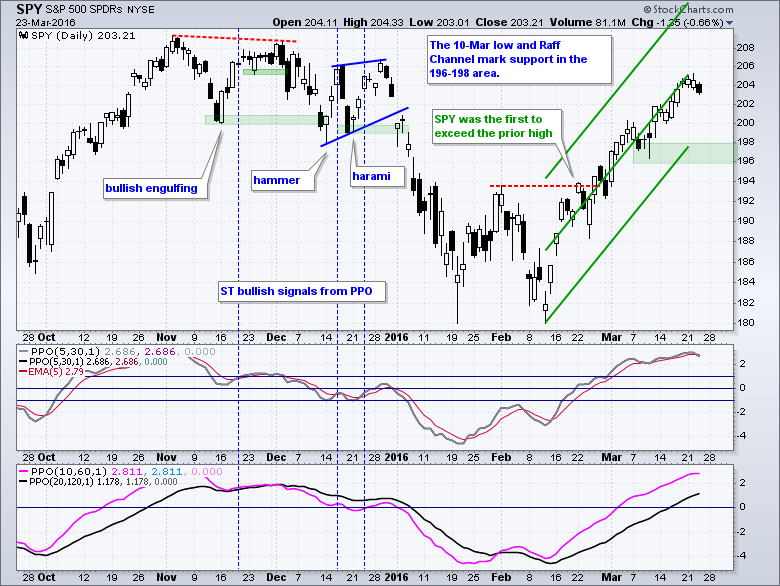
As noted before, this strategy seeks to identify the bigger trend and then look for pullbacks within that trend. The blue dotted lines show short-term bullish signals in November and December. A short-term bullish setup occurs when the trend filter is bullish and the short-term PPO moves to the zero area. A signal triggers when the PPO crosses back above the zero line or back above its signal line. The three signals in November-December did not work out well because SPY formed lower highs in December and broke down in January.
We cannot eliminate loosing trades, but we can sometimes cut losses by looking at price action once a setup occurs. The PPO is based on exponential moving average and this means it will lag the price action. Notice that a bullish engulfing formed after the setup in November and chartists could have used this for an earlier entry. The trade still failed, but an earlier entry based on a bullish candlestick would have lowered the loss. A hammer formed before the 16-Dec signal and a harami formed before the 23-Dec signal. Should SPY pull back in the next week or two, chartists may then watch for a bullish candlestick or a gap to trigger a short-term reversal.
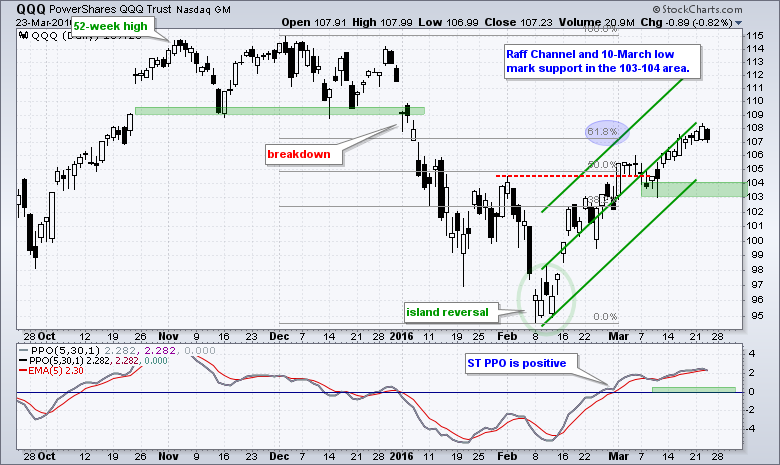
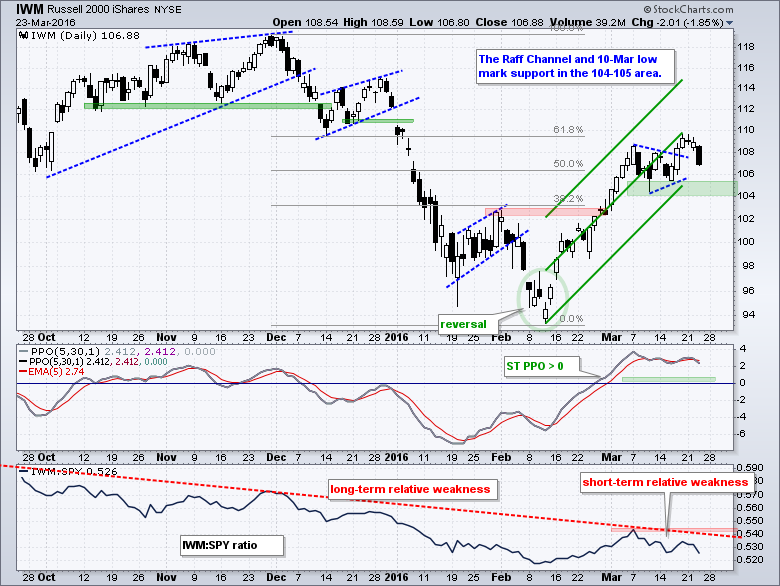
QQQ and IWM Trends Remain Mixed
The medium-term PPOs are positive for QQQ and IWM, but the long-term PPOs are still negative. This tells us that we still have a mixed market and SPY is the clear leader. In fact, this also means that the bounces in QQQ and IWM could be bear market rallies. Notice that they retraced around 61.8% of the prior decline and neither managed to exceed the January support break. QQQ and IWM are still above short-term support and these levels have not changed. Note that small-caps led the way down on Wednesday and IWM failed to hold the pennant breakout.
Feds Talk and Bonds Balk
A funny thing happened on the way to the bond pits on Wednesday. Fed presidents Harker and Bullard came out with some relatively hawkish comments. These comments allegedly pushed the Dollar higher and commodities lower. Normally, the bond market would fall on such comments and Treasury yields would rise. They did the opposite. Price action is clearly greater than words and I would watch the bond market first.
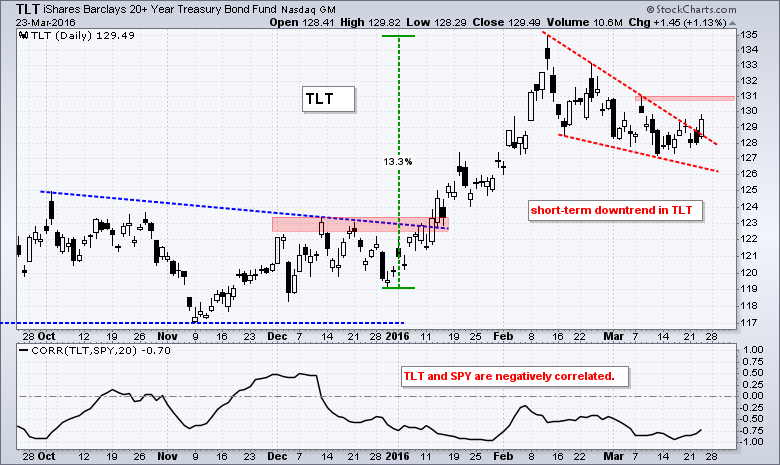
The 20+ YR T-Bond ETF (TLT) is important to watch because there is a strong negative correlation between TLT and SPY. In other words, they move in opposite directions. TLT bottomed two weeks ago and surged over 1% on Wednesday. The ETF broke the wedge trend line, but I think this trend line is a bit steep and would not call it "hard" resistance. It just represents the slope of the recent decline. I am setting resistance at 131 and a breakout here would reverse the short-term downtrend and signal a continuation of the prior advance. Such a breakout would be most negative for stocks.
Oil Set to Test Breakout
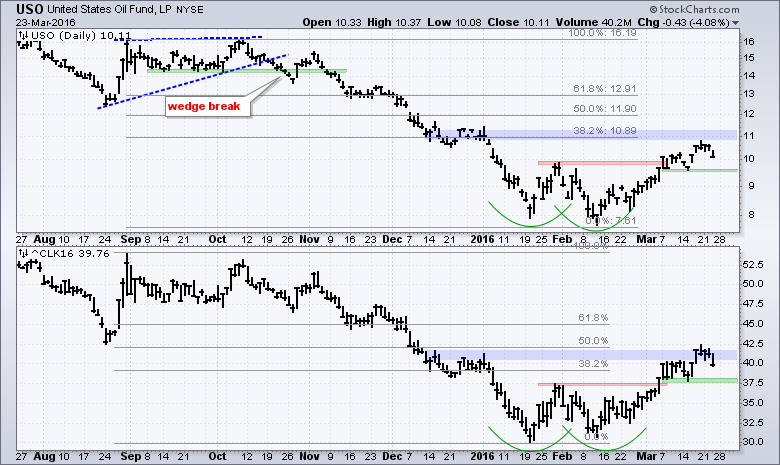
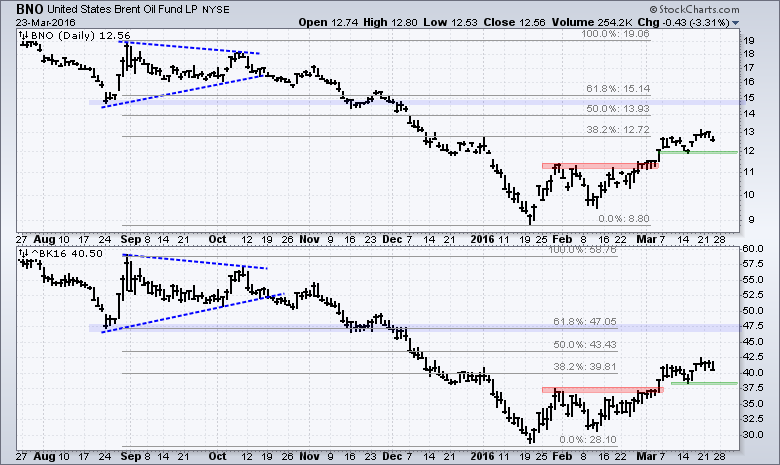
If the stock market is moving along with oil, then we best keep a close watch on Brent and Light Crude. The USO Oil Fund (USO) and May Crude (^CLK16) formed small double bottoms and broke out in early March. Both are up double digits the last six weeks and the breakouts are still holding, despite a sharp decline on Wednesday. I am using last week's lows to mark first support and a break below these lows would be bearish. Keep in mind that the long-term trend is down and oil hit a 52-week low earlier this year.
Finance Stalls Near Key Retracement
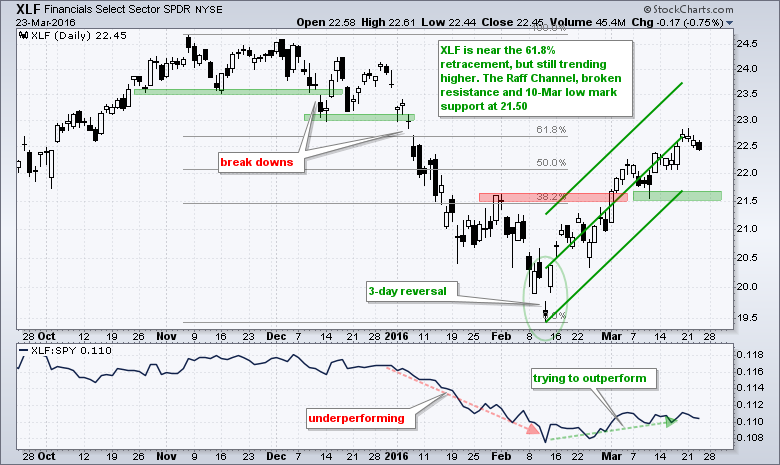
The Finance SPDR (XLF) is stalling near the 62% retracement line and trading just below the January support break. This is a potential reversal zone, but the immediate trend is still up with support marked at 21.50
The Energy SPDR (XLE) turned back at its falling 200-day moving average for the third time in twelve months.

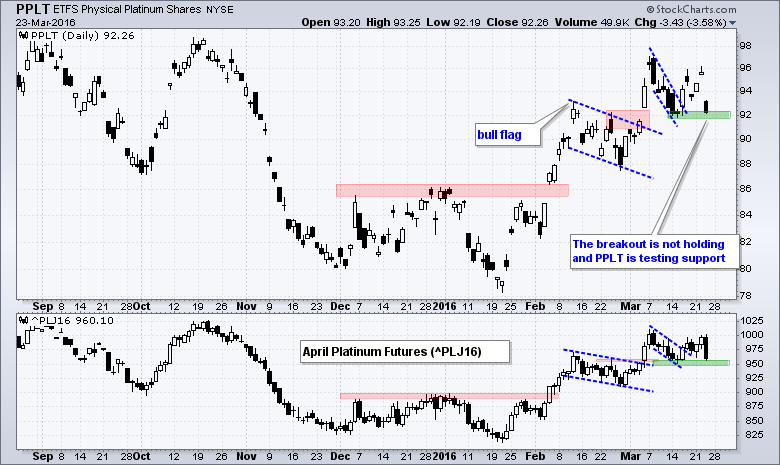
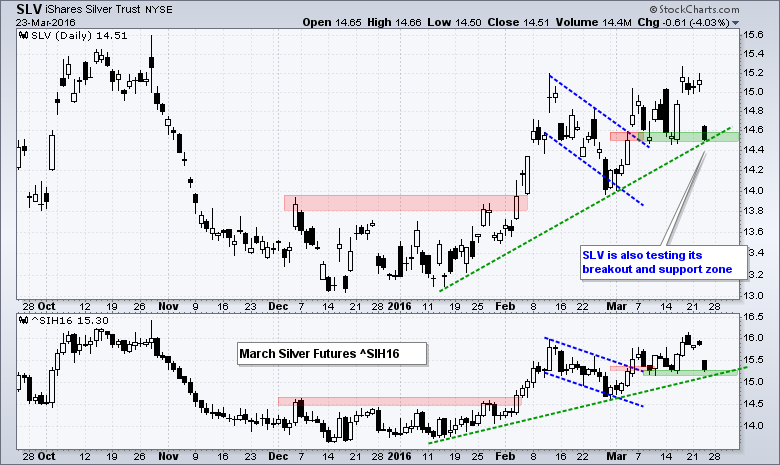
Precious Metals Take a Hit
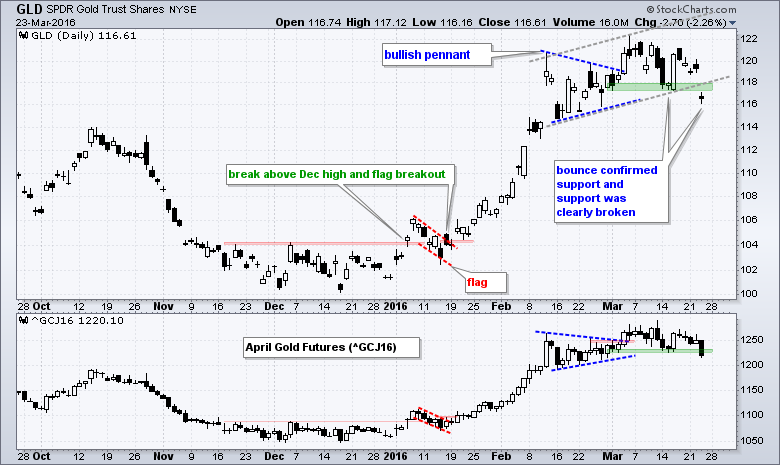
The Gold SPDR (GLD) got roughed up on Wednesday and broke support in the 117.5 area. The ETF confirmed support here by bouncing off this area after the pennant breakout. The bounce did not last long as GLD broke support with a sharp decline on Wednesday. There is a case to be made for a long-term uptrend, but I think the short-term trend is down and a correction of some sort is underway. I would show a US Dollar ETF (UUP) chart, but I cannot make heads or tails on the directional probabilities.
Vacation Notice
Note that I will be taking a family vacation from March 28th (Monday) to April 8th (Friday). I will not publish commentaries during this period and will return to action on Monday, April 11th. Happy Easter!
**************************
Bear Market Bounces - Understanding Bear Market Patterns, Signals and Retracements.
Measuring Risk On-Risk Off - Using charts to quantify stock, economic and credit risk.
PPO Trading Strategy - How to use 3 PPOs to develop a trend-reversion trading strategy.
Long-term Trend Indicators - Using the PPO, EMA Slope and CCI to determine the trend.
ETF Master ChartPack - 300+ ETFs organized in a Master ChartList and in individual groups.
Follow me on Twitter @arthurhill - Keep up with my 140 character commentaries.
****************************************
Thanks for tuning in and have a good day!
--Arthur Hill CMT
Plan your Trade and Trade your Plan
*****************************************


